As Ready Capital (NYSE:RC) rallies 4.7% this past week, investors may now be noticing the company's three-year earnings growth
In order to justify the effort of selecting individual stocks, it's worth striving to beat the returns from a market index fund. But in any portfolio, there are likely to be some stocks that fall short of that benchmark. Unfortunately, that's been the case for longer term Ready Capital Corporation (NYSE:RC) shareholders, since the share price is down 41% in the last three years, falling well short of the market return of around 21%. Shareholders have had an even rougher run lately, with the share price down 21% in the last 90 days. We note that the company has reported results fairly recently; and the market is hardly delighted. You can check out the latest numbers in our company report.
Although the past week has been more reassuring for shareholders, they're still in the red over the last three years, so let's see if the underlying business has been responsible for the decline.
View our latest analysis for Ready Capital
There is no denying that markets are sometimes efficient, but prices do not always reflect underlying business performance. One way to examine how market sentiment has changed over time is to look at the interaction between a company's share price and its earnings per share (EPS).
Although the share price is down over three years, Ready Capital actually managed to grow EPS by 34% per year in that time. Given the share price reaction, one might suspect that EPS is not a good guide to the business performance during the period (perhaps due to a one-off loss or gain). Or else the company was over-hyped in the past, and so its growth has disappointed.
Since the change in EPS doesn't seem to correlate with the change in share price, it's worth taking a look at other metrics.
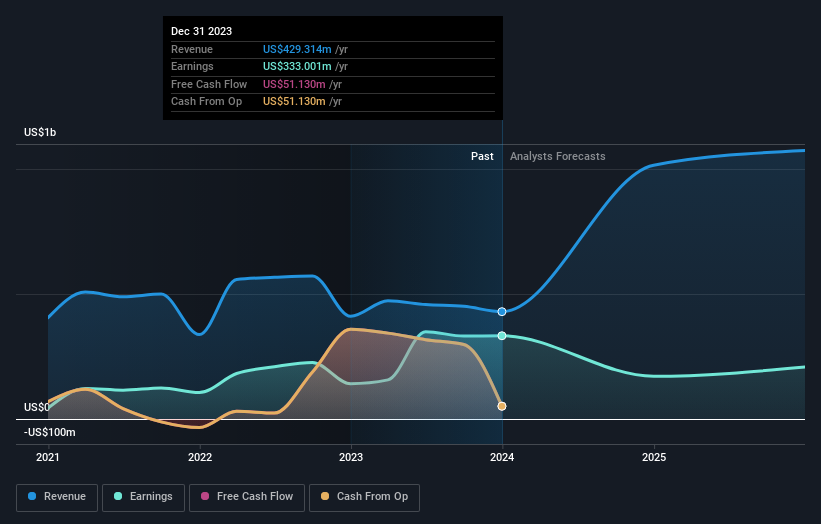
Given the healthiness of the dividend payments, we doubt that they've concerned the market. Revenue has been pretty flat over three years, so that isn't an obvious reason shareholders would sell. A closer look at revenue and profit trends might yield insights.
You can see below how earnings and revenue have changed over time (discover the exact values by clicking on the image).
We know that Ready Capital has improved its bottom line over the last three years, but what does the future have in store? Take a more thorough look at Ready Capital's financial health with this free report on its balance sheet.
What About Dividends?
When looking at investment returns, it is important to consider the difference between total shareholder return (TSR) and share price return. Whereas the share price return only reflects the change in the share price, the TSR includes the value of dividends (assuming they were reinvested) and the benefit of any discounted capital raising or spin-off. Arguably, the TSR gives a more comprehensive picture of the return generated by a stock. As it happens, Ready Capital's TSR for the last 3 years was -15%, which exceeds the share price return mentioned earlier. This is largely a result of its dividend payments!