
andresr/E+ via Getty Images
andresr/E+ via Getty Images
The SPDR S&P Transportation ETF (NYSEARCA:XTN) is a passively managed fund that tracks the S&P Transportation Select Industry Index. The fund seeks to provide exposure to a variety of sub-industries including air freight, passenger planes, airports, highway, rail, marine transportation, ports, and ground cargo/passenger transportation. The fund uses a modified equal weighting system.
We rate XTN a sell, and overall didn't find a transportation ETF we liked. The significant overweight to the size factor due to XTN's relatively low average weighted market cap is not an exposure we are looking for when it comes to industry ETFs. Smaller public companies continue to be under pressure from a variety of directions, including higher debt ratios than larger companies, and the dominance of indexed investing, which has created a lopsided demand for the largest companies. This may turn around at some point and make smaller stocks more competitive as a whole, but we are not sticking our necks out on the timing of that.
Additionally, although the transportation industry seems poised for decent growth this year, we have no reason to believe that it will outperform relative to the broad U.S. equity market. Thus, XTN is a sell.
The transportation industry has done a great job of recovering from the disruption caused by the pandemic. We see that in 2023, airport traffic finally reached pre-pandemic levels. This is a great sign for the transportation industry in general, but it may also be a sign that growth will be harder to come by going forward.
U.S. Dept of Transportation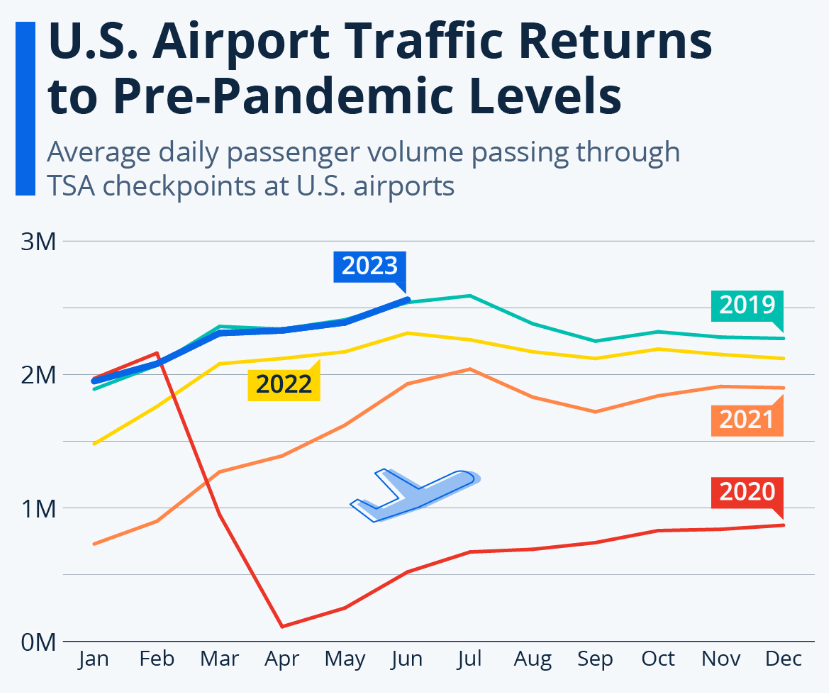
We see the same normalization when it comes to ports. Volumes in ports shot up in 2021 and 2022, leading to much maligned delays and congestion. Those numbers have finally come down to levels seen in 2019. This should increase the efficiency these companies can operate with, but again we feel that these gains may already be baked in at this point.
Supply Chain Dive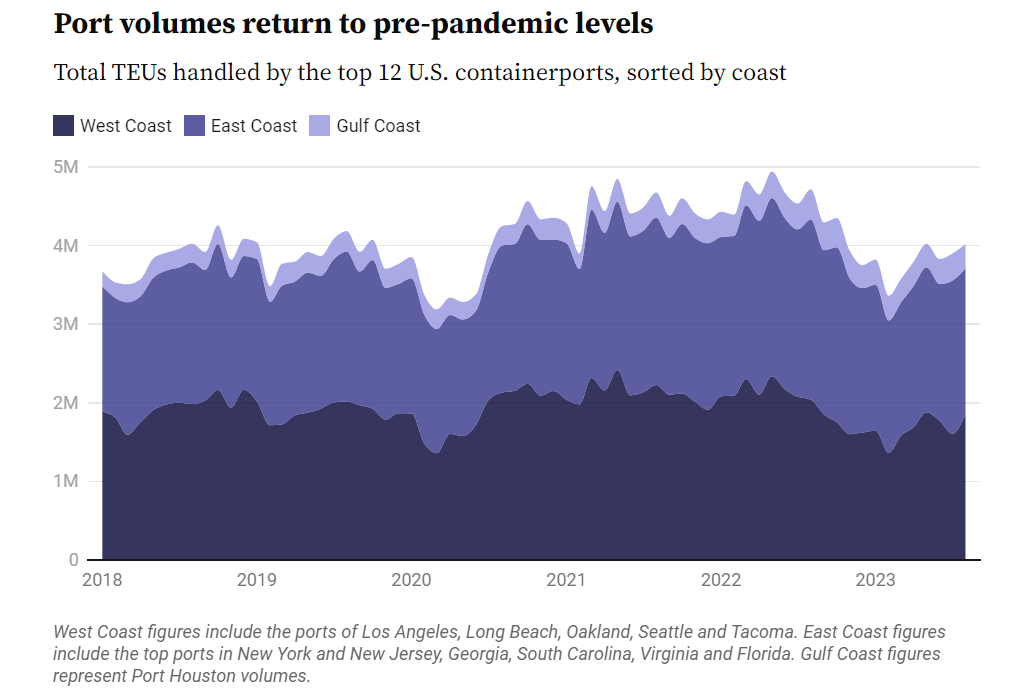
Again, this is true for toll roads as well, with most toll operators having their revenues recover to pre-pandemic levels in 2022.
S&P Global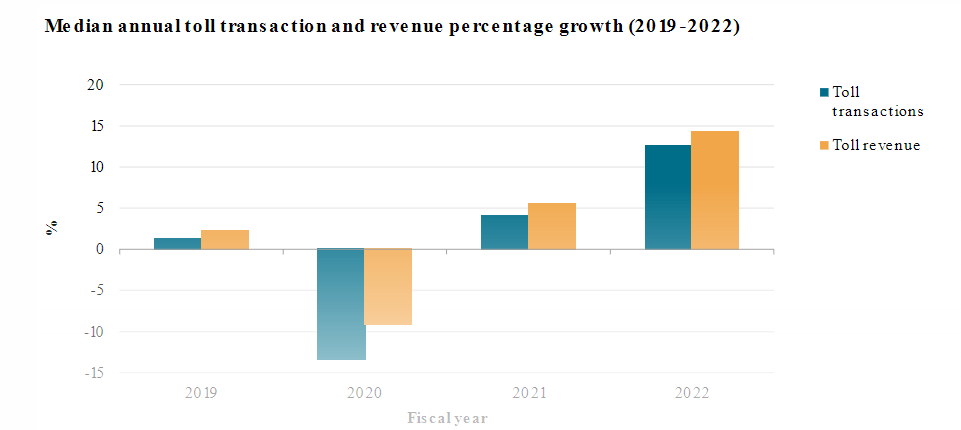
Overall, it seems that the somewhat artificial growth that the industry was able to achieve due to recovering from the pandemic has played out, and mild growth should be expected ahead, not making us too keen to invest directly in the sector.
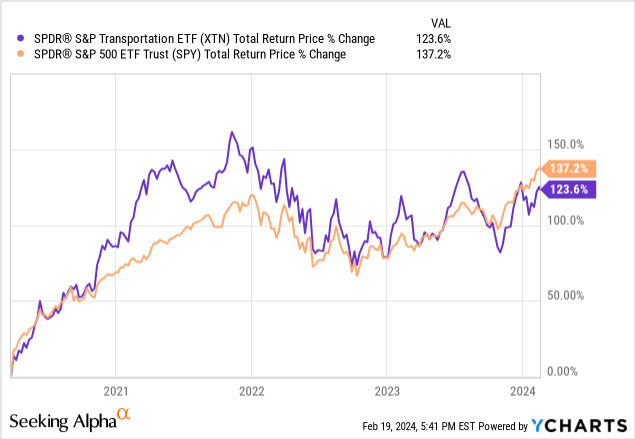
The chart below shows this in vivid color. Investors may be surprised to learn that from the bottom of the pandemic crash in 2020 through the end of last year, XTN was actually even with the S&P 500. And for most of that nearly 4-year period, XTN was ahead. But that was then, and our focus is on the future.
State Street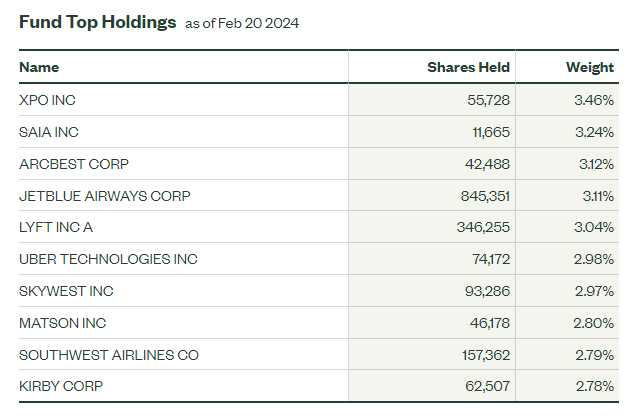
XPO, Inc. (XPO) and SAIA, Inc. (SAIA) are providers of less-than-truckload services. XPO, Inc. is the second-largest firm in North America, while SAIA Inc ranks in the top 10 in the United States. Less-than-truckload services transport goods for multiple customers on the same truck at the same time. Investing in these types of companies can add value, as the business model can significantly reduce shipping costs by eliminating wasted space on trucks.
We are not interested in XTN due to its high exposure to smaller companies. With large cap outperforming small cap over the last several years, having such a huge overweight to small cap in an industry ETF doesn't seem prudent to us. We are not willing to make a call that the relationship between small and large cap will change any time soon. See below for XTN's factor breakdown.
MSCI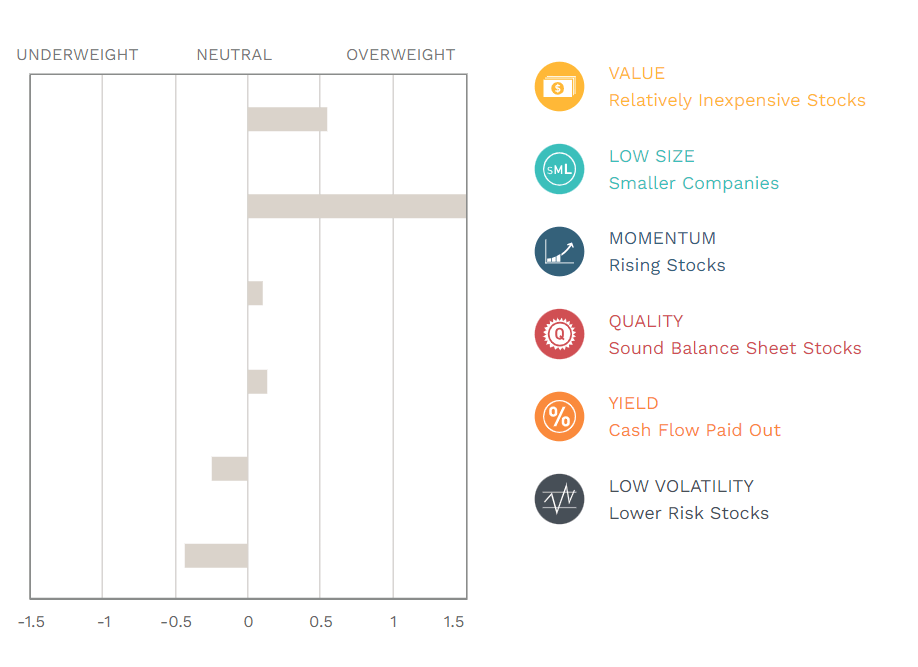
The table below compares 3 transportation ETFs on various metrics.
Symbol | Total Assets Under Management | Weighted Average Market Cap | Net Expense Ratio | Dividend Yield | Turnover Ratio | Percent of Assets in Top 10 Holdings |
XTN | $186,510,267 | $8,056 | 0.35% | 0.80% | 29% | 26% |
FTXR | $37,741,677 | $38,602 | 0.60% | 1.60% | 71% | 59% |
IYT | $905,717,768 | $43,882 | 0.40% | 1.30% | 13% | 73% |
By far the largest ETF in the space in IYT, the iShares Transportation Average ETF, with over $900 million in assets. XTN noticeably has a much lower average weighted holding market cap at 4-5 times smaller than FTXR or IYT. FTXR sticks out due to its much higher turnover ratio, which contributes to its higher fee. This turnover ratio is likely due to its modified factor weighted portfolio. The fund screens based on volatility, factor, and momentum. We are not so interested in exposing our portfolio to an excessive amount of factor risk when it comes to investing in industry-specific funds.
The dividends for all the funds are relatively low and make little to no difference to the investment decision for us between since they are all close; however, it should be mentioned that the dividends for all these funds are paid quarterly.
The thing that stands out most about IYT is the fund's extremely high concentration in the top 10 holdings, at 73%. This concentration became even more apparent when we saw that the top 3 holdings, Union Pacific Corporation (UNP), Uber Technologies, Inc. (UBER), and United Parcel Service (UPS), account for 44% of the holdings.
If we were to invest in IYT, we would want to be bullish on those three names as they will greatly influence the returns. For us, individual stock analysis is not our core competency, so we are avoiding IYT due to its abundance of stock specific risk. Let's look at the funds further on some other metrics.
Symbol | Weighted Average PE Ratio | Forecasted PE Ratio | Forecasted 5-Year Earnings Growth | STD DEV of Monthly Returns (5Y Lookback) | 5 Year Total Returns (Daily) |
XTN | 13.9 | 13.7 | 20.50% | 29.10% | 56.60% |
FTXR | 11.8 | 10.9 | 10.20% | 29.80% | 44.10% |
| IYT | 18.6 | 16.9 | 14.00% | 25.10% | 63.20% |
FTXR is currently the cheapest fund based off of P/E ratio. All the funds are expected to see their P/E ratios experience multiple contraction over the next year, however for XTN that contraction is only expected to be at 1% compared to 7% and 9% for FTXR and IYT, respectively. XTN has the highest 5 year expected earnings growth, which makes sense due to its much lower weighted average market cap. IYT has managed to have the highest returns combined with the lowest volatility of all three funds over the last 5 years, which may or may not continue.
Investing in transportation gives direct exposure to changes in oil prices, as it is one of the biggest inputs in the industry. It is likely that many firms utilize derivative contracts to smooth out the effect that price fluctuations in oil have on their earnings, but the indirect exposure to this risk is still there to some extent. It also became clear during COVID that the risks of government shutdowns in response to a virus are a real risk, and had an acute effect on the transportation industry, with travel generally being restricted, impacting trucking and airlines substantially.
The transportation industry carries a common risk: that many years of potential returns were front-loaded. In other words, the stocks in this group, particularly the small caps, have gotten ahead of themselves.
With a tepid outlook on the overall transportation industry and with no ETF in the space we really like, we aren't getting into the space right now. When it comes to XTN specifically, are primary concern is its small-cap exposure, we rate XTN a sell.