
da-kuk
da-kuk
As we round out the first quarter of 2024, I have 20 new dividend increases to share with you. They average an 8.5% increase, with a median of 8%. Read on for the complete lists!
As an investor utilizing a dividend-growth strategy, I always look forward to receiving dividends, especially increases. I have observed that companies that regularly raise their dividend payouts perform significantly better than those that do not. I constantly monitor these companies and am happy to share my insights on upcoming dividend increases. I have compiled a list of top stocks expected to raise dividends in the upcoming week. You can confidently use this analysis to construct your portfolio and make timely purchases.
The information presented here is a result of merging two sources of data - the "U.S. Dividend Champions" spreadsheet from this website and upcoming dividend data from NASDAQ. The process combines data on companies with a consistent dividend growth history with future dividend payments. It's important to understand that all companies included in this list have consistently grown in dividends for at least five years.
Companies must have higher total yearly dividends to be included in this list. Hence, a company may not increase its dividend every calendar year, but the total annual dividend can still grow.
The ex-dividend date is when you must purchase shares to be eligible for the upcoming dividend or distribution. To qualify, you must have bought the shares by the end of the preceding business day. For instance, if the ex-dividend date is Tuesday, you must have acquired the shares by the market close on Monday. If the ex-dividend date is a Monday (or a Tuesday following a holiday on Monday), you must have bought the shares by the previous Friday.
Here are the definitions of the streak categories, as I'll use them throughout the piece.
| Category | Count |
| King | 0 |
| Champion | 3 |
| Contender | 9 |
| Challenger | 8 |
Data was sorted by the ex-dividend date (ascending) and then by the streak (descending):
| Name | Ticker | Streak | Forward Yield | Ex-Div Date | Increase Percent | Streak Category |
| Bank First Corporation | (BFC) | 10 | 1.68 | 26-Mar-24 | 16.67% | Contender |
| Essex Property Trust, Inc. | (ESS) | 30 | 4.07 | 27-Mar-24 | 6.06% | Champion |
| W. P. Carey Inc. REIT | (WPC) | 26 | 6.14 | 27-Mar-24 | 0.58% | Champion |
| Equity Lifestyle Properties, Inc. | (ELS) | 20 | 2.73 | 27-Mar-24 | 6.71% | Contender |
| Camden Property Trust | (CPT) | 15 | 4.19 | 27-Mar-24 | 3.00% | Contender |
| DENTSPLY SIRONA Inc. | (XRAY) | 13 | 1.92 | 27-Mar-24 | 14.29% | Contender |
| Steel Dynamics, Inc. | (STLD) | 13 | 1.29 | 27-Mar-24 | 8.24% | Contender |
| First Industrial Realty Trust, Inc. | (FR) | 12 | 2.85 | 27-Mar-24 | 15.63% | Contender |
| Rexford Industrial Realty, Inc. | (REXR) | 11 | 3.3 | 27-Mar-24 | 10.00% | Contender |
| Amdocs Limited - Ordinary Shares | (DOX) | 11 | 1.93 | 27-Mar-24 | 10.11% | Contender |
| Danaher Corporation | (DHR) | 10 | 0.43 | 27-Mar-24 | 12.50% | Contender |
| FirstService Corporation - Common Shares | (FSV) | 9 | 0.53 | 27-Mar-24 | 11.11% | Challenger |
| Dick's Sporting Goods Inc | (DKS) | 9 | 2 | 27-Mar-24 | 10.00% | Challenger |
| CareTrust REIT, Inc. | (CTRE) | 9 | 4.8 | 27-Mar-24 | 3.57% | Challenger |
| Sun Communities, Inc. | (SUI) | 8 | 2.87 | 27-Mar-24 | 1.08% | Challenger |
| Stantec Inc | (STN) | 8 | 0.97 | 27-Mar-24 | 7.70% | Challenger |
| Willis Towers Watson Public Limited Company - Ordin... | (WTW) | 8 | 1.28 | 27-Mar-24 | 4.76% | Challenger |
| Nutrien Ltd. Common Shares | (NTR) | 7 | 4.03 | 27-Mar-24 | 1.89% | Challenger |
| Monolithic Power Systems, Inc. | (MPWR) | 7 | 0.75 | 27-Mar-24 | 25.00% | Challenger |
| Air Products and Chemicals, Inc. | (APD) | 42 | 2.96 | 28-Mar-24 | 1.14% | Champion |
Streak: Years of dividend growth history are sourced from the U.S. Dividend Champions spreadsheet.
Forward Yield: The new payout rate is divided by the current share price.
Ex-Dividend Date: This is the date you need to own the stock.
Increase Percent: The percent increase.
Streak Category: This is the company's overall dividend history classification.
Here's a table mapping the new rates versus the old rates. It also reiterates the percentage increase. This table is sorted similarly to the first (ex-dividend day ascending, dividend streak descending).
| Ticker | Old Rate | New Rate | Increase Percent |
| BFC | 0.3 | 0.35 | 16.67% |
| ESS | 2.31 | 2.45 | 6.06% |
| WPC | 0.86 | 0.865 | 0.58% |
| ELS | 0.447 | 0.477 | 6.71% |
| CPT | 1 | 1.03 | 3.00% |
| STLD | 0.425 | 0.46 | 8.24% |
| XRAY | 0.14 | 0.16 | 14.29% |
| FR | 0.32 | 0.37 | 15.63% |
| REXR | 0.38 | 0.418 | 10.00% |
| DOX | 0.435 | 0.479 | 10.11% |
| DHR | 0.24 | 0.27 | 12.50% |
| FSV | 0.225 | 0.25 | 11.11% |
| DKS | 1 | 1.1 | 10.00% |
| CTRE | 0.28 | 0.29 | 3.57% |
| WTW | 0.84 | 0.88 | 4.76% |
| SUI | 0.93 | 0.94 | 1.08% |
| STN | .195 CAD | .21 CAD | 7.70% |
| NTR | 0.53 | 0.54 | 1.89% |
| MPWR | 1 | 1.25 | 25.00% |
| APD | 1.75 | 1.77 | 1.14% |
Some different metrics related to these companies include yearly pricing action and the P/E ratio. The table is sorted the same way as the table above.
| Ticker | Current Price | 52 Week Low | 52 Week High | PE Ratio | % Off Low | % Off High |
| BFC | 83.12 | 63.56 | 91.87 | 14.62 | 31% Off Low | 10% Off High |
| ESS | 240.63 | 187.07 | 251.77 | 27.73 | 29% Off Low | 4% Off High |
| WPC | 56.36 | 49.91 | 73.19 | 26.9 | 13% Off Low | 23% Off High |
| ELS | 65.57 | 60.09 | 73.58 | 50.25 | 9% Off Low | 11% Off High |
| CPT | 98.35 | 81.97 | 111.69 | 53.06 | 20% Off Low | 12% Off High |
| STLD | 142.71 | 88.84 | 143.43 | 16.95 | 61% Off Low | 1% Off High |
| XRAY | 33.28 | 26.06 | 42.25 | 0 | 28% Off Low | 21% Off High |
| FR | 51.99 | 40.2 | 55.15 | 25.51 | 29% Off Low | 6% Off High |
| DOX | 92.42 | 77.6 | 97.76 | 18 | 19% Off Low | 5% Off High |
| REXR | 50.65 | 41.28 | 58.76 | 87.14 | 23% Off Low | 14% Off High |
| DHR | 251.55 | 181.9 | 269 | 52.25 | 38% Off Low | 6% Off High |
| DKS | 219.48 | 100.27 | 222.92 | 13.7 | 119% Off Low | 2% Off High |
| FSV | 169.66 | 130.55 | 171.94 | 83.32 | 30% Off Low | 1% Off High |
| CTRE | 24.19 | 16.9 | 24.29 | 24.66 | 43% Off Low | 0% Off High |
| SUI | 131.23 | 102.03 | 140.86 | 93.01 | 29% Off Low | 7% Off High |
| WTW | 274.59 | 192.38 | 278.86 | 43% Off Low | 2% Off High | |
| STN | 86.49 | 54.41 | 87.53 | 22.93 | 59% Off Low | 1% Off High |
| MPWR | 666.98 | 378.81 | 778.15 | 92.02 | 76% Off Low | 14% Off High |
| NTR | 53.64 | 47.9 | 73.53 | 261.72 | 12% Off Low | 27% Off High |
| APD | 238.95 | 212.24 | 303.88 | 31.48 | 13% Off Low | 21% Off High |
I've arranged the table in descending order, so investors can prioritize the current yield. As a bonus, the table also features some historical dividend growth rates. Moreover, I have incorporated the "Chowder Rule," which is the sum of the current yield and the five-year dividend growth rate.
| Ticker | Yield | 1 Yr DG | 3 Yr DG | 5 Yr DG | 10 Yr DG | Chowder Rule |
| WPC | 6.14 | -4.1 | -0.9 | -0.1 | 1.8 | 6.1 |
| CTRE | 4.8 | 1.8 | 3.9 | 6.4 | 11.2 | |
| CPT | 4.19 | 6.4 | 6.4 | 5.4 | 4.7 | 9.6 |
| ESS | 4.07 | 5 | 3.6 | 4.4 | 6.7 | 8.6 |
| NTR | 4.03 | 10.4 | 5.6 | 5.4 | 6 | 9.5 |
| REXR | 3.3 | 20.6 | 20.9 | 18.9 | 21.9 | 22.2 |
| APD | 2.96 | 8 | 9.3 | 9.7 | 9.5 | 12.6 |
| SUI | 2.87 | 5.7 | 5.6 | 5.6 | 4 | 8.5 |
| FR | 2.85 | 8.5 | 8.6 | 8 | 14.2 | 10.9 |
| ELS | 2.73 | 9.2 | 9.3 | 10.2 | 13.6 | 12.9 |
| DKS | 2 | 105.1 | 47.4 | 34.8 | 23.1 | 36.9 |
| DOX | 1.93 | -11.9 | 9.9 | 11.7 | 12.8 | 13.6 |
| XRAY | 1.92 | 12 | 11.9 | 9.9 | 8.4 | 11.8 |
| BFC | 1.68 | 86.2 | 29.3 | 20.8 | 23.1 | 22.5 |
| STLD | 1.29 | 0 | 19.4 | 17.8 | 14.5 | 19.1 |
| WTW | 1.28 | 2.4 | 6.9 | 7 | 1.3 | 8.3 |
| STN | 0.97 | 6.3 | 8.2 | 7 | 6.3 | 8 |
| MPWR | 0.75 | 33.3 | 26 | 27.2 | 28 | |
| FSV | 0.53 | 11.1 | 10.9 | 10.8 | 11.3 | |
| DHR | 0.43 | 5 | 13.4 | 10.4 | 26.5 | 10.8 |
My investment strategy involves finding stocks combining increasing dividends and consistently outperforming the market. I use the Schwab U.S. Dividend Equity ETF (SCHD) as my dividend growth benchmark. This ETF has a remarkable track record of exceptional performance, a higher yield than the S&P 500, and a proven record of growing dividends. I prefer to invest in the ETF if a stock cannot beat the benchmark. I've added companies to my personal investment portfolio based on this analysis. I also routinely use this analysis to choose timely additional purchases.
I'm comparing SCHD to the top-10 companies with the highest 10-year dividend growth rate. That's one of the factors used in the methodology behind SCHD. This is a proxy for success, although it's not a perfect predictor. Share prices tend to follow strong dividend growth over long periods of time. Below are the results.
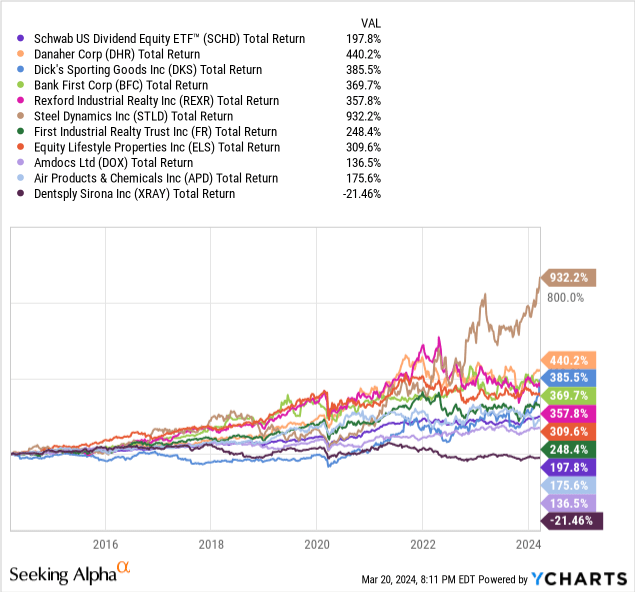
To start the analysis, SCHD had a total return of 198%. XRAY has been a bit of a shocker with a negative 21% total return over the past decade.
On the flip side, Steel Dynamics has knocked the cover off the ball with a 932% total return, though arguably much of it has come in the past two years. It's intriguing, and I want to look at it closer.
Another segment has incredibly strong performance. DHR, DKS, BFC, REXR, and ELS all had a tremendous performance, ranging from 440% for DHR to 310% for ELS, with the rest in between.
FR also bested SCHD by a few points per year. Finally, APD and DOX, which performed well but lagged behind SCHD, rounded out the discussion.
Please do your due diligence before making any investment decision.