
Kesu01/iStock via Getty Images
Kesu01/iStock via Getty Images
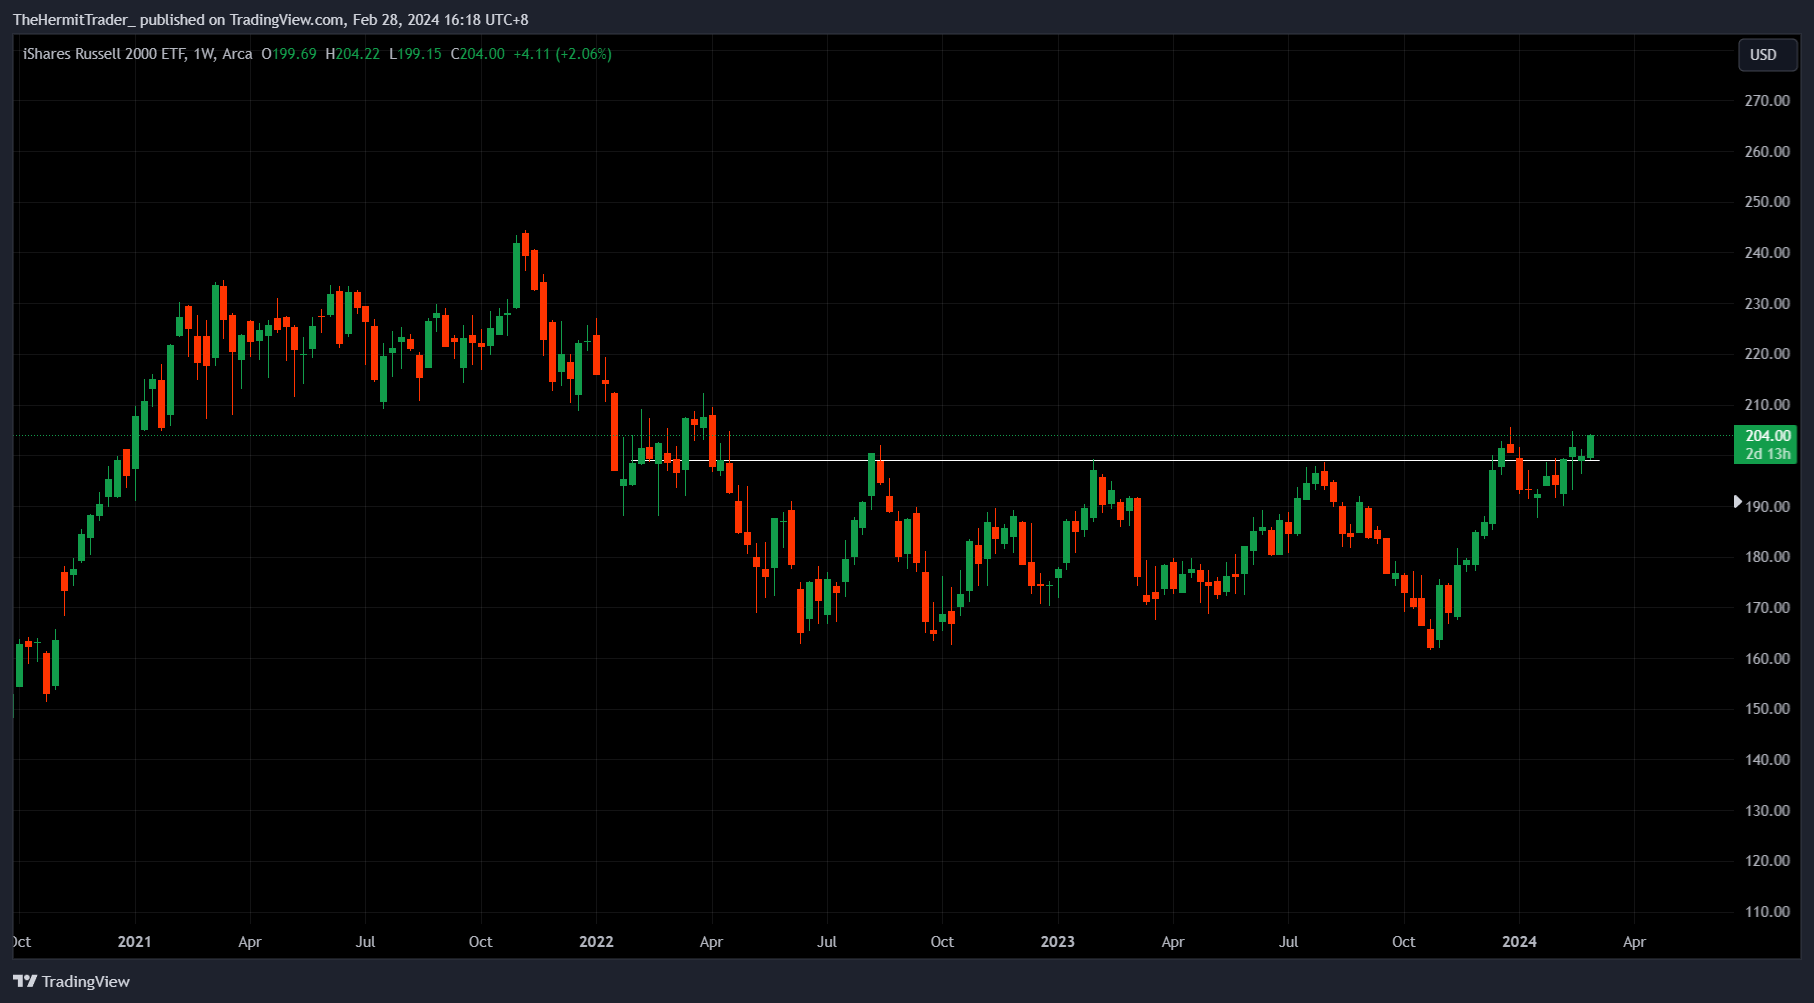
With the Russell 2000 (IWM) breaking out from its 2 year base, it means that there is likely going to be increased participation from sectors away from technology and software.
One sector that has been under the radar and stealthily consolidating for almost 2 years is the oil & gas space. From the technical charts, it looks like crude oil prices as well as oil & gas stocks are setting up to breakout higher.
If so, this could lead to a healthy rotation into the oil & gas sector, away from the more overcrowded sectors. As the saying goes, "rotation is the lifeblood of a bull market".
Below, I will cover the technical charts and the opportunities therein.
First off, a quick look at where we stand on the Russell 2000. The IWM ETF has broken out from a 2 year base. As this ETF is not dominated by mega cap technology stocks, it presents an opportunity for other sectors to take the baton and lead.
Weekly Chart: IWM
TradingView
Next up, let us look at the technical charts of WTI crude, in varying time frames.
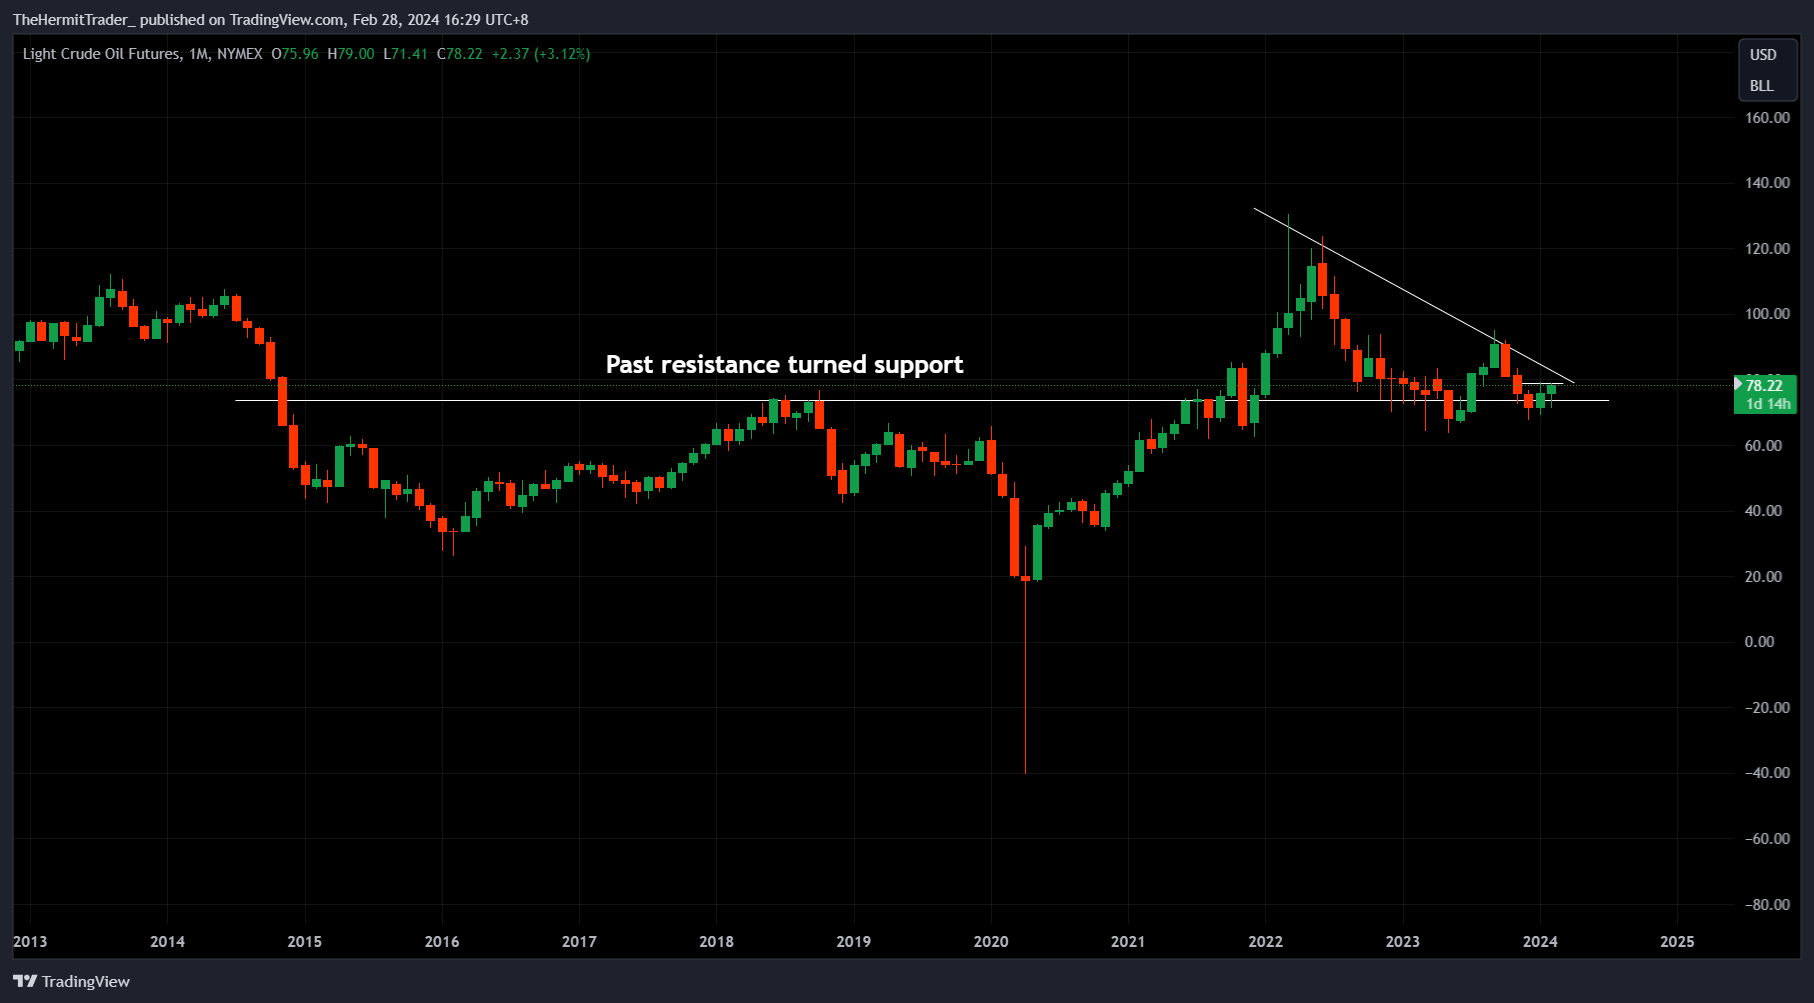
On the longer term monthly chart, WTI crude has been finding support at the 70-75 level. This area previously acted as resistance, but after the breakout above it in December 2021, has now turned to support.
Monthly Chart: WTI Crude
TradingView
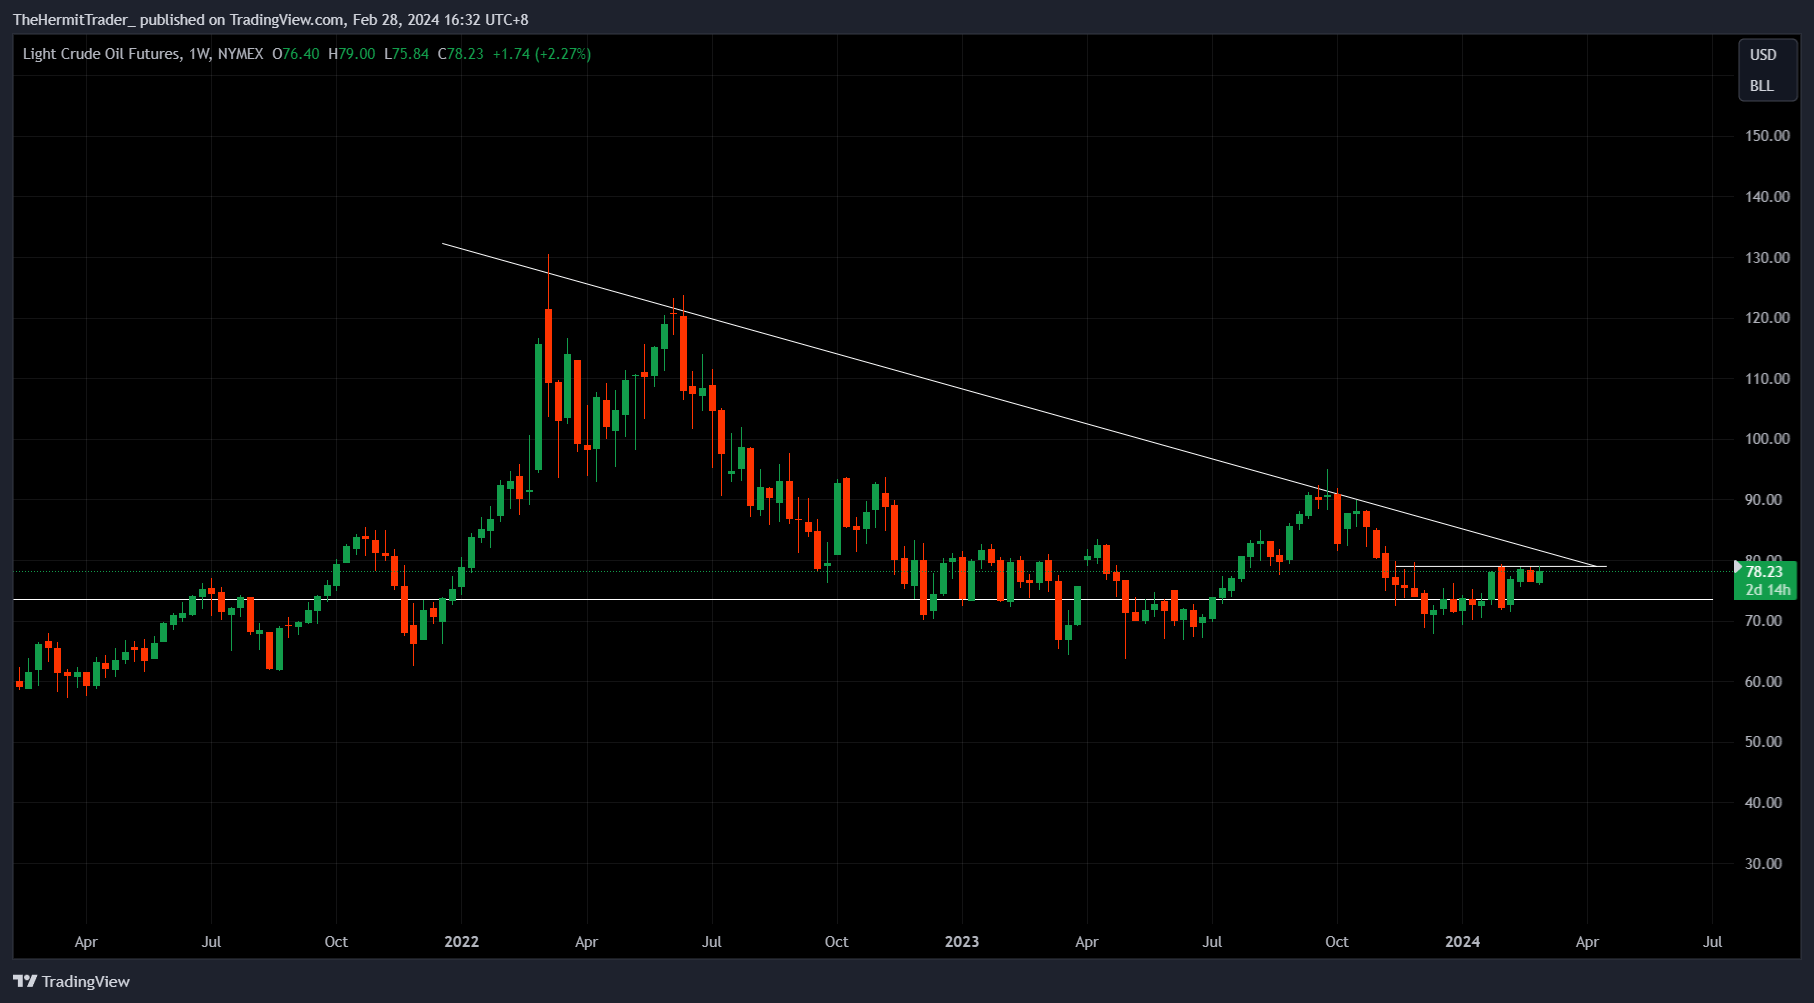
When we zoom into the weekly chart, we may see that WTI crude is nearing an area where there is a confluence of resistance, somewhere around the 80-82 level. This confluence area is made up of both horizontal structural resistance as well as downtrend resistance dating back to March 2022.
Weekly Chart: WTI Crude
TradingView
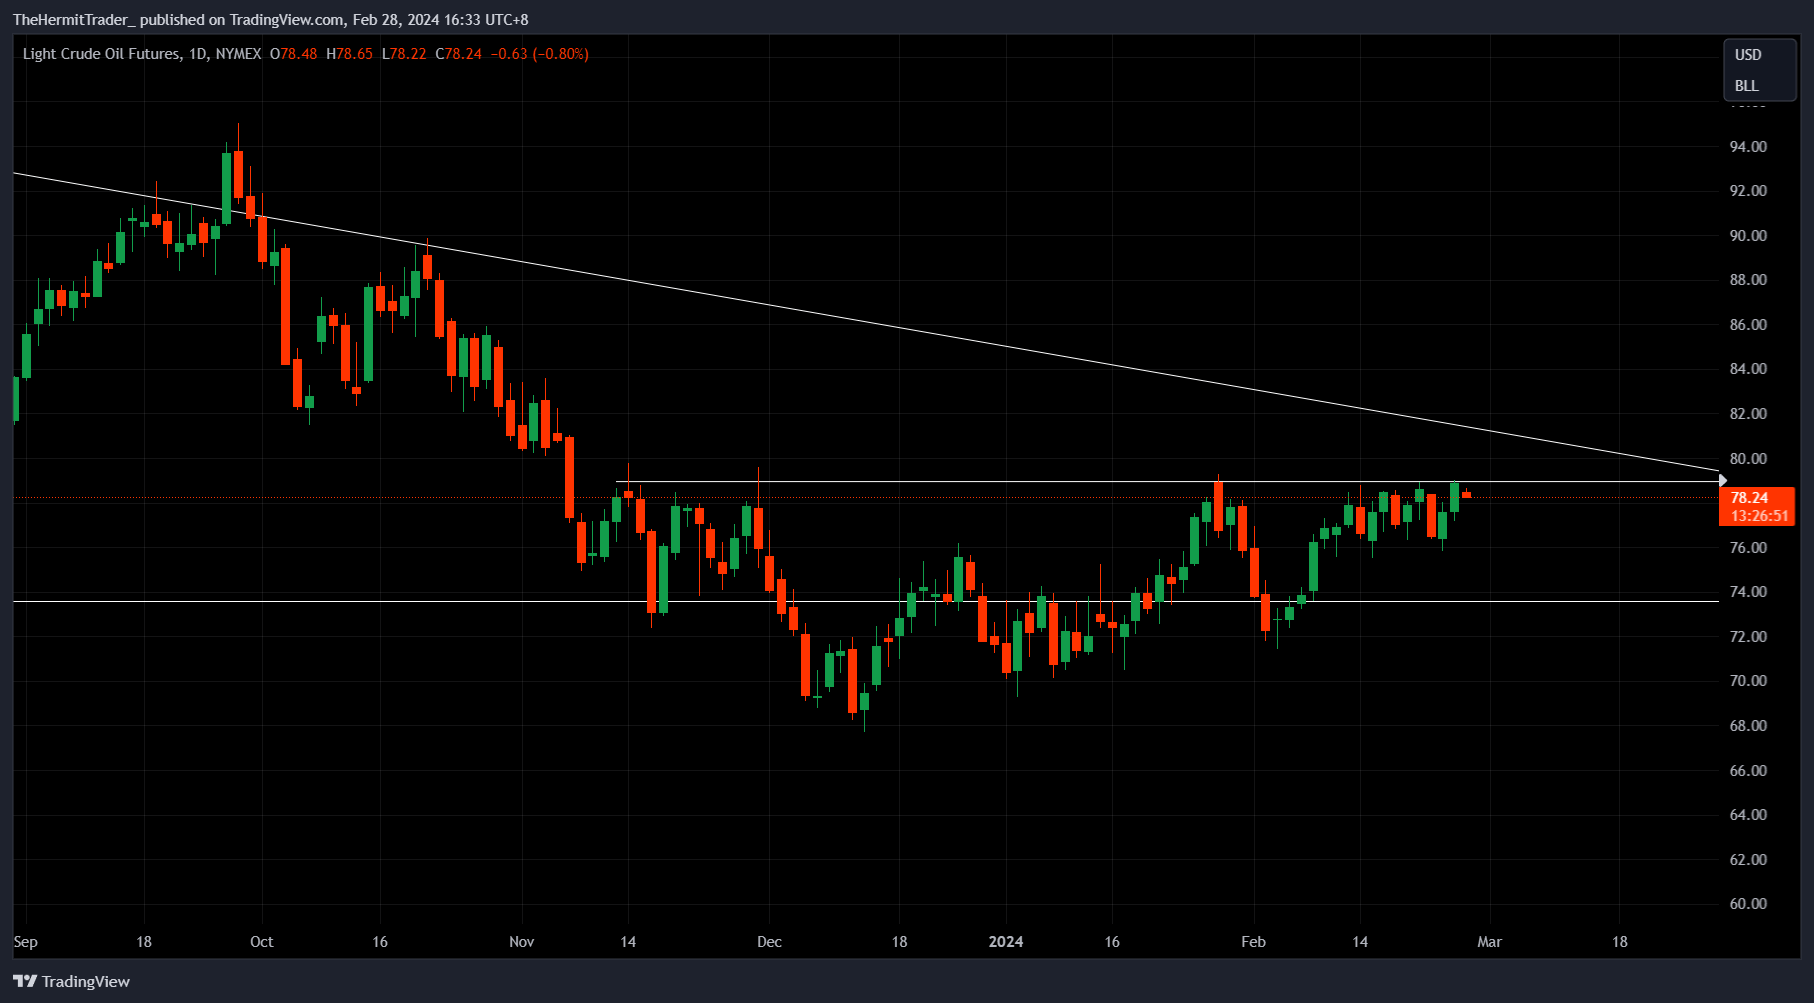
On the shorter term daily chart of WTI crude, we may see in closer view the base that has been forming since November. WTI crude has been tightening up considerably just below the breakout pivot for the past 2 weeks, and we could see an expansion in volatility soon. My bias is for prices to breakout higher.
Daily Chart: WTI Crude
TradingView
Now, we might think - if the Russia-Ukraine war last year did not lift prices higher, what could possibly be a strong enough catalyst?
The markets are a discounting mechanism, and when the Russia-Ukraine war made the news, it was "too obvious" a catalyst to really lead to an explosive breakout in oil prices in my opinion.
Now that there are no clear fundamental factors in play, it makes the bullish development on the technical charts of WTI crude more compelling. The market is pricing in some catalyst that is probably not clear yet. That is why I label this development as "under the radar" in my title, and the potential for an explosive move is there.
When we look at the charts of oil & gas stocks, the same technical picture is there.
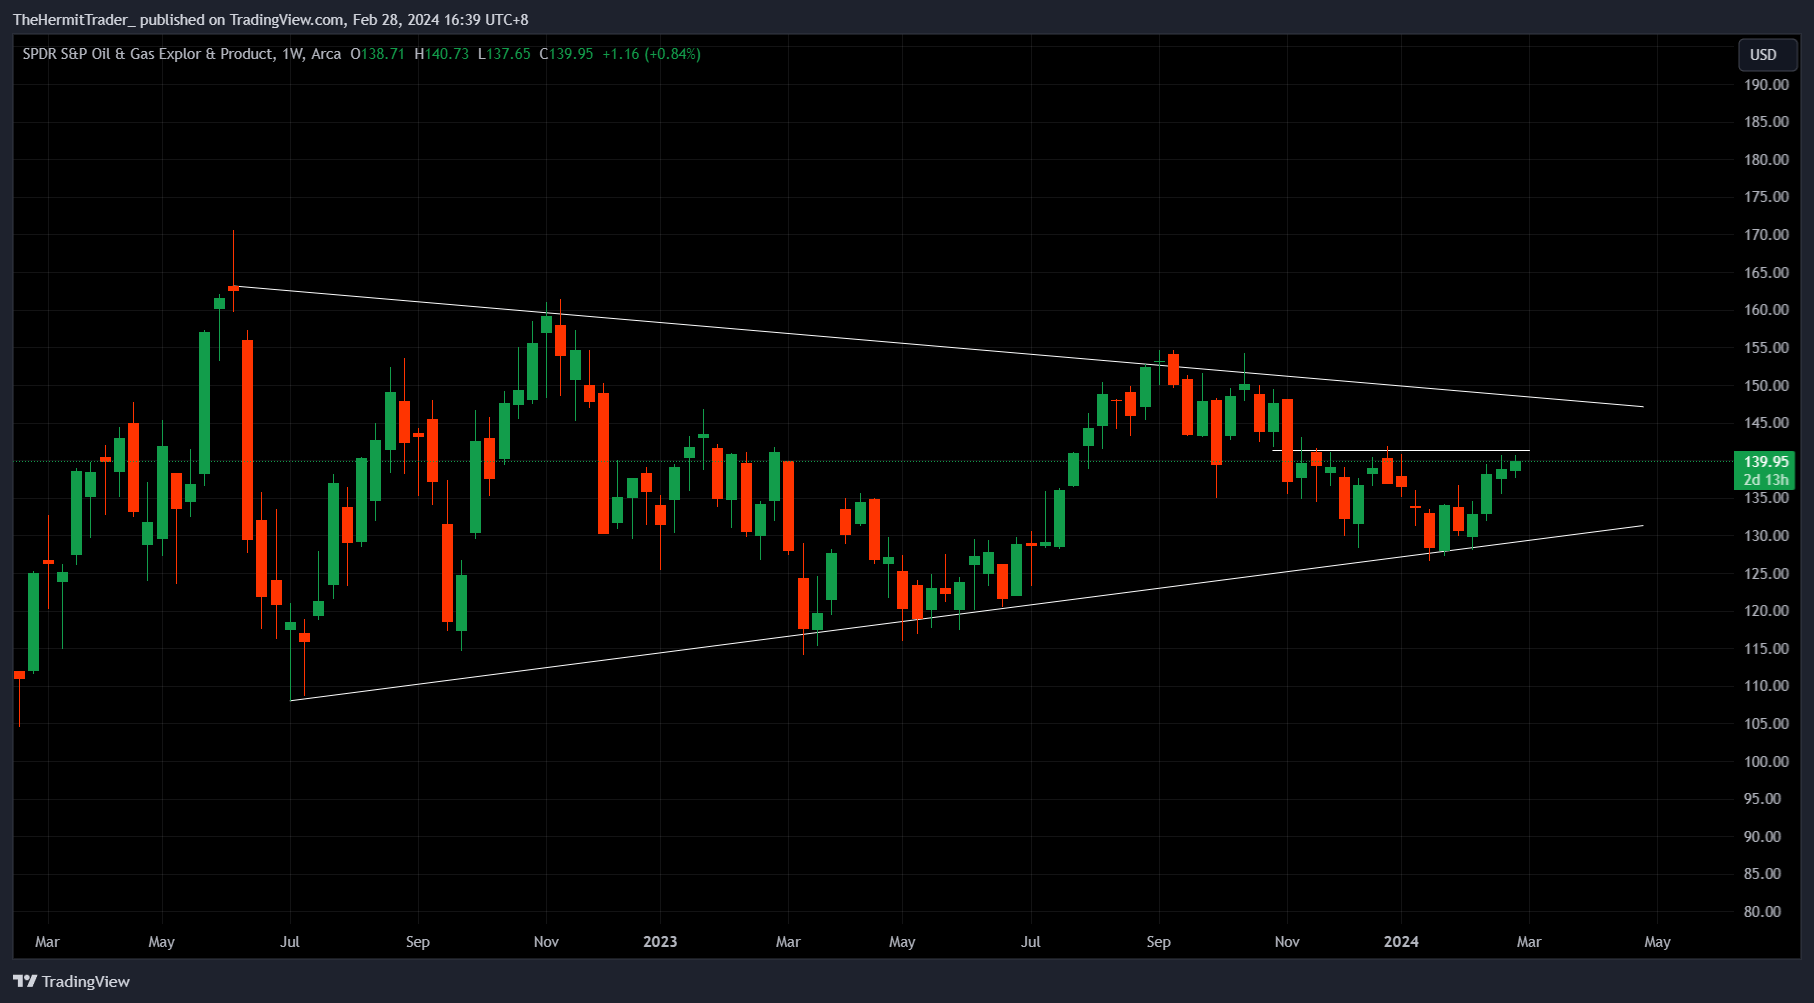
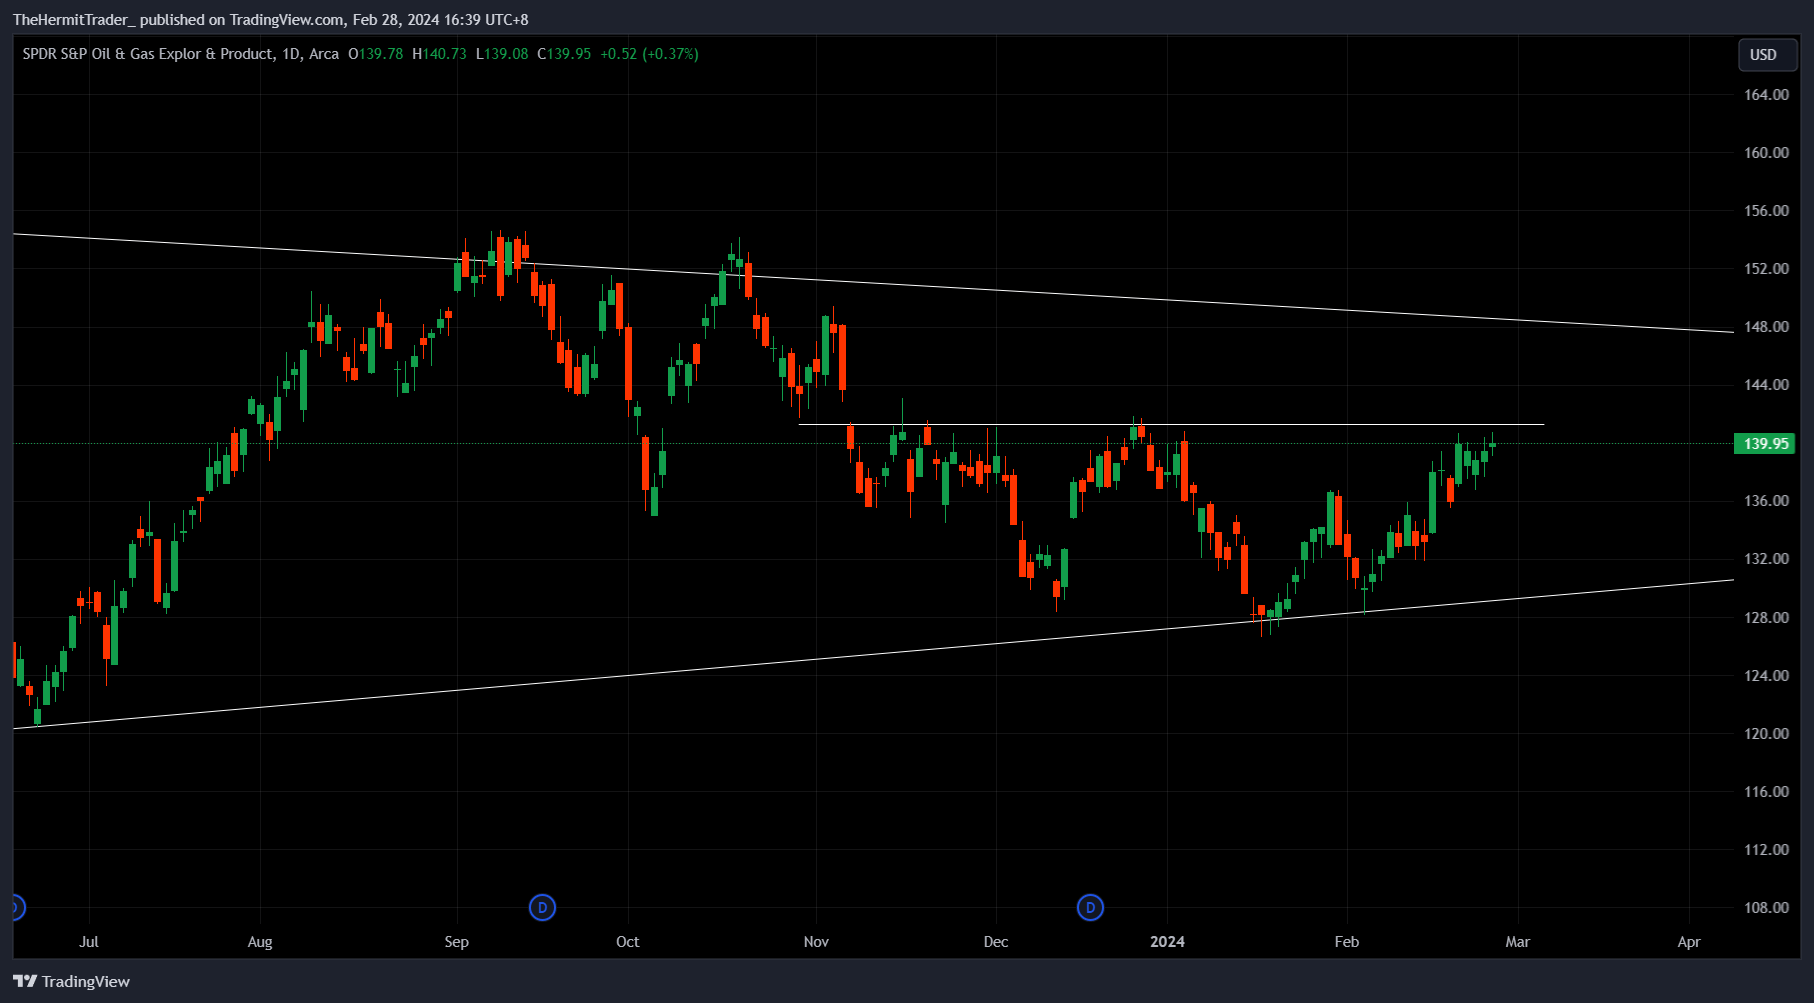
Oil & gas explorers (XOP) have been tightening up and consolidating in an increasingly narrow range for the past 2 years, as seen from the weekly chart. On the daily chart, it is close to the breakout pivot of a base it has been building since November, similar to WTI crude prices.
Weekly Chart: XOP
TradingView
Daily Chart: XOP
TradingView
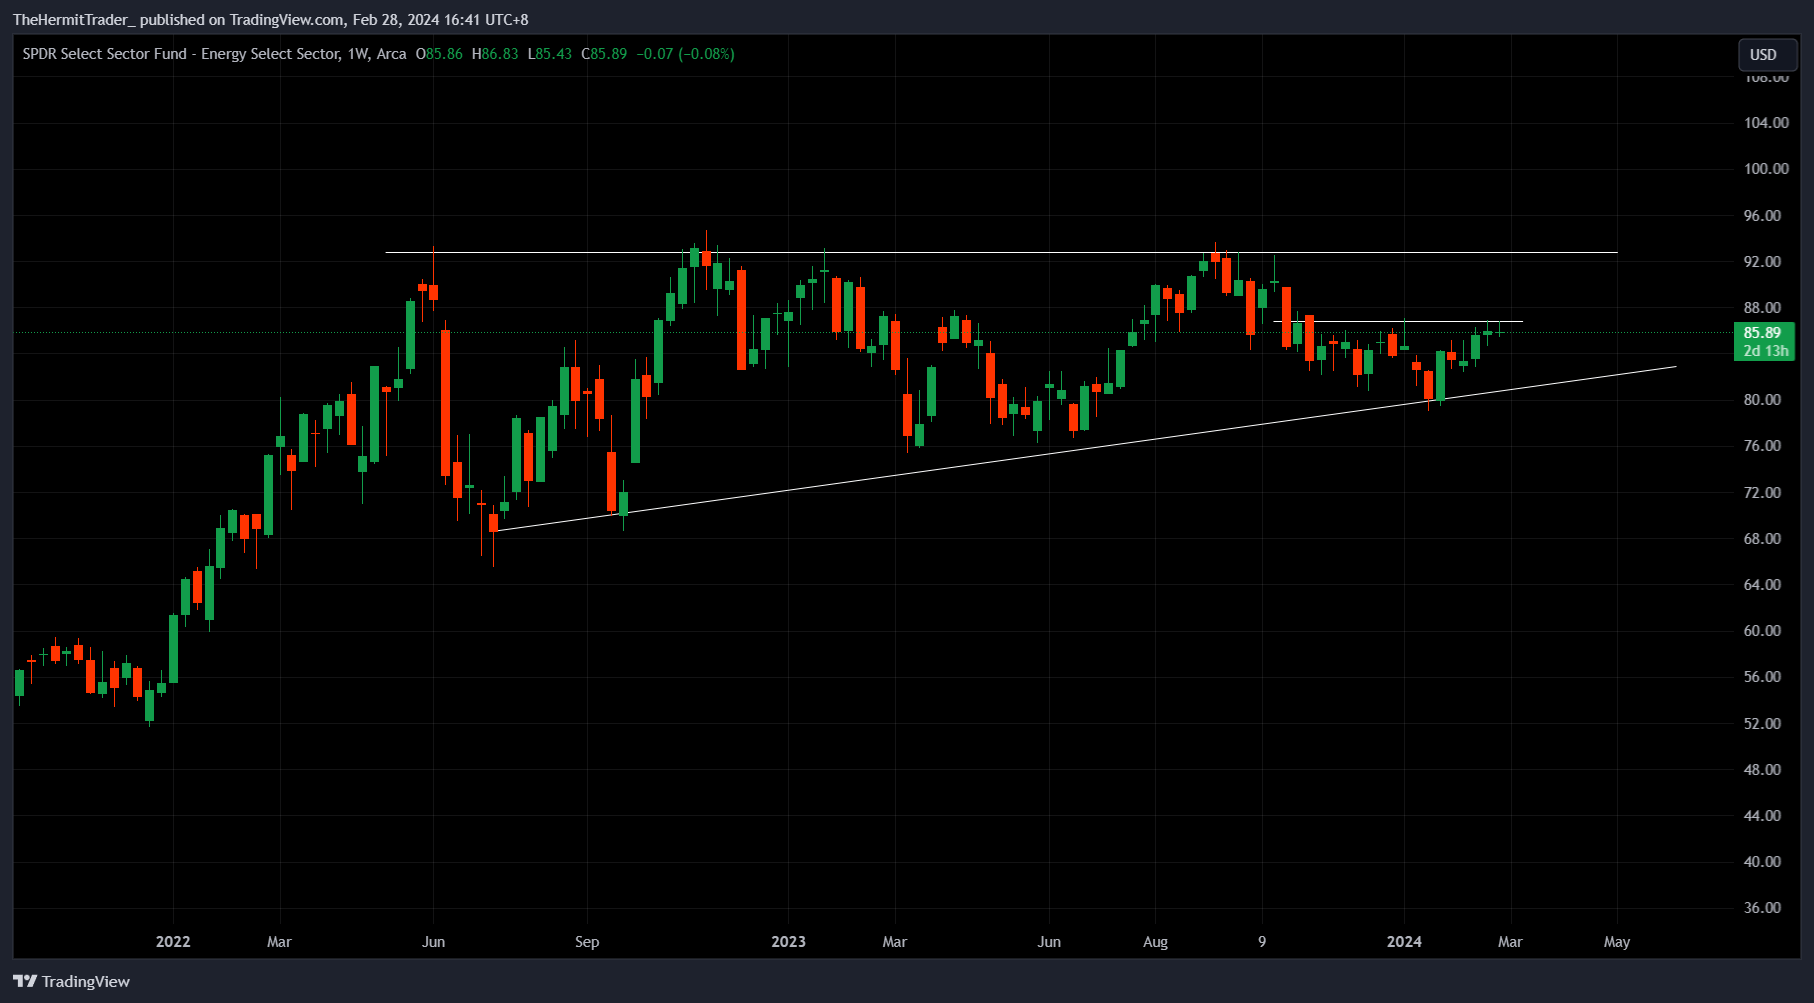
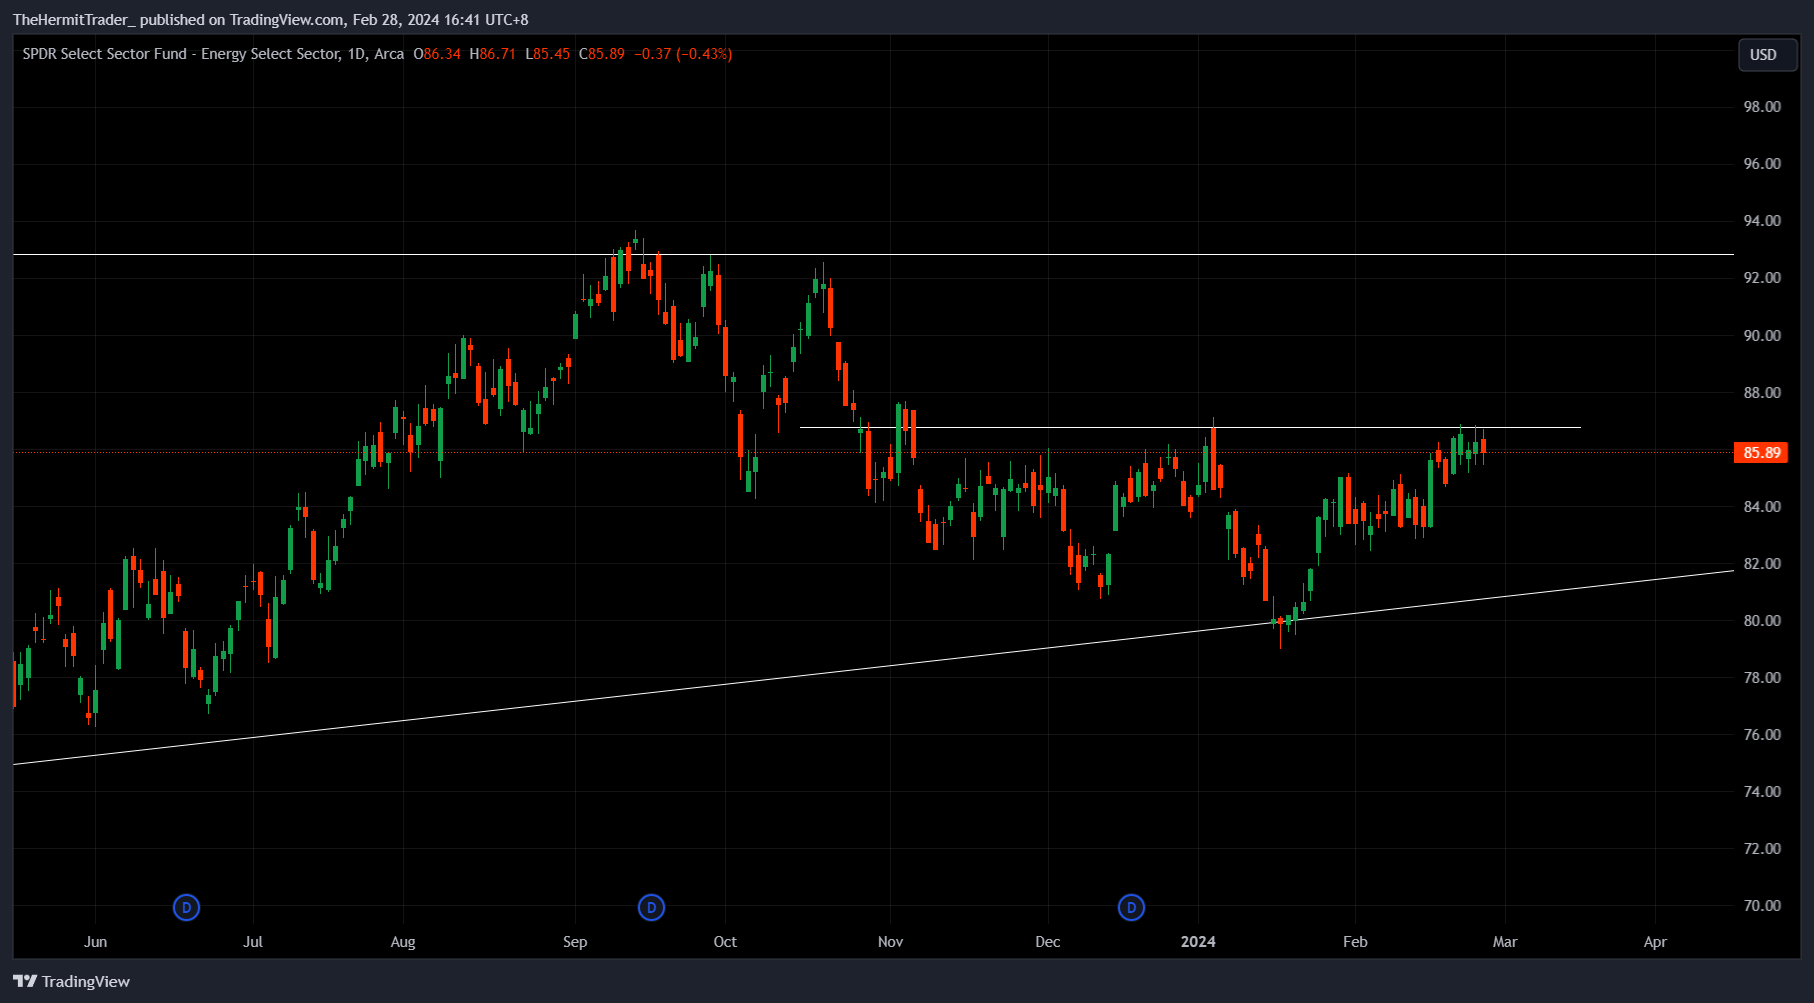
We have a similar look for the Energy Select ETF (XLE). On the weekly chart, we can observe an increasingly narrow range as XLE consolidates for the past 2 years. On the daily chart, XLE is also close to its breakout pivot after basing since November.
Weekly Chart: XLE
TradingView
Daily Chart: XLE
TradingView
What would constitute a powerful breakout would be if crude oil prices, XLE and XOP all take out their breakout pivots at the same time.
An ideal situation would be if capital can rotate out of overcrowded sectors into less popular ones like oil & gas. From the recent BofA Global Fund Manager Survey, fund managers are currently the most allocated to technology since August 2020.
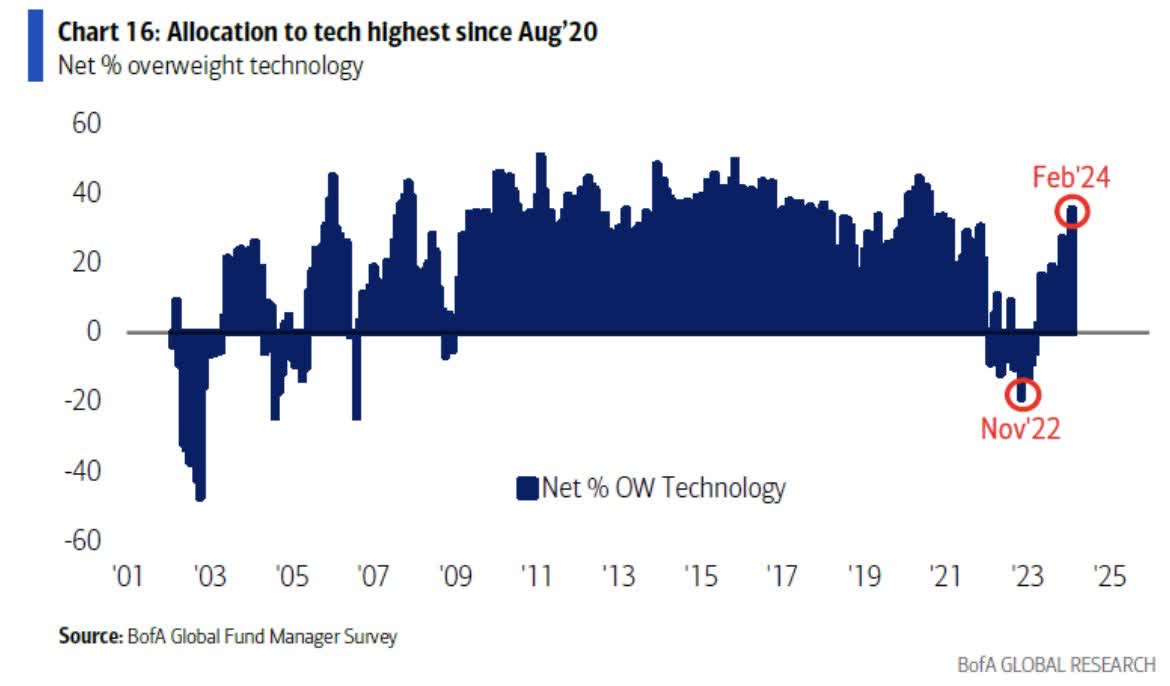
BofA
As such, the more attractive play here is to be long the broad market (Russell 2000) over the S&P 500 (SPY) or Nasdaq 100 (QQQ), which are heavily weighted to mega cap technology stocks.
Within "the broad market", oil & gas is an attractive long opportunity. My trigger to go long would be if WTI crude, XOP and XLE breakout in tandem on above average volume. If they do not breakout above their pivots, I will abstain from being long. If the breakouts occur but sharply reverse course back below the breakout pivots, then my thesis is likely wrong.