
William_Potter
William_Potter
Vanguard Mega Cap ETF (NYSEARCA:MGC) warrants a buy rating due to its low-cost ability to capture strong returns of mega-cap, big tech holdings including the “Magnificent Seven.” Additionally, MGC can achieve this quality while offering the greatest diversification of compared, peer mega-cap funds while also seeing the lowest relatively volatility and greatest dividend yield. While mega-cap, information technology holdings have seen high returns recently, some are in danger of being overvalued. Therefore, MGC is a mega-cap ETF that also includes some diversification with large-cap holdings in the event of a “Magnificent Seven” pullback.
MGC is a passively managed ETF that seeks to track the CRSP U.S. Mega Cap Index. With its inception in 2007, the fund has 213 holdings and $5.42B in AUM. MGC is heaviest in the information technology sector (39.00%), followed by consumer discretionary (14.50%) and health care (12.40%) sectors. By most definitions, mega-cap stocks have valuations over $200B. While mega caps are found in non-U.S. markets as well, MGC and compared ETFs specifically capture U.S. domestic holdings. Using the $200B definition for mega cap, MGC includes a high number of large cap holdings as well and is therefore not exclusively “mega cap”.
For comparison purposes, other funds examined are the iShares S&P 100 ETF (OEF), Invesco S&P 500 Top 50 ETF (XLG), and Vanguard Mega Cap Growth ETF (MGK). OEF tracks the S&P 100 Index and therefore seeks to provide investors with 100 mega-cap domestic stocks. XLG is composed of the largest 50 companies in the S&P 500 Index. It is therefore less diversified than both MGC and OEF. MGK passively tracks the CRSP U.S. Mega Cap Growth Index. It is less diversified than MGC and has a heavier weight on mega cap growth holdings along with a 58.70% weight in the information technology sector.
MGC has a 10-year average annual return of 13.16%. By comparison, OEF has a 10-year average return of 12.48%, XLG has a 10-year average annual return of 14.29%, and MGK has a 10-year average annual return of 15.61%. For reference, the S&P 500 Index has a 10-year average return of roughly 12.7%.
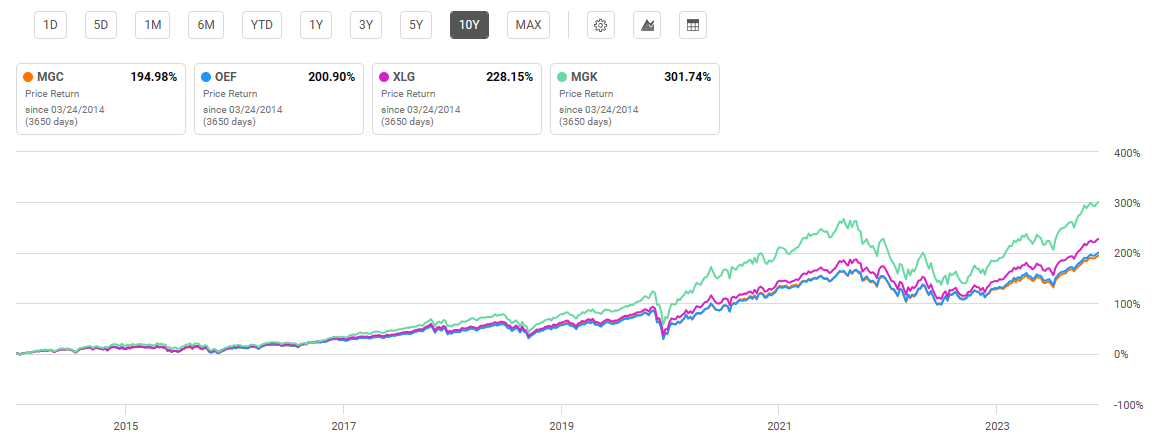
10-Year Total Price Return: MGC and Compared Mega-Cap Exchange Traded Funds (Seeking Alpha)
Vanguard is well known for offering low-cost funds. MGC is no exception and boasts the lowest expense ratio of peer funds at 0.07%. This expense ratio is tied with MGC’s sister growth fund, MGK. MGC also has the greatest dividend yield at 1.22% along with a noteworthy dividend growth rate with a 5-year CAGR of 4.14%.
Expense Ratio, AUM, and Dividend Yield Comparison
MGC | OEF | XLG | MGK | |
Expense Ratio | 0.07% | 0.20% | 0.20% | 0.07% |
AUM | $5.42B | $11.75B | $4.04B | $18.66B |
Dividend Yield TTM | 1.22% | 1.07% | 0.85% | 0.45% |
Dividend Growth 5 YR CAGR | 4.14% | 2.65% | -1.08% | 5.11% |
Source: Seeking Alpha, 21 Mar 24
MGC is the most diversified mega cap fund compared with 213 holdings. It also has the lowest combined weight in its top 10 holdings at 37.88%. As discussed previously, MGC includes a significant number of holdings that do not meet the generally accepted $200B “mega cap” threshold and are therefore considered large cap holdings.
Top 10 Holdings for MGC and Compared Mega Cap ETFs
MGC – 213 holdings | OEF – 101 holdings | XLG – 55 holdings | MGK – 82 holdings |
MSFT – 8.47% | MSFT – 10.48% | MSFT – 12.48% | MSFT – 14.60% |
AAPL – 7.36% | AAPL – 8.52% | AAPL – 10.15% | AAPL – 12.69% |
NVDA – 5.11% | NVDA – 7.39% | NVDA – 8.79% | AMZN – 7.63% |
AMZN – 4.53% | AMZN – 5.39% | AMZN – 6.42% | NVDA – 7.30% |
META – 3.00% | META – 3.70% | META – 4.40% | META – 5.32% |
GOOGL – 2.24% | GOOGL – 2.94% | GOOGL – 3.50% | GOOGL – 3.81% |
BRK.B – 1.92% | BRK.B – 2.51% | BRK.B – 2.99% | GOOG – 3.16% |
GOOG – 1.89% | GOOG – 2.48% | GOOG – 2.95% | LLY – 3.16% |
LLY – 1.77% | LLY – 2.06% | LLY – 2.45% | TSLA – 2.67% |
AVGO – 1.59% | JPM – 1.88% | JPM – 2.24% | V – 2.20% |
Source: Multiple, compiled by author on 21 Mar 24
MGC represents several key advantages over peer mega-cap funds. While mega-cap has historically outperformed the S&P 500 Index and the “Magnificent Seven” have seen strong returns, several have high valuations. Because MGC offers the greatest diversification of compared funds and includes a high number of large cap holdings, the fund may serve investors well in the event of a mega-cap, big tech pullback.
To answer whether MGC deserves a buy rating, one should first answer whether big-tech mega caps are currently overpriced. Upon close examination, an argument can be made that several mega-cap, big tech holdings are valued fairly while others are overvalued. For example, looking at Apple Inc. (AAPL), we see a price to earnings ratio that is 5.7% below its sector median. Additionally, AAPL has a P/E ratio on par with its own 5-year average. Microsoft Corporation (MSFT) also has a reasonable P/E ratio at 38.45, or slightly higher than its sector.
MSFT | AAPL | NVDA | AMZN | META | GOOGL | TSLA | |
P/E GAAP TTM | 38.45 | 27.83 | 75.75 | 61.43 | 34.00 | 25.64 | 40.85 |
% Difference to Sector | +30.17% | -5.75% | +156.49% | +244.68% | +76.04% | +32.78% | +129.21% |
Source: Data Compiled by Author from Seeking Alpha, 21 Mar 24
However, there are also “Magnificent Seven” stocks that have high valuations. Amazon.com, Inc. (AMZN) has a 61.43 P/E ratio, 244% higher than its sector median. NVIDIA Corporation (NVDA) stands at a 75.75 P/E ratio, 156% higher than its sector median. While NVDA has seen a 255% price return over the past year and the mega cap is seeing a P/E ratio much higher than its sector, it is still lower than its own 5-year average. Finally, Tesla, Inc. (TSLA) has a forward P/E ratio of 76.04, 356% higher than its sector median. While the artificial intelligence boom is resulting in strong earnings, one must question whether we are getting close to a bubble with such high price increases over the past year.
Another factor to consider for MGC is how mega-caps compare with the market overall and even mid or small cap funds. Over the past 10 years, MGC has outperformed Vanguard peer funds including Vanguard S&P 500 ETF (VOO), Vanguard Total Stock Market ETF (VTI), Vanguard Mid-Cap ETF (VO), and Vanguard Small-Cap ETF (VB). While previous performance is never a guarantee of future performance, mega-cap funds have generally outperformed over the past decade.
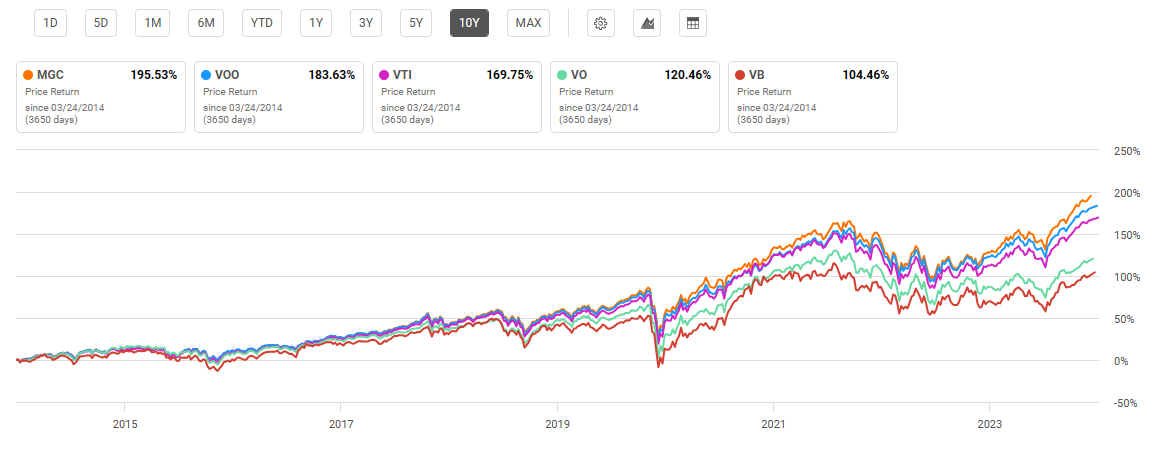
Long-Term Performance Comparison: Vanguard Mega-Cap, S&P 500, Total Market, Mid-Cap, and Small-Cap Funds (Seeking Alpha)
The third consideration is that MGC gives investors strong exposure to the “Magnificent Seven” while also offering the greatest diversification in the event of a big tech pullback. If a big tech correction occurred, MGK, XLG, and even OEF would see a steeper decline based on their holding weights. We have seen examples of popular stock declines in history. For example, the “Nifty Fifty” was popular in the 1960s and 1970s including solid buy-and-hold “blue chip” stocks. However, the group of companies saw a value decline of 60% between 1973 and 1975. Another example, of course, was the popular dot-com bubble, when the NASDAQ saw a decline of 76.8% from 2000 to 2002.
Utilizing beta value as an implied metric for volatility, we can measure potential volatility for each examined mega cap fund. MGC has a beta of 0.98 compared to the Dow Jones U.S. Total Stock Market Index. By comparison, OEF has a 3-year beta value of 1.01 and MGK has a beta value of 1.19. Therefore, while the “Magnificent Seven” may still see strong, consistent returns, MGC presents a slightly lower risk option compared to the other funds examined while still capturing the bulk of mega cap gains.
MGC has a current price of $186.83 at the time of writing this article. This price is near the top of its 52-week range of $136.64 to $187.68. MGC and all compared mega-cap funds have outperformed the S&P 500 Index over the past year. As discussed, this is predominantly due to the performance of the “Magnificent Seven” which has now put their share of the S&P 500 market cap at roughly 30%. This concentration with such a small number of stocks has not been seen since at least 1980.
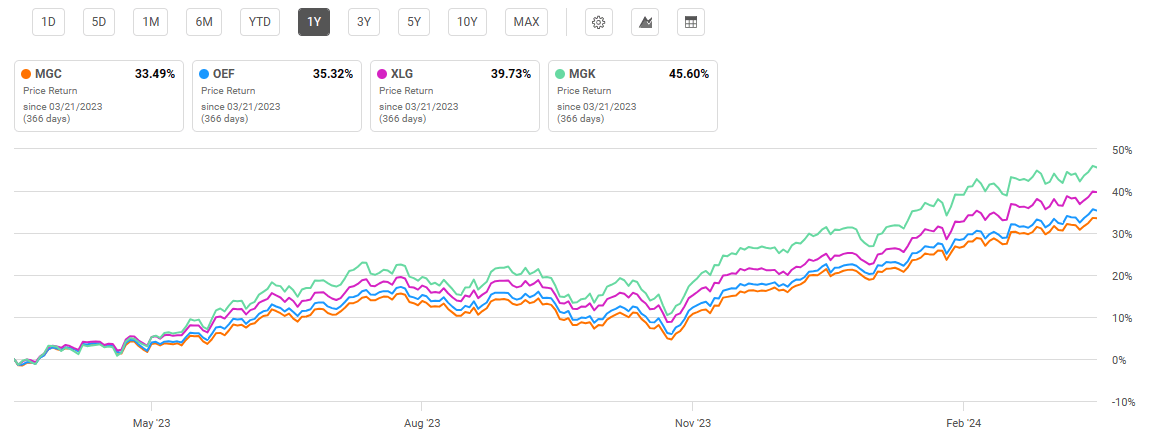
One-Year Performance: MGC and Compared Mega-Cap ETFs (Seeking Alpha)
As a result of these big tech returns and each fund’s holdings mix, MGC has the most attractive valuation metrics of peer funds examined. For example, MGC’s P/E ratio is the lowest at 27.89. Additionally, using P/B ratio as another metric for valuation, MGC is also the most attractive with a value of 5.00, the lowest of peers.
Valuation Metrics for MGC and Peer Mega-Cap Funds
MGC | OEF | XLG | MGK | |
P/E ratio | 27.89 | 26.97 | 29.70 | 38.30 |
P/B ratio | 5.00 | 5.25 | 5.93 | 10.80 |
Source: Compiled by Author from Multiple Sources, 21 Mar 24
MGC presents an attractive blend between mega-cap concentration and large cap diversification. History has shown sharp declines including the “Nifty Fifty” and dot-com bubble. While the AI boom is driving strong returns, a correction in the “Magnificent Seven” will hit OEF, XLG, MGK particularly hard. MGC historically has seen lower volatility as implied by its beta value and currently has a more attractive P/E and P/B ratio than compared funds. Finally, MGC has a low expense ratio and the highest dividend yield of peer mega-cap ETFs.