
Lemon_tm
Lemon_tm
The price of an ounce of gold soared to a high of $2222 following Wednesday’s dovish FOMC decision and Fed Chair Jerome Powell's press conference. The Fed raised its outlook for both GDP growth and inflation while leaving its policy rate forecast unchanged, effectively an accommodative set of actions. Not surprisingly, risk assets jumped following the news release and media Q&A. Amid the drop in interest rates and give-back in the greenback, precious metals caught a bid.
Let’s dig into one major gold miner, Barrick Gold Corporation (NYSE:GOLD). I have a buy rating on the $28 billion market cap Materials-sector stock given its reasonable valuation, though I will note some concerns on the technical chart.
Seeking Alpha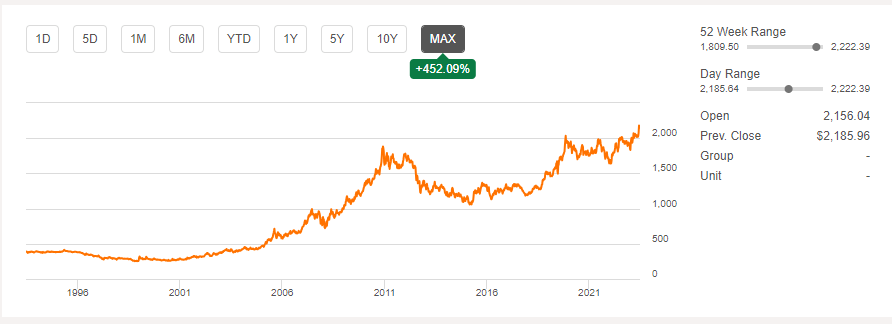
According to Bank of America Global Research, Barrick Gold strives to become the world's most valued mining company. Barrick operates mines in the USA, South America, PNG, Africa, and Saudi Arabia. It engages in the exploration, mine development, production, and sale of gold and copper properties in Canada and internationally. The company also explores and sells silver and energy materials.
Back in February, Barrick reported a mixed set of Q4 results. Non-GAAP EPS verified at $0.27, a $0.06 beat, but revenue fell shy of Wall Street estimates. Net sales of $3.06 billion were up 10.5% from year-ago levels and a strong finish to the previous fiscal year resulted in solid gold production of 4.05 million ounces and copper output of 420 million pounds. Free cash flow was up an impressive 50% to $646 million.
The management team also declared a $0.10 dividend and authorized a new $1 billion share repurchase program. Senior executive vice-president and chief financial officer Graham Shuttleworth noted:
“The performance of our business and the continued strength of our balance sheet allowed us to maintain the distribution of a robust dividend to our shareholders in 2023, while still ensuring Barrick has adequate liquidity to invest in our significant growth projects.”
Still, 2024 gold production guidance was to the light side, leading to a modest drop in shares the day after the report. Unit cost guidance was also higher than expected. But with high-quality assets, improving free cash flow, global exploration prospects, and long-term growth trends, shares appear as a decent value today. Key risks include gold price weakness, struggles to secure favorable financing terms, political or regulatory changes across its regional exposures, and rising operating costs.
On valuation, analysts at BofA see earnings rising substantially this year with continued strong EPS growth in the out year. The current consensus estimate, per Seeking Alpha, shows $0.94 of non-GAAP per-share profits in 2024 with $1.11 of operating EPS in 2025. The bottom line may hold there in 2026, though. Revenue is seen jumping 8% annually over the next handful of quarters, too. With a dividend yield of 2.55% as of March 20, 2024, the yield may hold here for the foreseeable future, per BofA. Free cash flow is admittedly low, but that could grow in 2025.
BofA Global Research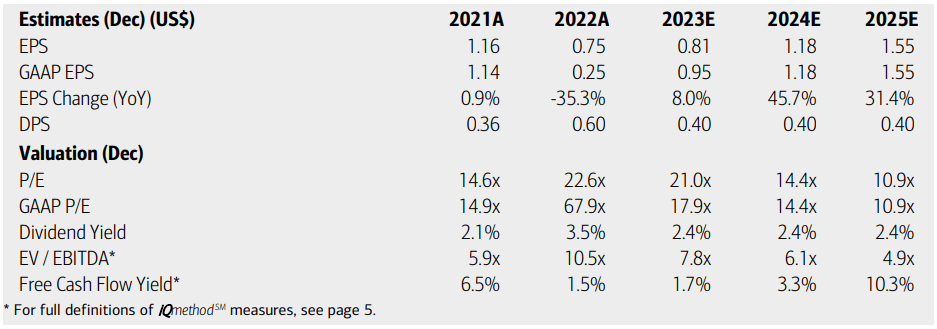
If we assume normalized EPS of $1.11 and apply an earnings multiple between the sector median and Barrick’s 5-year historical P/E, call it 19x, then shares should trade near $21, making the stock significantly undervalued today. What’s more, the current PEG ratio, according to Seeking Alpha, is quite depressed.
Seeking Alpha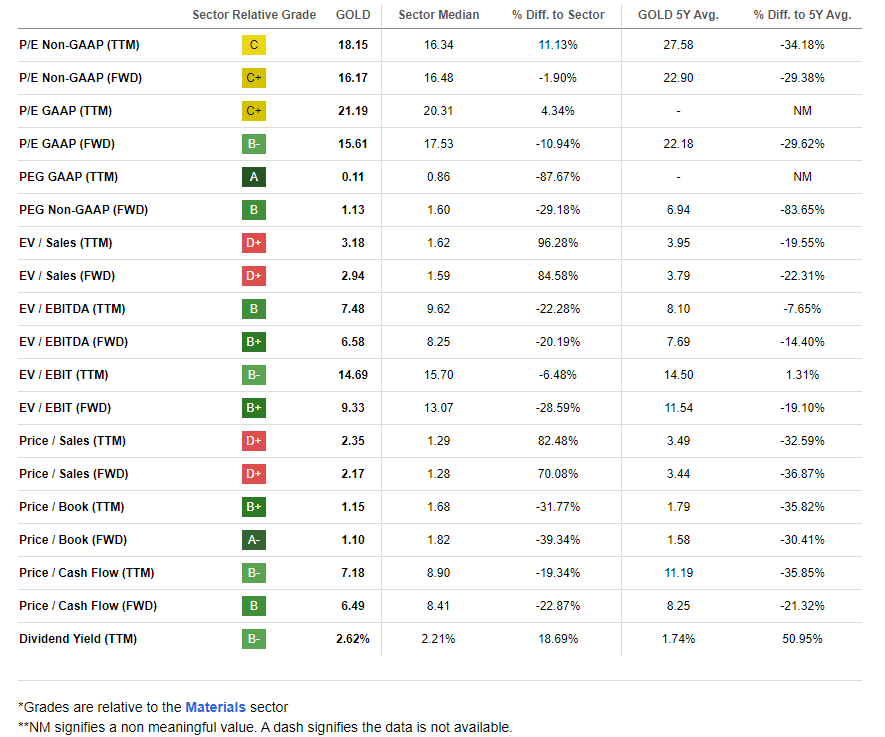
Compared to its peers, Barrick features a lukewarm valuation grade, but I assert that a solid EPS bounce back this year and next makes the shares’ pricing compelling. Moreover, the profitability trajectory is strong despite a slew of EPS downgrades in the last three months. Share-price momentum is about in line with its Materials-sector competitors, and I will highlight key price levels on the chart to monitor later in the article.
Seeking Alpha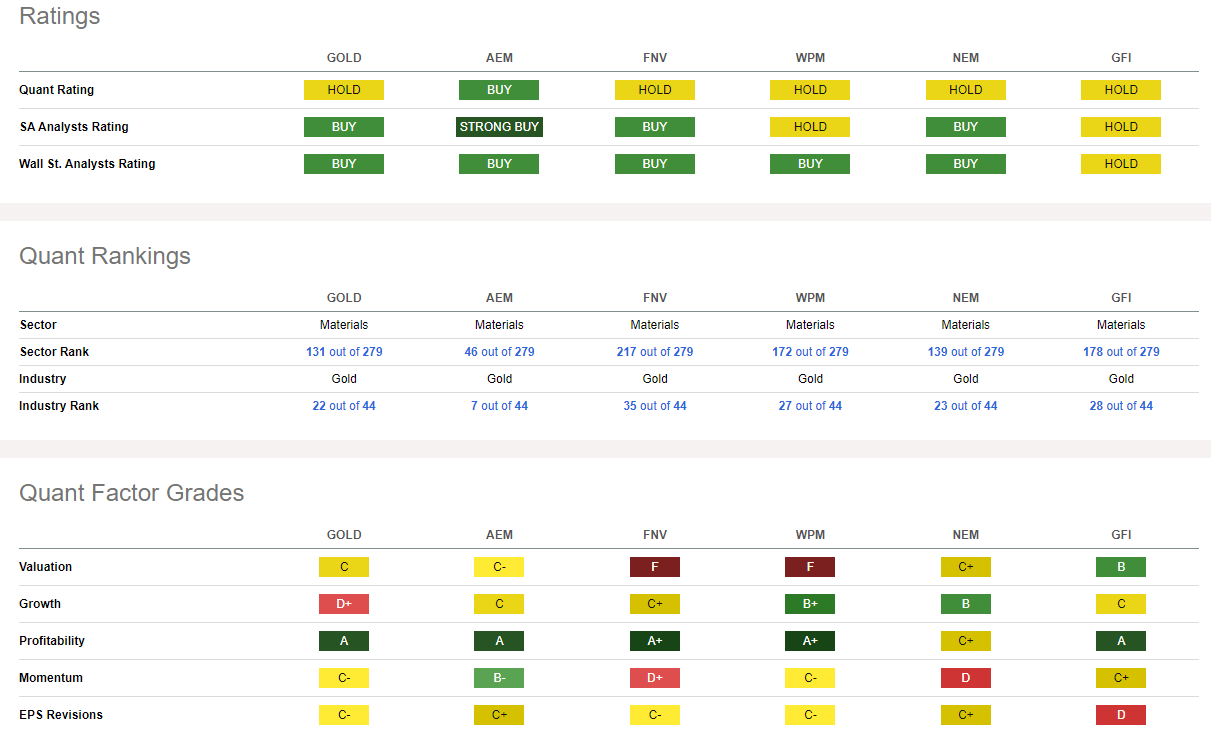
Looking ahead, corporate event data provided by Wall Street Horizon shows an unconfirmed Q1 2024 production update before its full Q1 2024 earnings release is unconfirmed to take place on Wednesday, May 1 BMO. Between those two operational updates, the firm holds its annual shareholders’ meeting on Tuesday, April 30.
Wall Street Horizon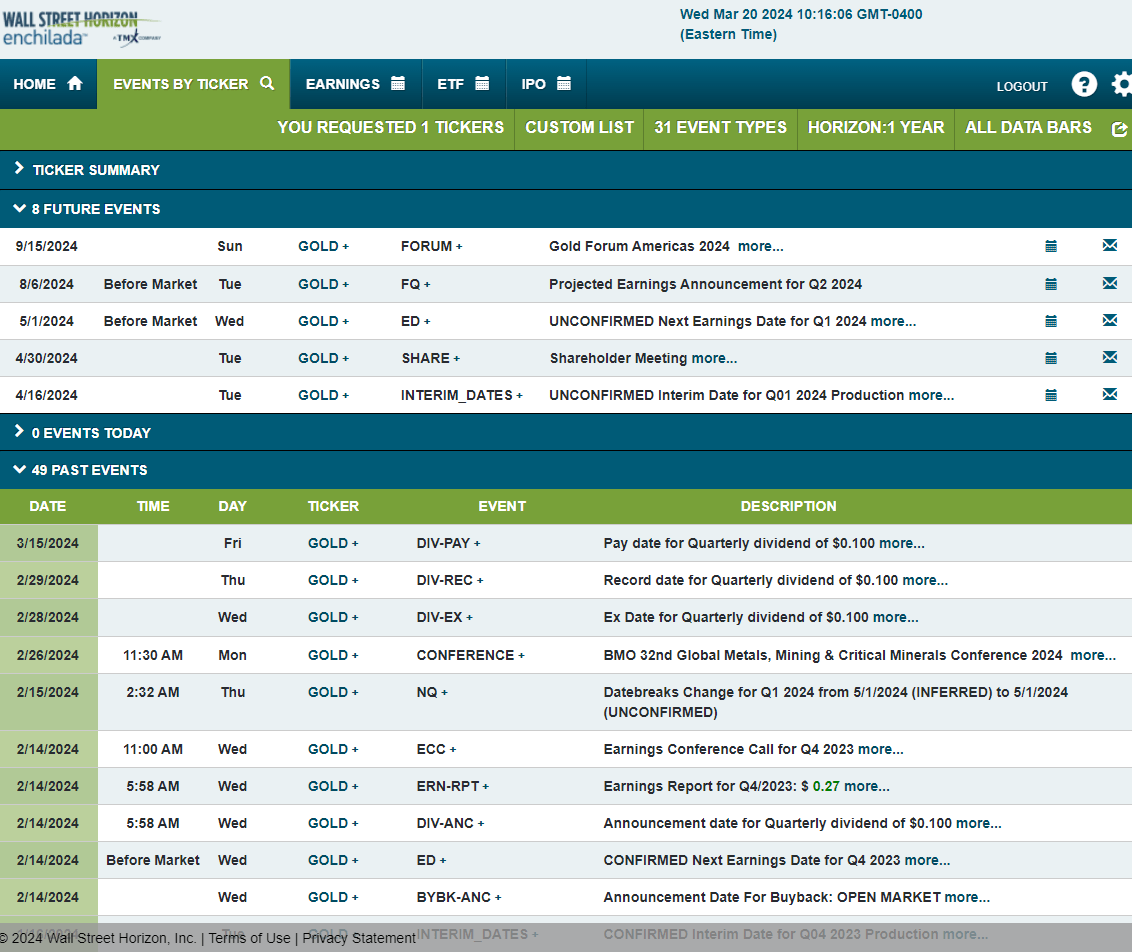
Barrick Gold Corporation stock has been stuck in a bearish downtrend since its peak back in the second quarter of 2022. Notice in the chart below that the gold stock has key support just above the $13 mark. So long as that area holds, being long can make sense. Of course, owning this gold miner has been a tremendous opportunity cost as the broader international stock market has been on the rise.
Also take a look at the descending trendline off an interim high notched in May 2023 – if we see the bulls carry GOLD above about $18, then shares could be off to the races back toward the mid-$20s. But with a falling long-term 200-day moving average and bearish RSI momentum divergence seen earlier in 2024, there are headwinds. Moreover, a high amount of volume by price is seen from $15 up to about $20, making conditions tough sledding for the bulls.
Overall, the technical chart is lackluster, but we do have important support off of which to trade.
Stockcharts.com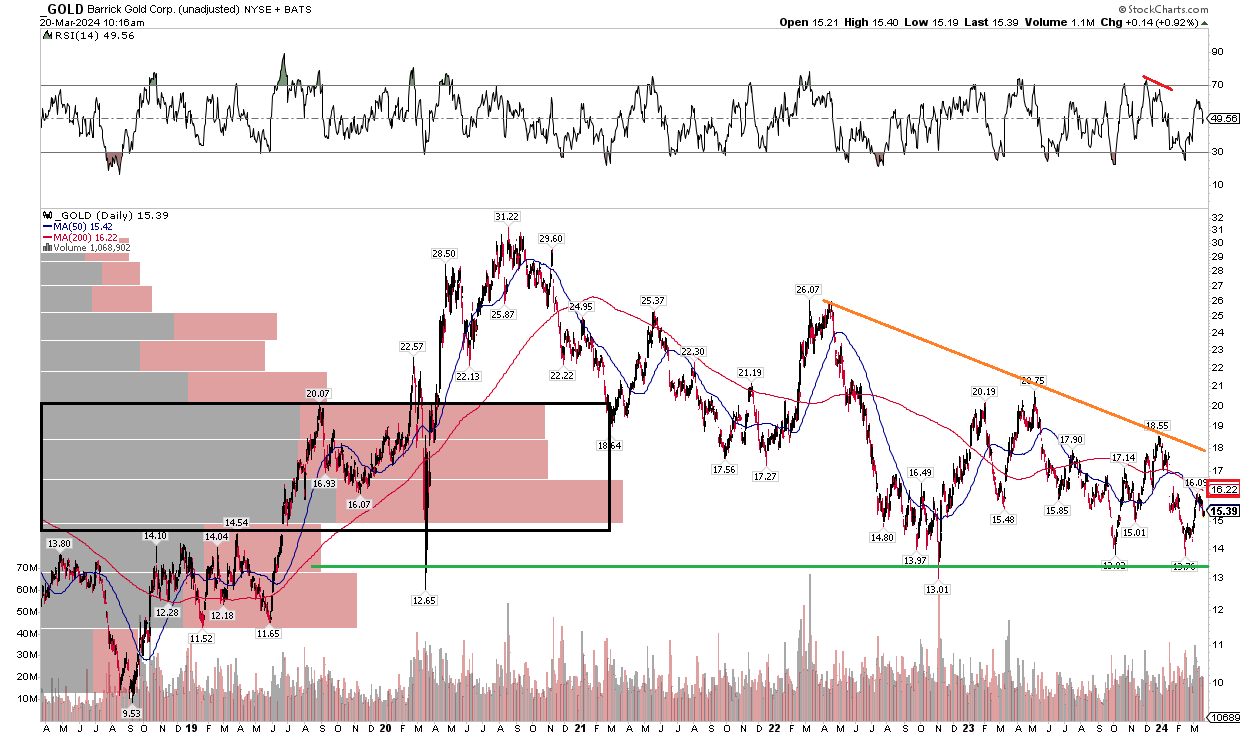
I have a buy rating on Barrick Gold Corporation. Shares are undervalued in my view, while the technical chart has work to do to reverse a protracted downtrend.