shapecharge
shapecharge
iShares U.S. Medical Devices ETF (NYSEARCA:IHI) warrants a buy rating due to multiple factors impacting the fund. While IHI has the highest expense ratio compared to peer medical device and healthcare funds, it also has demonstrated the greatest long-term performance. Additionally, although IHI has multiple valuation metrics higher than competitor funds, the iShares ETF has several key holdings including Abbott Laboratories and Intuitive Surgical that are already taking advantage of several medical technology breakthroughs.
IHI is a passively managed exchange-traded fund that seeks to track the Dow Jones U.S. Select Medical Equipment Index. With its inception in 2006, the fund has 54 holdings and $5.62B in AUM. The fund focuses entirely on holdings within the health care equipment industry within the health care market sector.
For comparison purposes, other funds examined are the SPDR S&P Health Care Equipment ETF (XHE), the Invesco S&P SmallCap Health Care ETF (PSCH), and the Vanguard Health Care ETF (VHT). XHE tracks the S&P Health Care Equipment Select Industry Index. The fund includes large, mid, and small caps that focus on the health care equipment and health care supply sub-industries. PSCH seeks to capture the performance of the S&P SmallCap600 Capped Health Care Index. The fund therefore includes small-cap value and growth holdings. VHT tracks the MSCI U.S. Investable Market Health Care 25/50 Index. The fund is passively managed and includes small, mid, and large cap holdings within the health care market sector in general.
IHI has seen a 10-year average annual return of 13.88%. By comparison, XHE has seen a 10-year average return of 8.97%, PSCH has a 10-year average return of 8.96%, and VHT has a 10-year average return of 10.82%. Of the funds compared, only IHI has outperformed the S&P 500 Index over the past decade.
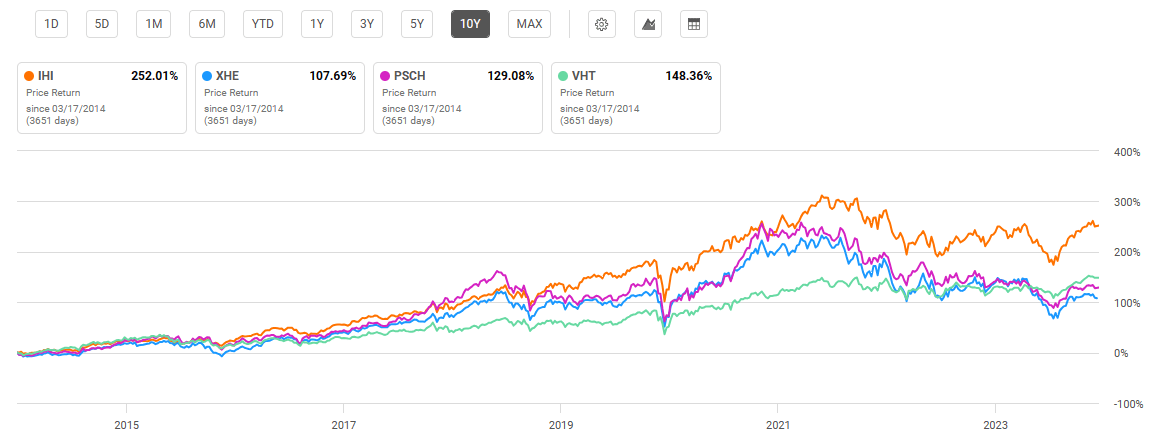
10-Year Total Price Return: IHI and Compared Health Care Funds (Seeking Alpha)
Although IHI has demonstrated the greatest price return over the past 10 years, one downside is its fees. With an expense ratio of 0.40%, IHI comes with the highest cost compared to peer health care ETFs. None of the compared funds have significantly high dividend yields, including IHI, with a yield of just 0.50%. However, IHI’s dividend growth is the greatest with a 5-year CAGR of 26.65%.
Expense Ratio, AUM, and Dividend Yield Comparison
IHI | XHE | PSCH | VHT | |
Expense Ratio | 0.40% | 0.35% | 0.29% | 0.10% |
AUM | $5.62B | $264.89M | $230.25M | $20.83B |
Dividend Yield TTM | 0.50% | 0.03% | 0.01% | 1.28% |
Dividend Growth 5 YR CAGR | 26.65% | -15.92% | 20.82% | 8.94% |
Source: Seeking Alpha, 17 Mar 24
IHI is the least diversified fund of healthcare ETFs examined with just 54 holdings. It is also the most concentrated on its top 10 holdings with a combined weight of 72.23%. VHT is the most diversified fund with 414 holdings.
Top 10 Holdings for IHI and Peer Health Care ETFs
IHI – 54 holdings | XHE – 68 holdings | PSCH – 69 holdings | VHT – 414 holdings |
ABT – 17.90% | SILK – 2.43% | ENSG – 6.05% | LLY – 9.95% |
ISRG – 11.74% | SWAV – 2.30% | ALKS – 4.21% | UNH – 7.47% |
MDT – 9.74% | ALGN – 2.16% | OGN – 4.10% | JNJ – 6.36% |
SYK – 6.07% | EW – 2.03% | GKOS – 3.66% | MRK – 5.27% |
EW – 5.28% | GKOS – 2.03% | MMSI – 3.64% | ABBV – 5.09% |
BSX – 4.80% | RXST – 1.99% | ITGR – 3.33% | TMO – 3.60% |
GEHC – 4.34% | GEHC – 1.94% | PBH – 3.25% | ABT – 3.37% |
DXCM – 4.32% | ITGR – 1.93% | FTRE – 3.06% | DHR – 2.91% |
IDXX – 4.04% | MASI – 1.91% | SEM – 2.63% | PFE – 2.54% |
BDX – 4.00% | ISRG – 1.86% | RDNT – 2.36% | AMGN – 2.40% |
Source: Multiple, compiled by author on 17 Mar 24
Looking forward, there are multiple factors that will lift up all compared funds but also IHI specifically. The first key driving factor behind IHI’s continued rise is the expected growth of the medical device industry. With major medical technologies coming to market, strong revenue is likely for companies that are able to acquire approval to bring their products to market. Additionally, IHI’s top two holdings, Abbott Laboratories (ABT) and Intuitive Surgical, Inc. (ISRG), are both uniquely postured to take advantage of strong sales growth in their respective business segments. ABT and ISRG together make up almost 30% of IHI’s holdings weight. These unique advantages for IHI are discussed in further detail below.
The first driving factor for IHI and top peer competitors is the expected medical device industry growth. The artificial intelligence boom is not just for mega-cap, big tech companies. Medical devices companies such as the ones found in IHI’s top holdings also stand to benefit greatly. While the U.S. medical device manufacturing market is expected to see a 5.8% CAGR through 2030, there are a number of technologies that may drive an even greater growth rate. The first is the application of wearable health care devices that can be tied into the “internet of things” and result in holistic, preventative medicine. Additionally, 3D printing has potential application in the medical device and health care industry including surgical instruments and prosthetics.
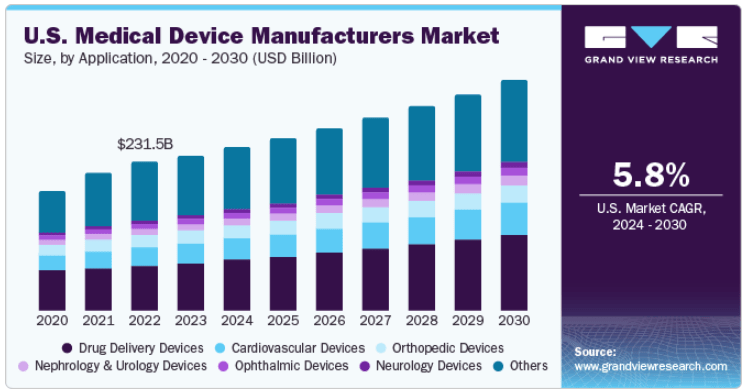
Forecast Medical Device Market Growth, 2020-2030 (www.grandviewresearch.com)
IHI’s top holding, ABT, is one key company poised to take advantage of this medical device industry growth. Abbott saw a strong 2023 with 11.6% increase in sales growth. Additionally, the company expects another solid year in 2024 with 8-10% in additional growth. Despite struggles due to the decline of COVID testing, Abbott is expecting strong returns from its business segments including glucose monitoring products, nutrition care, and diagnostics testing. One key product that is already taking advantage of the industry growth previously discussed is the Assert-IQ insertable cardiac monitor that received FDA approval just last year. The product by Abbott has the longest battery life of competitors and allows for remote programming and continuous monitoring. Therefore, Abbott Laboratories is a fundamental holding that will drive IHI’s future price return.
The second key holding for IHI driving future returns is ISRG. Intuitive Surgical is well known for its development of the da Vinci surgical robotics system. Importantly for ISRG, the company received FDA approval for the da Vinci 5 just this past week. The da Vinci system allows surgeons the ability to conduct minimally invasive surgery by translating their hand movements into precise robotic actions.
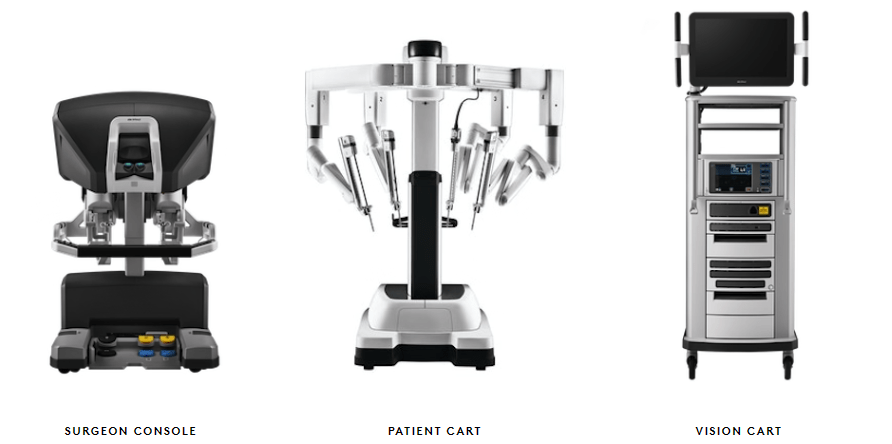
da Vinci Surgical System: Three Major Components (www.intuitive.com)
While this line of products has resulted in strong earnings for ISRG, the da Vinci has not come without issues. Over the past 10 years, there have been 20,000 recorded adverse events from the da Vinci with several lawsuits. In 2018, a class action lawsuit was settled by Intuitive Surgical for $42.5M. However, the company has continued to make updates, improvements, and released newer models. ISRG has seen a 69% price return over the past year and demonstrates strong fundamentals including a 14.5% YoY revenue growth and 25.4% net income margin.
IHI has a current price of $57.10 at the time of writing this article. This price is near the top of its 52-week range of $43.96 to $59.14. IHI’s one-year performance has been superior to all compared funds except for Vanguard’s VHT. VHT has performed well over the past year predominantly due to its top holding of Eli Lilly and Company (LLY) which has seen a 128% one-year return. Primarily due to strong returns of the “magnificent seven” big tech companies uplifting the market overall, IHI has also underperformed the S&P 500 Index over the past year.
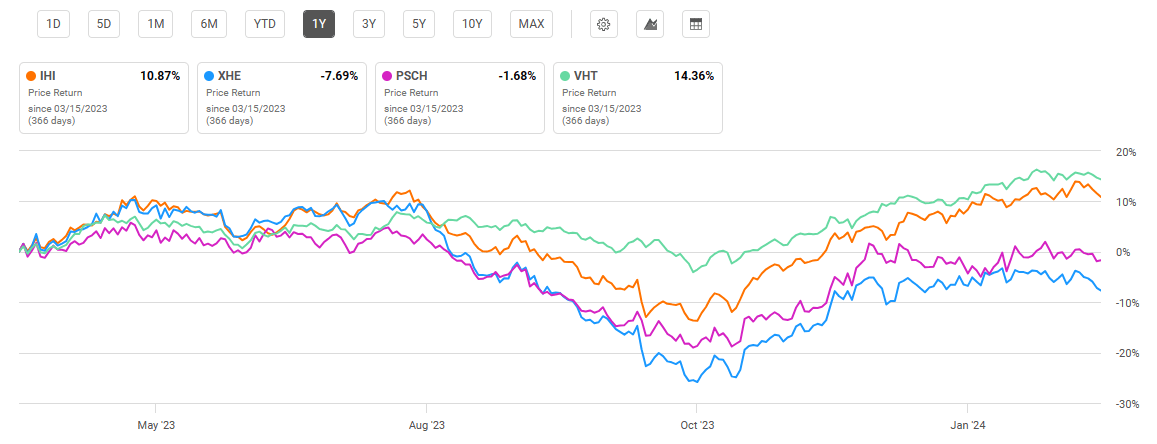
One-Year Performance: IHI and Peer Health Care & Medical Device ETFs (Seeking Alpha)
One downside for IHI is its current valuation compared to the peer funds examined. Looking at IHI’s price-to-earnings ratio, we see the highest value compared to peer funds at 38.90. Additionally, IHI’s price-to-book ratio is also high compared to peers at 4.44. Despite this high valuation, IHI has a strong holdings mix including the top two previously discussed that will drive IHI to continued growth looking forward.
Valuation Metrics for IHI and Peer Competitors
IHI | XHE | PSCH | VHT | |
P/E ratio | 38.90 | 23.37 | 33.07 | 33.00 |
P/B ratio | 4.44 | 2.94 | 3.54 | 4.60 |
Source: Compiled by Author from Multiple Sources, 17 Mar 24
Although strong returns are expected for holdings such as ABT and ISRG, IHI is not without risk. An immediate risk to its holdings is the potential for lawsuits as seen with the da Vinci system. Although medical devices and health care products undergo rigorous testing and evaluation processes, lawsuits are likely to occur in the event of mishaps. In addition to legal risks, IHI is roughly as volatile as “the market” overall. Utilizing beta value as an implied metric for volatility, IHI has a 3-year beta value of 0.97. By comparison, VHT has a 5-year beta value of 0.72, which is relatively less volatile. Therefore, just because IHI contains holdings within the healthcare sector, investors should not assume the fund will be stable compared to the market overall.
IHI has multiple strengths driving a buy rating for the fund. In addition to numerous advances in the medical device industry, IHI has several key holdings including Abbott Laboratories and Intuitive Surgical that have made key advances in their respective business segments. IHI is therefore poised to continue seeing strong returns consistent with its performance history. However, risks exist for the fund including lawsuits for medical devices and competition that will encroach on the successful products of Abbott and Intuitive Surgical. Finally, despite IHI’s track record for performance, it currently has a relatively high expense ratio and P/E ratio compared to peer funds.