
adventtr/E+ via Getty Images
adventtr/E+ via Getty Images
Many pundits are questioning where we're at in the cycle of evaluating whether stocks are expensive or not. The "it's different this time" notion always pops up when the market starts trading at stretched multiples exceeding the long-term average.
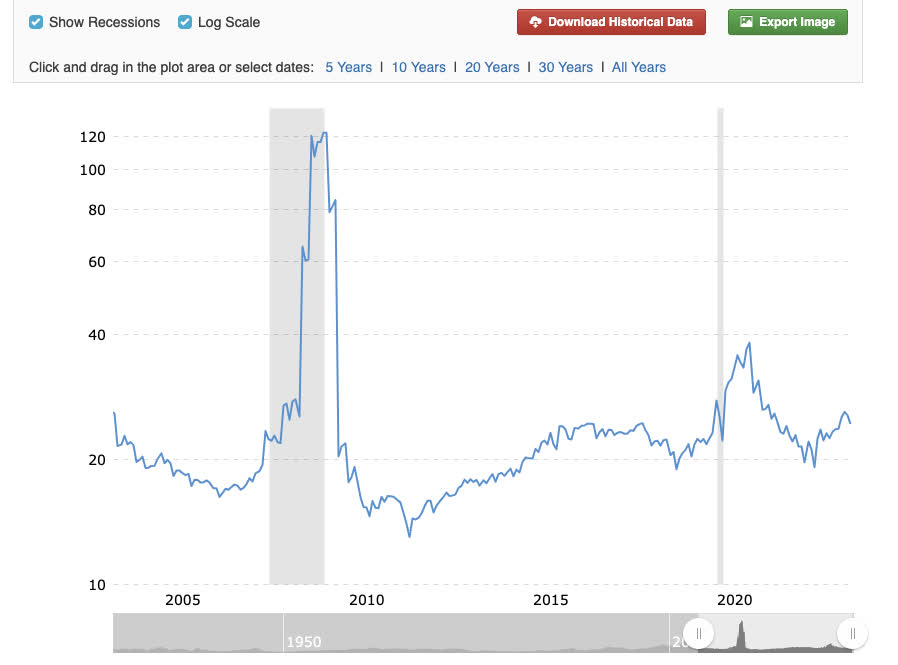
www.macrotrends.net
Disregarding the Schiller "CAPE" ratio and just observing the plain old vanilla P/E ratio by year, we currently sit at around 24 X TTM and 21 X Forward. Looking back further, 24 X is around 1997 levels if we're trying to compare this to the run-up before the lost decade of 2000-2010 ensued. For those not familiar with the term, it's the decade where the S&P 500 returned virtually nothing depending on where you bought it using an index fund.
A going theory that a long period of outperformance [ like the bull run we are on now] is typically followed by long periods of underperformance is gaining a foothold on podcasts, shows, and articles.
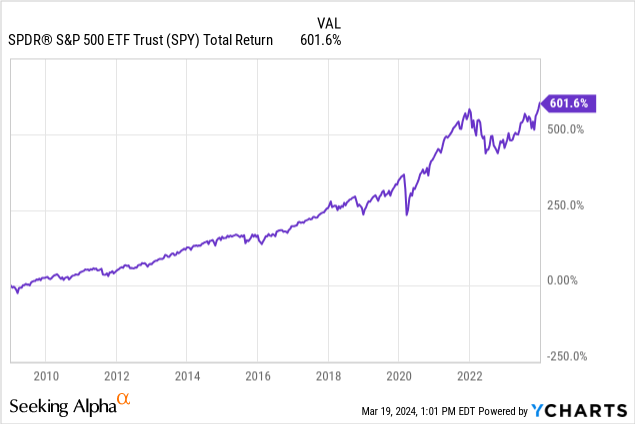
The total return level for holding the S&P 500 (SPY) for the sake of this analysis from Jan 1 2009 until Jan 1 2024 has been a period of historical outperformance.
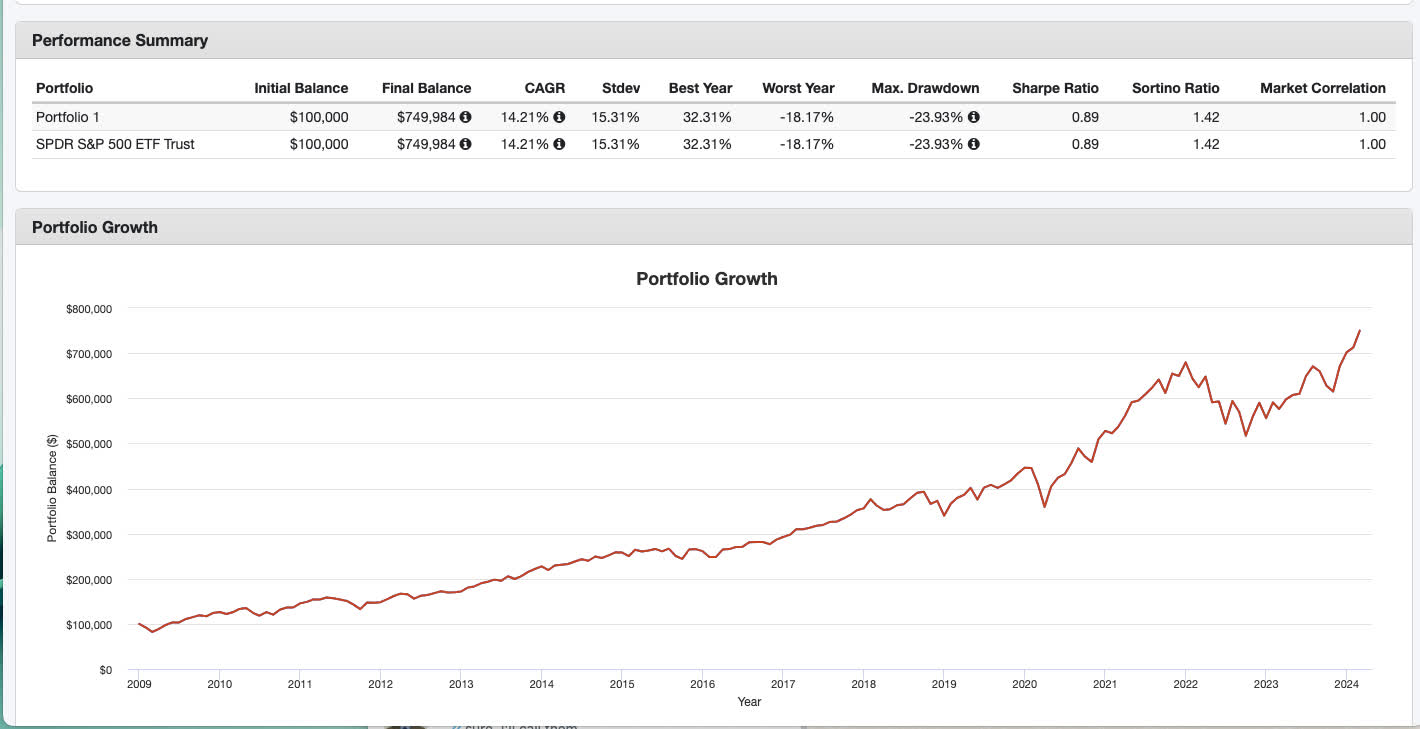
portfoliovisualizer.com
The total return CAGR for the S&P 500 from 2009 until current is 14.21%, clear outperformance when the long-term average is usually stated in the range of 9-10% for the market. With dividends reinvested, SPY would have turned $100,000 USD into $749,984 during this period.
So the question is, do we have to pay the piper for all of this historical alpha that lucky investors in this period have reaped? Let's look at some hedges and sectors that outperformed during the lost decade of 2000-2010 and are still trading at fair to cheap values. I'm certain the quants of Wall Street will be looking for similar data should we enter a secular downtrend.
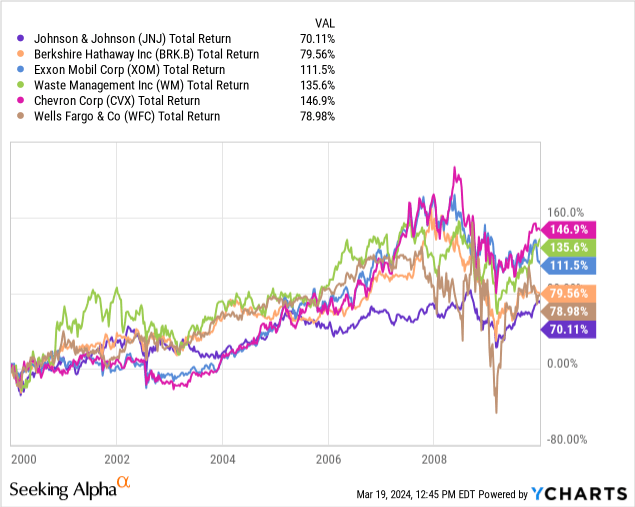
Looking at some of the total return winners from the "lost decade" of 2000-2010, we see some boring choices with less cyclicality than we get during the large boom periods before a bust where new demand gets pulled forward. Energy, insurance, healthcare, financials, and waste disposal are all things we need whether we're rich or poor, happy or sad. Daily essentials tend to outperform when all else in the market fails.
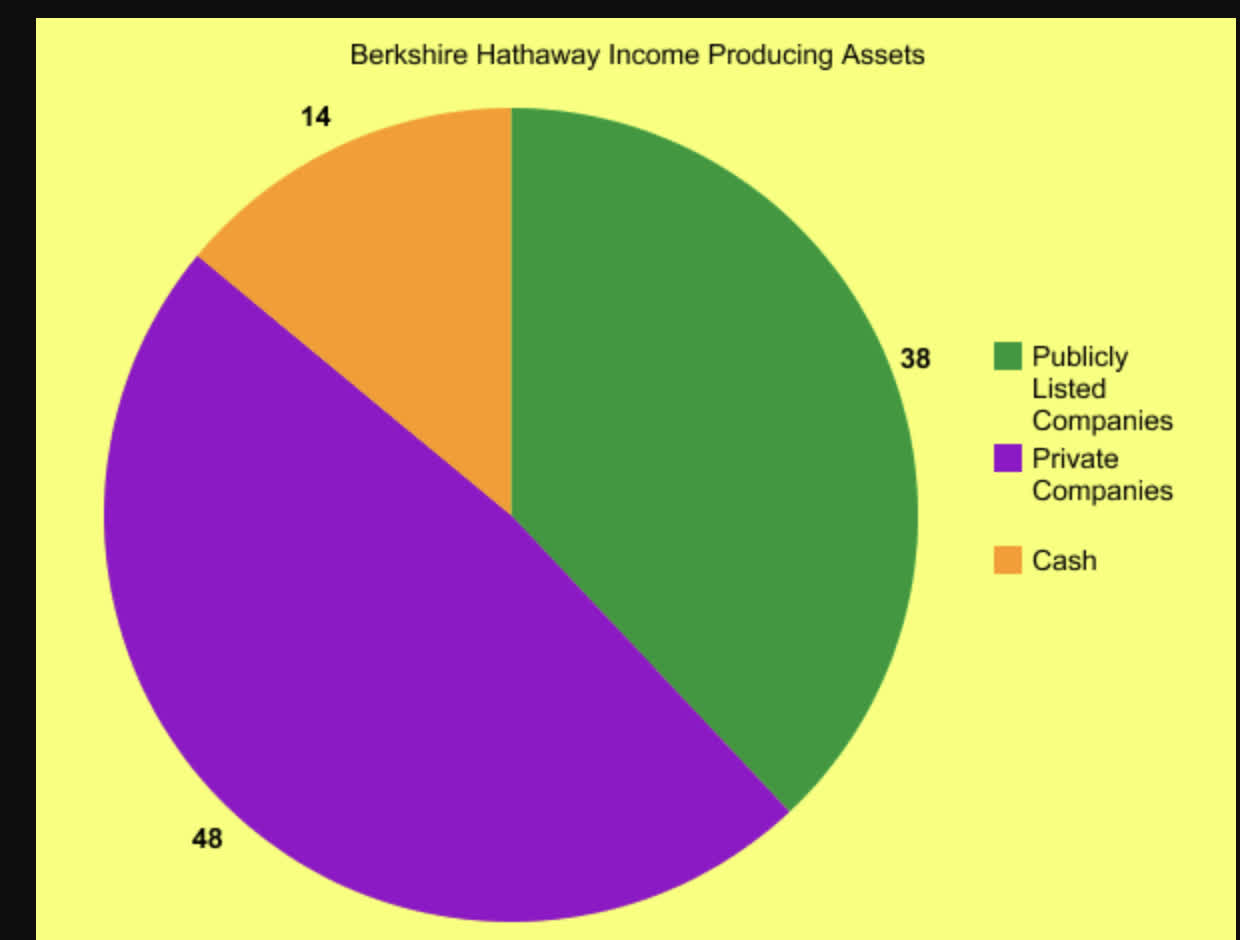
Berkshire Hathaway, (BRK.B)(BRK.A) returned 79.56% over this period of 2000-2010. While it is lower on this list of total returns, it is also the closest instrument that you'll find to an index fund with a more defensive orientation. Yes, pundits have criticized Berkshire's large holding in Apple (AAPL), but it's still a small proportion of Berkshire Hathaway's overall assets. In my article, I created a pie chart that roughly represents what you're buying when you get a share of Berkshire Hathaway:
My own excel sheet from Berkshire Balance Sheets
The publicly listed holdings part of the company only makes up 38% of the overall company. 14-15% is in cash [ currently spinning off a lot of interest income risk free], and the rest is in privately held businesses.
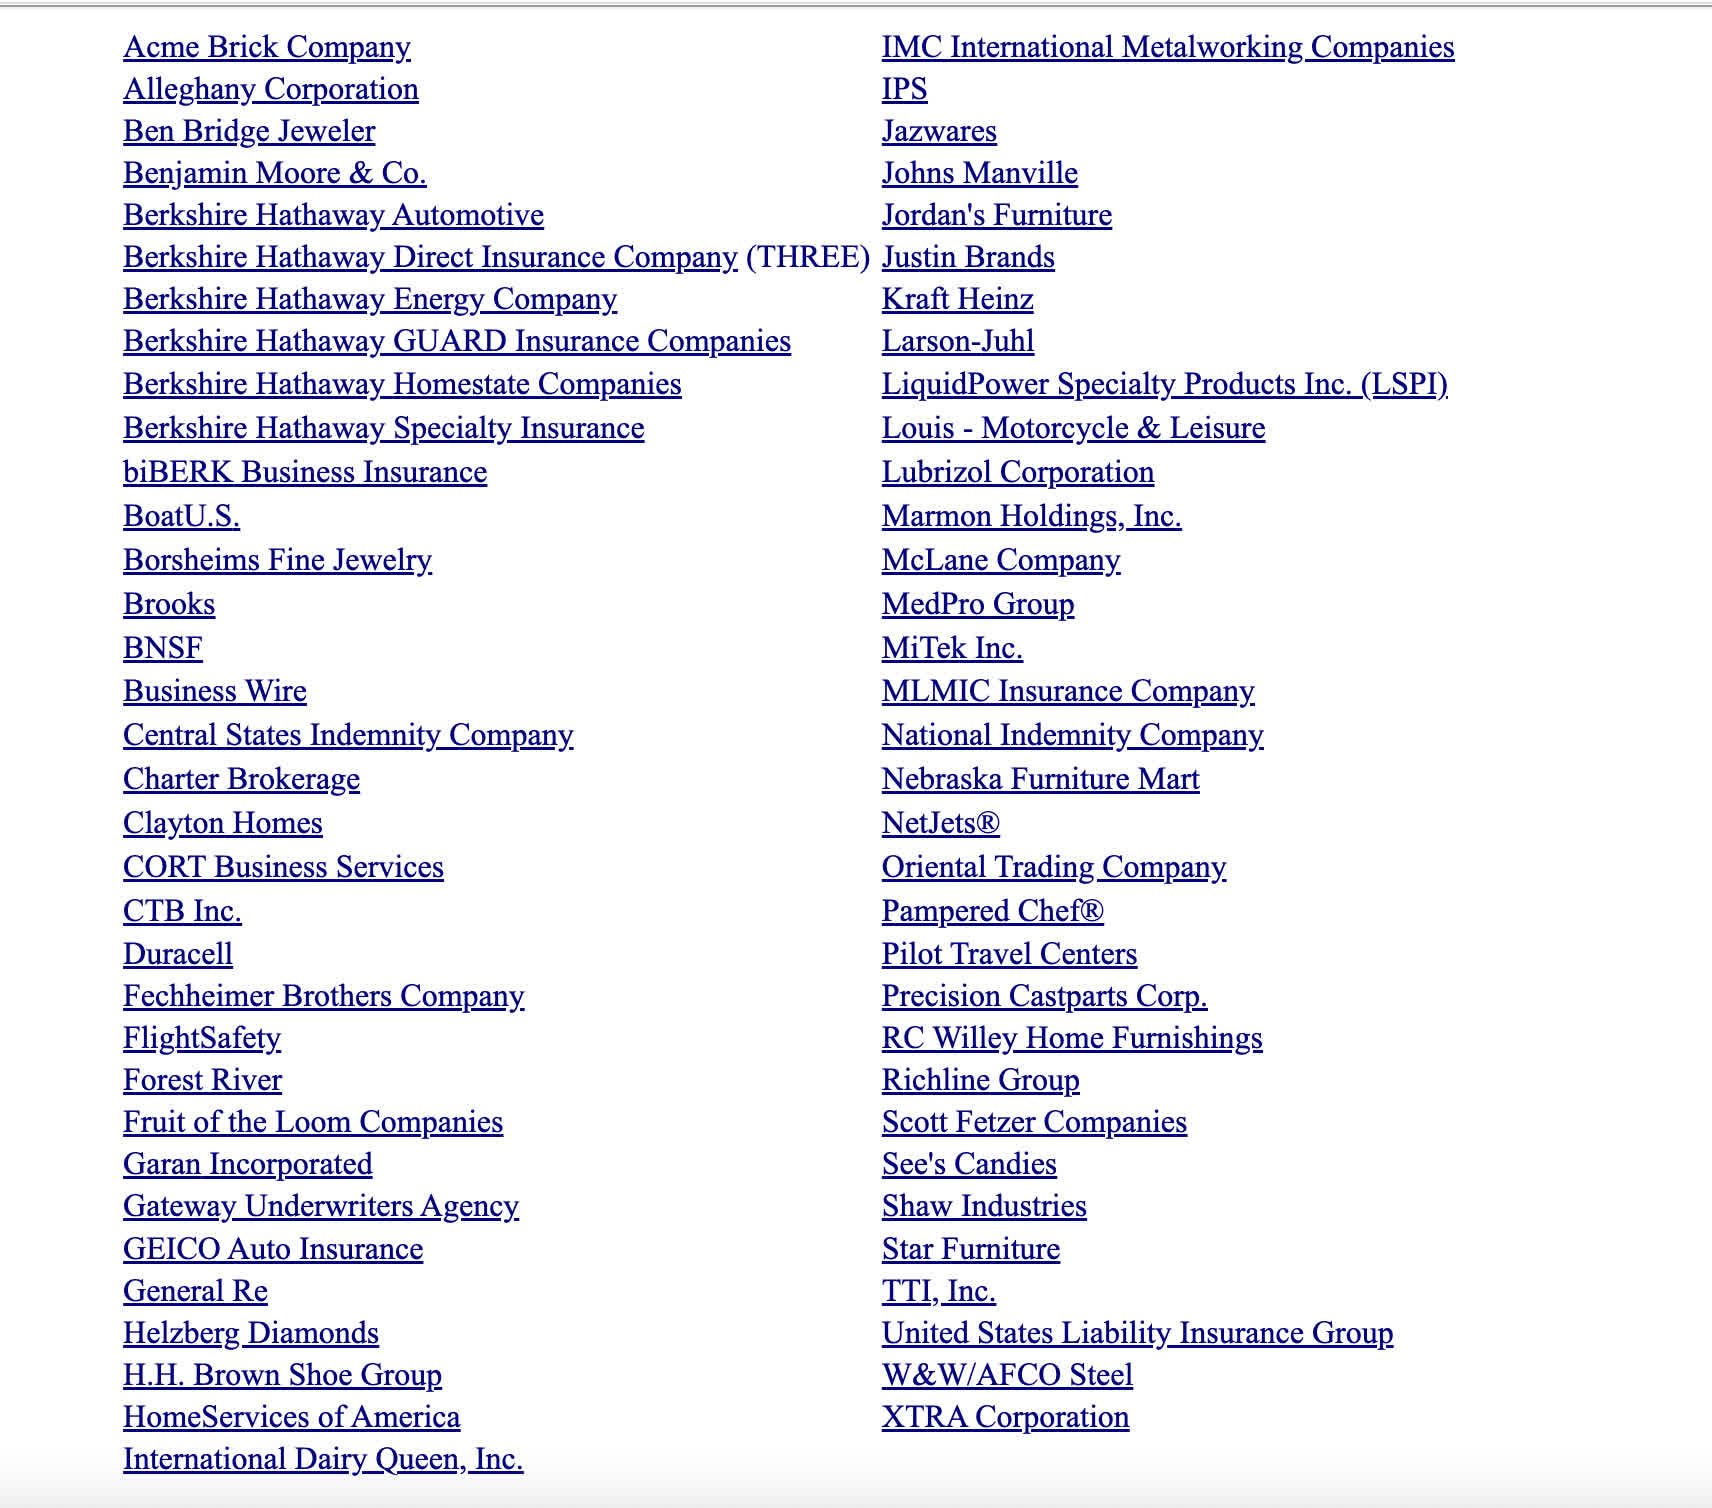
Berkshire Hathaway Investor Relations
Here you get a lot of utilities, rail, high-margin consumer discretionary, and insurance. Most of these have little to no areas to reinvest capital yet have a great return on equity for their existing operations. This leads to cash being fed up the supply chain to Berkshire Hathaway holdings for which its managers can then deploy into publicly listed stocks or keep in cash equivalents.
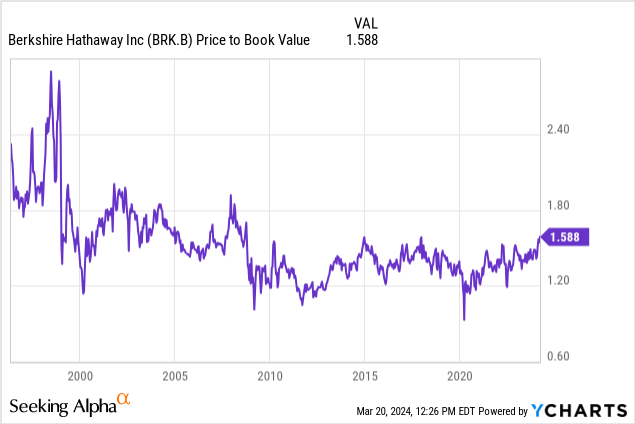
While Warren Buffett believes Berkshire is a good deal at 1.25 X book value, the stock currently trades at a bit of a premium to that but still within a reasonable range. The measure of Berkshire's success is its increase in book and tangible book value over time exceeding share price, rather than an earnings per share metric.
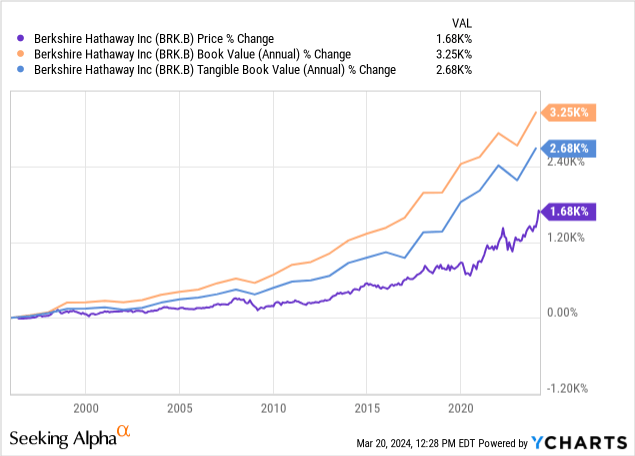
As we can see over time Berkshire Hathaway is successful at keeping book and tangible book value increasing over time more than share price appreciation. They create and add to their asset value logically and consistently rather than destroy it.
Healthcare has a reputation for functioning inversely to technology stocks. Johnson & Johnson has been dead money for a few years now. Litigation is one issue and growth in the top and bottom lines has been stagnant. This Dividend King, Johnson & Johnson had a total return of 70.11% over the lost decade of 2000-2010.
With the cost of capital at multi-decade highs, only Johnson & Johnson and Microsoft (MSFT) carry AAA credit ratings. Due to the company's ongoing talc lawsuit we see what appears to be a bargain. Johnson and Johnson has made headway into settling these lawsuits, but the ongoing effect on cash flow will need to be watched as a risk factor to the 61-year dividend streak. They also spun off the consumer product division Kenvue (KVUE) which makes J&J different than the company that was trading from 2000-2010. To get a similar exposure to this play, you could always buy shares of both companies. Kenvue was only about $2 Billion of J&J's cash flow priorly, so the spin-off does not alter the investment thesis too dramatically in regards to now versus then.
Bad news creates opportunities and better valuations, you just don't get deals without them[unless quants are asleep at the wheel].
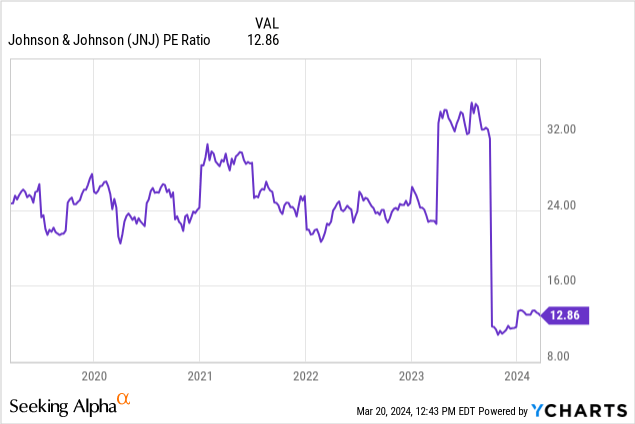
Exhibit 1: The stock is currently trading near a 5 year low P/E ratio.
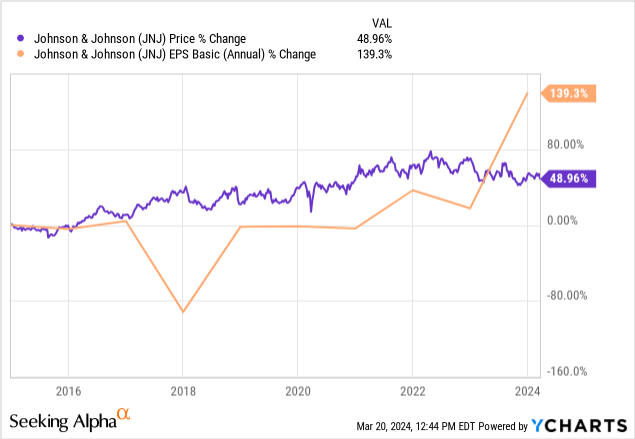
Exhibit 2: The stock is now trading at a discount to its 10 year EPS increase percentage with a gap of around 90%.
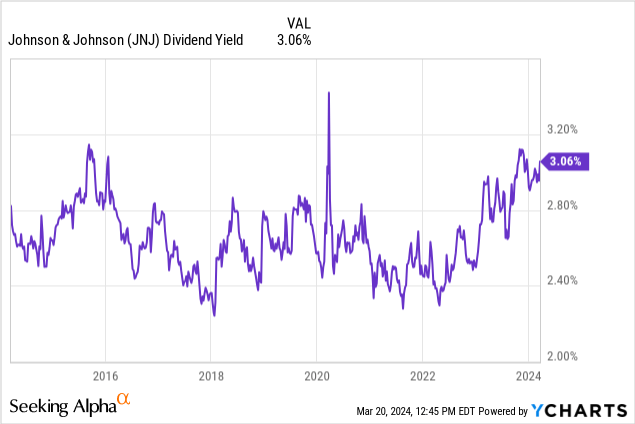
Exhibit 3: The stock is now trading near a decade high dividend yield.
| STOCK | TTM EPS | BOOK VALUE | GRAHAM NUMBER | TTM FCF Yield |
| (XOM) | 8.89 | 51.57 | 101.56 | 7.38% |
| (CVX) | 11.41 | 86.27 | 148.82 | 6.80% |
Exxon Mobil had a total return of 111% and Chevron 146% over the 2000-2010 period. There are only a select few industries where the Graham number comes in hand from The Intelligent Investor, energy and financials being amongst those. This incorporates both the "cheapness" of assets combined with the "cheapness" in earnings. Benjamin Graham equated that a fair deal from the era of tangible asset-heavy industrial stocks is a price where the P/E ratio X the P/B ratio does not exceed 22.5.
Using this, both stocks appear slightly overvalued now after their run-ups from the COVID-19 lows. However, both are dividend aristocrats, both are buying back shares and both have TTM-free cash flow yields well in excess of the risk-free rates.
I heard an excellent interview from Schlumberger's(SLB) CEO Olivier Le Peuch yesterday regarding energy and how it relates to economic expansion including societal technological advances. When observing the post-tech boom of 2000, a lot of demand for fiber and chips was also pulled forward faster than it would have been had there not been excitement around the internet.
Likewise, orders from chip makers now combined with worldwide data center and chip fab production will certainly spurn energy use for years to come. You've bought all these chips, and now you have to build your data centers to house them, racks to fit them into, and electricity to run them.
Natural gas is still the main source of power plant electricity production and oil is certainly the energy medium used by construction equipment. While the orders for new technology products may have already reached their peak, the CAPEX in making all this stuff work has just begun.
While we may not see a large jump in oil prices, volume is still a huge factor in the top and bottom lines for integrated oil companies like Exxon and Chevron. High demand and high supply can live together under one roof. While oil & gas have seen chronic underinvestment in this last decade, which leads many to believe that a spike in prices is also inevitable, infrastructure growth should help energy companies grow regardless of the energy price environment.
My largest financial holding and the bank that makes me think of Warren Buffett every time I see the ticker is Wells Fargo. For avid readers of the annual letters typed up by Warren Buffett, Wells Fargo was always at the forefront of the thesis of why Berkshire's portfolio of public companies was strong and mighty. That all changed after the scandals of excess, and unauthorized account creation, and Buffett had a change of heart, dumping the long-time holding.
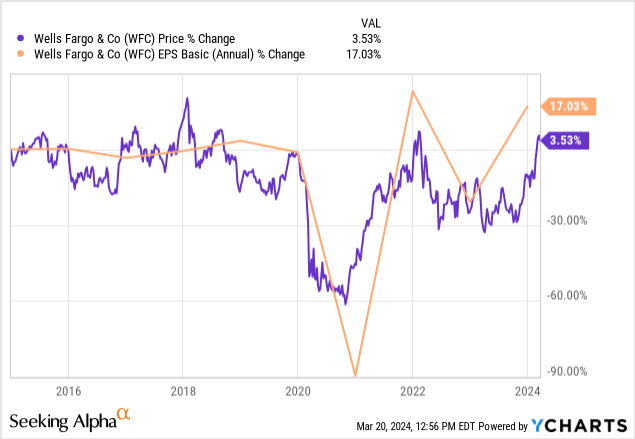
Wells Fargo had a total return of 78.98% during the 2000-2010 period.
I took the opportunity during COVID-19 to buy the big dip. The points Buffett always made about Wells Fargo is that they had conservative underwriting and were a simple-to-understand retail bank rather than a more complex investment bank.
The above chart shows that over 10 years, Wells Fargo has grown earnings at a faster rate than the share price, but both remain rather abysmal. Much of this is due to a penalty from the account creation scandal which caps the banks' assets. Wells Fargo is clearing some hurdles and could be close to un-capping their assets by the end of the year, here is a good update from Amercianbanker.com :
The biggest penalty Wells Fargo faced in connection with the scandal remains in effect — a Federal Reserve order from 2018 that prohibits the megabank from growing beyond $1.9 trillion in assets. But the OCC's termination of its penalty nonetheless represents a major milestone for CEO Charlie Scharf, whose main task since joining Wells in late 2019 has been putting the bank back in its regulators' good graces.
In the OCC action, which was dated last month, the agency said that "the safety and soundness of the Bank and its compliance with laws and regulations does not require the continued existence" of its 2016 order.
Funny enough, the cap restriction may have helped Wells Fargo avoid many bad loans in the commercial space and excess low-yielding treasuries that everyone is making a stink about.
With financials being another sector where the Graham Number comes in handy, let's take a look at Wells Fargo's fair price based on that:
| STOCK | TTM EPS | TTM BOOK VALUE | GRAHAM NUMBER |
| WFC | 4.88 | 46.21 | 71.23 |
While financials rarely trade in excess of their Graham Number, this one is 79% of its intrinsic value, a nice margin of safety.
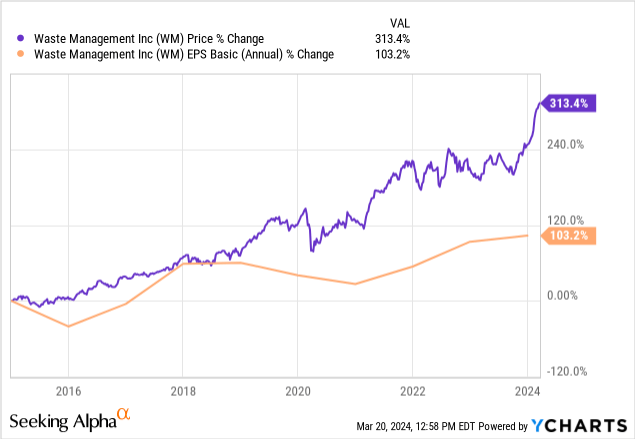
From 2000-2010 Waste Management gave investors a total return of 135% during this period, second to Chevron on the list. I recently wrote an article hailing a list of stocks that consistently compound the top and bottom lines and trade at multiples that defy gravity. Waste Management is one of those.
I said if you can't beat them, join them, but don't pay too much. I observed that in the last 5 years, the best earnings multiple we could get on Waste Management was 24 X. With that in mind with respect to current and forward earnings, I drew up a couple of "fair" prices for the stock:
While I don't like to chase, this may be a logical portfolio addition regardless of price should we get the downtrend signal. Waste collection is a high-moat industry with only two major players in the US, each with its territories. The other is Republic Services (RSG). They don't step on each other's toes and getting new landfills approved is not an easy task. As population and consumption grow, so does trash. The increases in online shopping should only spurn this growth story as cardboard boxes come along with every new order.
It could be different this time. No really, it could. The dominant tech companies leading the S&P 500 and Nasdaq higher are not all hype. They have gigantic market caps but some also have the cash flows and revenue to support it. The major risk in getting too conservative too soon is leaving money on the table. How close we are to the end of a bull run is anyone's guess.
Also, I am convinced that due to the slew of connectedness we share through digital mediums, buying the dip mentally returns faster than ever after a downtrend. Since everyone is now sharing data that says "Look what would have happened if you bought the dip in xyz bear market 'til now", there is almost a new FOMO that has been created. This is the dip FOMO, the fear of missing the nadir of a dip.
Additionally, companies are just finding more and more ways to become more profitable. More robotics, more AI, less overhead more profit. Yes, there may one day be less work available which is damaging to an economy, but the US also has the best social welfare system overall in the developed world. Maybe healthcare lags, but when you take all the benefits that an individual could get in totality, the US is good at keeping everyone involved in the economy.
I enjoy having this debate and researching what sectors and stocks could outperform should we be standing on the edge of a cliff. I don't like to sell stocks, so I accept that I one day will probably lose some of my gains in the short term. Therefore, if you're like me and have a low turnover and like to buy individual stocks, finding conservative places to put money as a hedge against stretched multiples is a worthwhile exercise. I own all of these names sans Waste Management and am considering adding to them.
Editor's Note: This article discusses one or more securities that do not trade on a major U.S. exchange. Please be aware of the risks associated with these stocks.