
Dilok Klaisataporn
Dilok Klaisataporn
We're well into 2024, and the dividend increases have been significant. It continues to be an excellent environment for dividend investing.
As an investor utilizing a dividend-growth strategy, I always look forward to receiving dividends, especially dividend increases. I have observed that companies that regularly increase their dividend payouts perform significantly better than those that do not. I constantly monitor these companies and am happy to share my insights on upcoming dividend increases. I have compiled a list of top stocks expected to raise dividends in the upcoming week. You can confidently use this analysis to construct your portfolio and for timely purchases.
The information presented here is a result of merging two sources of data - the "U.S. Dividend Champions" spreadsheet from this website and upcoming dividend data from NASDAQ. The process combines data on companies with a consistent dividend growth history with future dividend payments. It's important to understand that all companies included in this list have consistently grown in dividends for at least five years.
Companies must have higher total yearly dividends to be included in this list. Hence, a company may not increase its dividend every calendar year, but the total annual dividend can still grow.
The ex-dividend date is when you must purchase shares to be eligible for the upcoming dividend or distribution. To qualify, you must have bought the shares by the end of the preceding business day. For instance, if the ex-dividend date is Tuesday, you must have acquired the shares by the market close on Monday. If the ex-dividend date is a Monday (or a Tuesday following a holiday on Monday), you must have bought the shares by the previous Friday.
Here are the definitions of the streak categories, as I'll use them throughout the piece.
| Category | Count |
| King | 0 |
| Champion | 1 |
| Contender | 3 |
| Challenger | 1 |
Data has been sorted by the ex-dividend day (ascending) and then by the streak (descending):
| Name | Ticker | Streak | Forward Yield | Ex-Div Date | Increase Percent | Streak Category |
| RGC Resources Inc. | (RGCO) | 23 | 4.11 | 16-Jan-24 | 1.01% | Contender |
| EOG Resources, Inc. | (EOG) | 6 | 3.16 | 16-Jan-24 | 10.30% | Challenger |
| WD-40 Company | (WDFC) | 14 | 1.29 | 18-Jan-24 | 6.02% | Contender |
| Zoetis Inc. Class A | (ZTS) | 11 | 0.87 | 18-Jan-24 | 15.20% | Contender |
| Graco Inc. | (GGG) | 26 | 1.22 | 19-Jan-24 | 8.51% | Champion |
Streak: Years of dividend growth history are sourced from the U.S. Dividend Champions spreadsheet.
Forward Yield: The new payout rate is divided by the current share price.
Ex-Dividend Date: This is the date you need to own the stock.
Increase Percent: The percent increase.
Streak Category: This is the company's overall dividend history classification.
Here's a table mapping the new rates versus the old rates. It also reiterates the percentage increase. This table is sorted similarly to the first (ex-dividend day ascending, dividend streak descending).
| Ticker | Old Rate | New Rate | Increase Percent |
| RGCO | 0.198 | 0.2 | 1.01% |
| EOG | 0.825 | 0.91 | 10.30% |
| WDFC | 0.83 | 0.88 | 6.02% |
| ZTS | 0.375 | 0.432 | 15.20% |
| GGG | 0.235 | 0.255 | 8.51% |
Some different metrics related to these companies include yearly pricing action and the P/E ratio. The table is sorted the same way as the table above.
| Ticker | Current Price | 52 Week Low | 52 Week High | PE Ratio | % Off Low | % Off High |
| RGCO | 19.47 | 15.36 | 23.26 | 18.75 | 27% Off Low | 16% Off High |
| EOG | 115.02 | 95.38 | 135.06 | 0 | 21% Off Low | 15% Off High |
| WDFC | 272.46 | 160.53 | 245.76 | 57.71 | 70% Off Low | New High |
| ZTS | 198.8 | 144.23 | 201.92 | 45.63 | 38% Off Low | 2% Off High |
| GGG | 83.28 | 65.33 | 87.66 | 38.83 | 27% Off Low | 5% Off High |
I've arranged the table in descending order for investors to prioritize the current yield. As a bonus, the table also features some historical dividend growth rates. Moreover, I have incorporated the "Chowder Rule," which is the sum of the current yield and the five-year dividend growth rate.
| Ticker | Yield | 1 Yr DG | 3 Yr DG | 5 Yr DG | 10 Yr DG | Chowder Rule |
| RGCO | 4.11 | 2.3 | 4.5 | 5.3 | 5.2 | 9.5 |
| EOG | 3.16 | 21.1 | 34.5 | 35.6 | 24.6 | 38.7 |
| WDFC | 1.29 | 6.9 | 7.7 | 9.2 | 10.4 | 10.7 |
| GGG | 1.22 | 11.9 | 10.1 | 12.1 | 10.9 | 13.3 |
| ZTS | 0.87 | 18.4 | 23.8 | 24.6 | 27.3 | 25.5 |
My investment strategy involves finding stocks combining increasing dividends and consistently outperforming the market. I use the Schwab U.S. Dividend Equity ETF (SCHD) as my dividend growth benchmark. This ETF has a remarkable track record of exceptional performance, a higher yield than the S&P 500, and a proven record of growing dividends. I prefer to invest in the ETF if a stock cannot beat the benchmark. I've added companies to my personal investment portfolio based on this analysis. I also routinely use this analysis to choose timely additional purchases.
I'm comparing SCHD to everyone on the list. I've chosen the 10-year dividend growth rate as the comparator, as that is one of the key metrics to be included in SCHD. It's also a proxy for success, as it is hard to continually grow a dividend over long periods without the share price following. Here are the results.
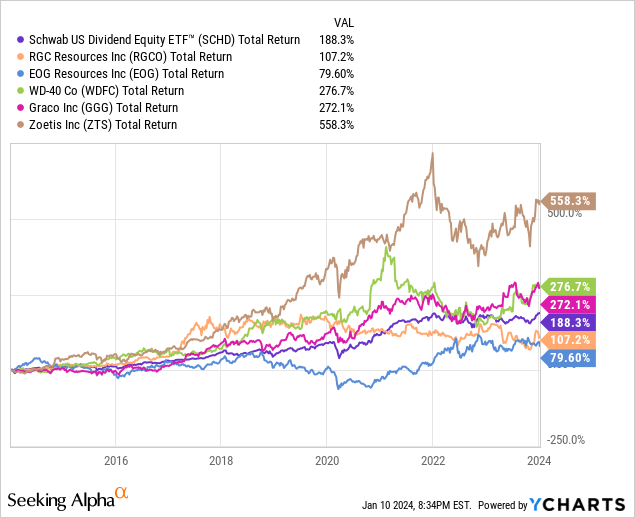
SCHD returned a very respectable 188% over a decade. Zoetis has been the huge winner, with a 558% total return. You can see why this has been a personal hold of mine for years.
WDFC and GGG both substantially outperformed SCHD, with returns at the 270% level.
Finally, RGCO and EOG came up in the rear with substantially lower performance than SCHD.
I plan to review ZTS more closely in the next few days if I wish to add to my position before the new dividend. Please do your due diligence before making any investment decision.