
metamorworks
metamorworks
Investors often get caught up focusing on the S&P 500, but there is a world of stocks away from the domestic large-cap space. An overlooked ETF is the Vanguard Extended Market ETF (VXF). This is an all-inclusive SMID-cap fund – it houses all US stocks not technically classified as large caps. It includes many big-name companies such as CrowdStrike (CRWD), Snowflake (SNOW), Super Micro Computer (SMCI), and KKR (NYSE:KKR). VXF has broken out to fresh highs since early 2022 as the equity rally broadens.
I’m focusing on KKR today. I reiterate a buy rating on the stock. I see fundamental earnings upside ahead and the very real possibility that the $87 billion market cap firm could be added to the S&P 500 later this year.
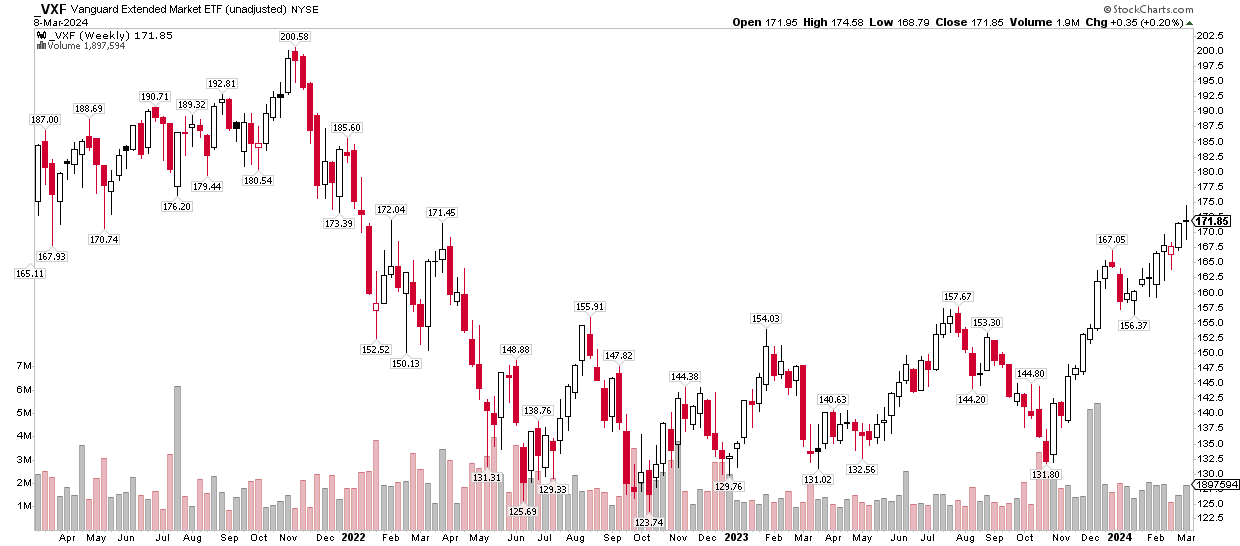
Stockcharts.com
According to Bank of America Global Research, KKR is a leading global investment firm that manages capital across several alternative asset classes including private equity, credit, and real assets. KKR has a differentiated business model with a large balance sheet and a sizable capital markets business.
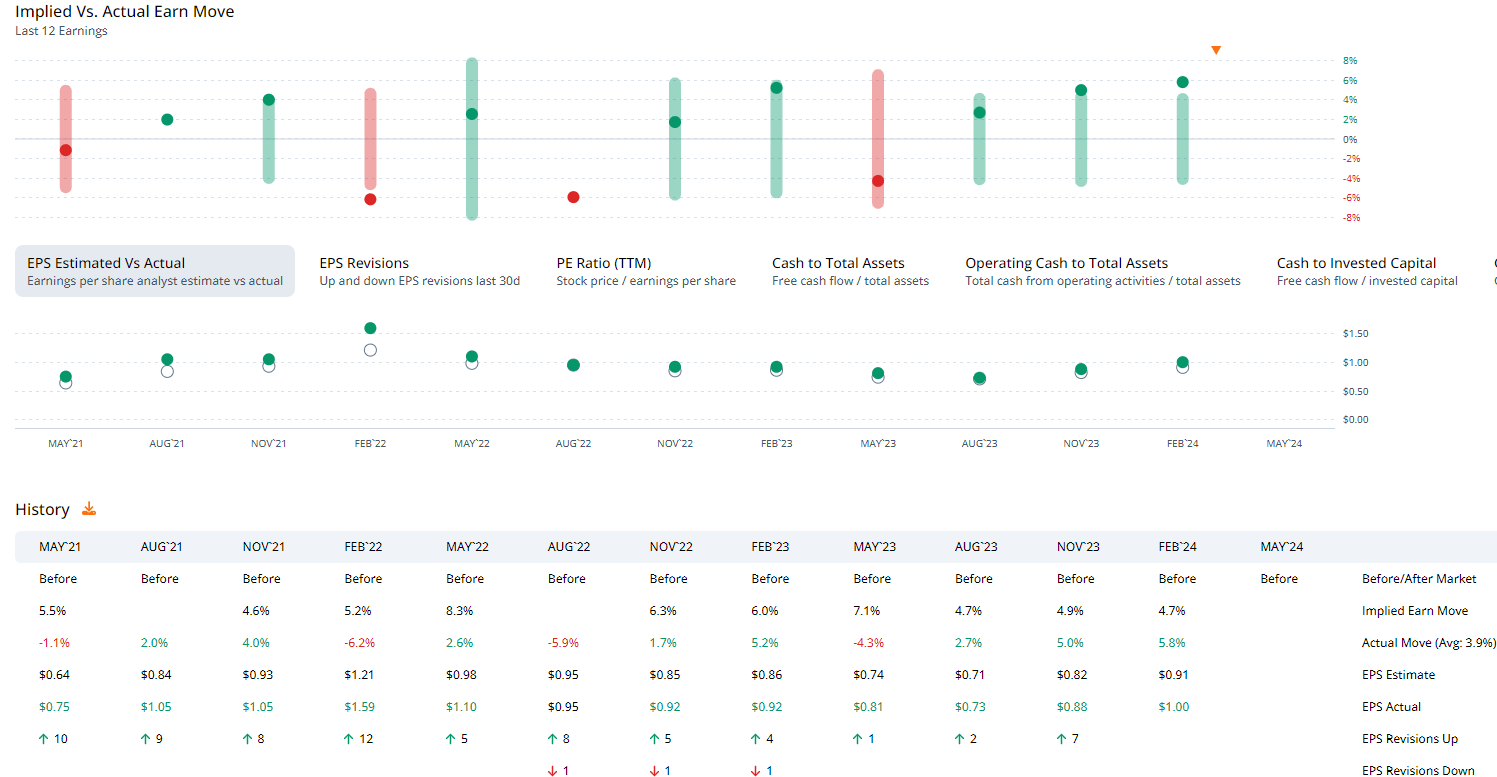
KKR has topped earnings expectations in each of the past 12 quarters. Its most recent quarterly report was exceptionally bullish. Per-share profits easily topped the Wall Street consensus estimate, and the stock rose more than 5% immediately after the February release, making it back-to-back strong reactions.
Data from Option Research & Technology Services (ORATS) shows an average actual move of 3.9% post-reporting, and while we don’t yet have a firmed up straddle pricing for the May 10 Q1 2024 release, expectations will likely be higher given the solid earnings run. Seeking Alpha reports that there have been a dozen EPS upgrades of KKR in the last three months.
With an acceleration in its fundraising, strong earnings trends, and inclusion in the S&P 500 possible over the coming months, there are plenty of fundamental tailwinds. A normalization in the bond market and rising equity prices help KKR’s earnings potential, too. KKR's total assets under management now stands at $553 billion as of the end of the latest quarter.
Key risks include a bearish overhang lingering from a hot market in 2020 and 2021 as well as a capital-intensive model. Furthermore, KKR’s voting structure may make SPX inclusion less attractive to the S&P governing body.
ORATS
On valuation, analysts at BofA, like many others on the street, notched up their EPS forecasts since last fall. Per-share operating profits are now expected to sum to more than $4.50 this year, nearly $6 in 2025, and above $7 by 2026. That is very strong growth.
The Seeking Alpha consensus numbers show a similar profitability trajectory. Revenue growth, meanwhile, is likewise stout with 44% advancement this year, 17% in the out year, and 30% in 2026. While the yield will remain modest in all likelihood, investors should consider owning KKR for its high earnings growth profile.
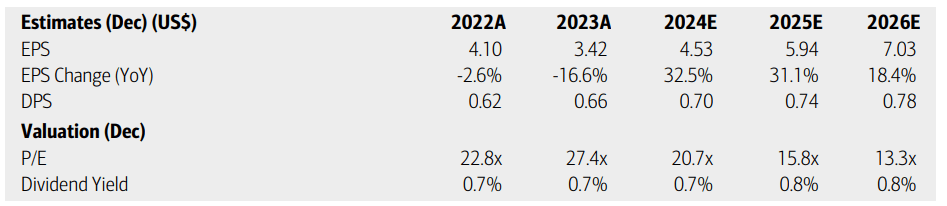
BofA Global Research
If we assume normalized EPS of $5.20 and apply a market multiple of 21, then shares should be near $109. I lifted my benchmark P/E for the stock because the earnings growth forecast has improved so much since last October. And that bottom-line rise is coupled with robust sales trends.
Seeking Alpha
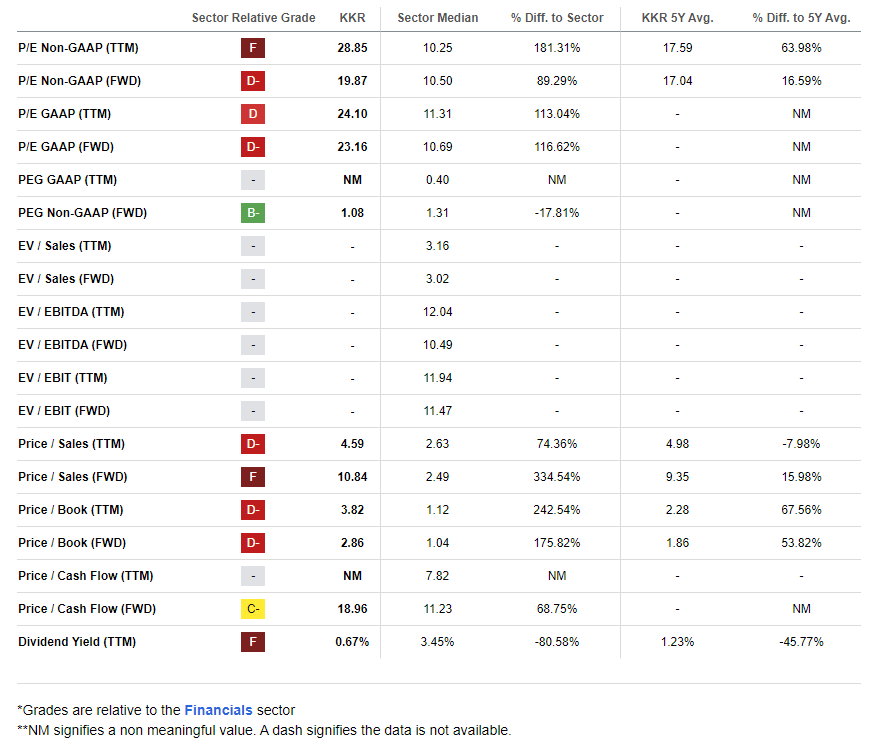
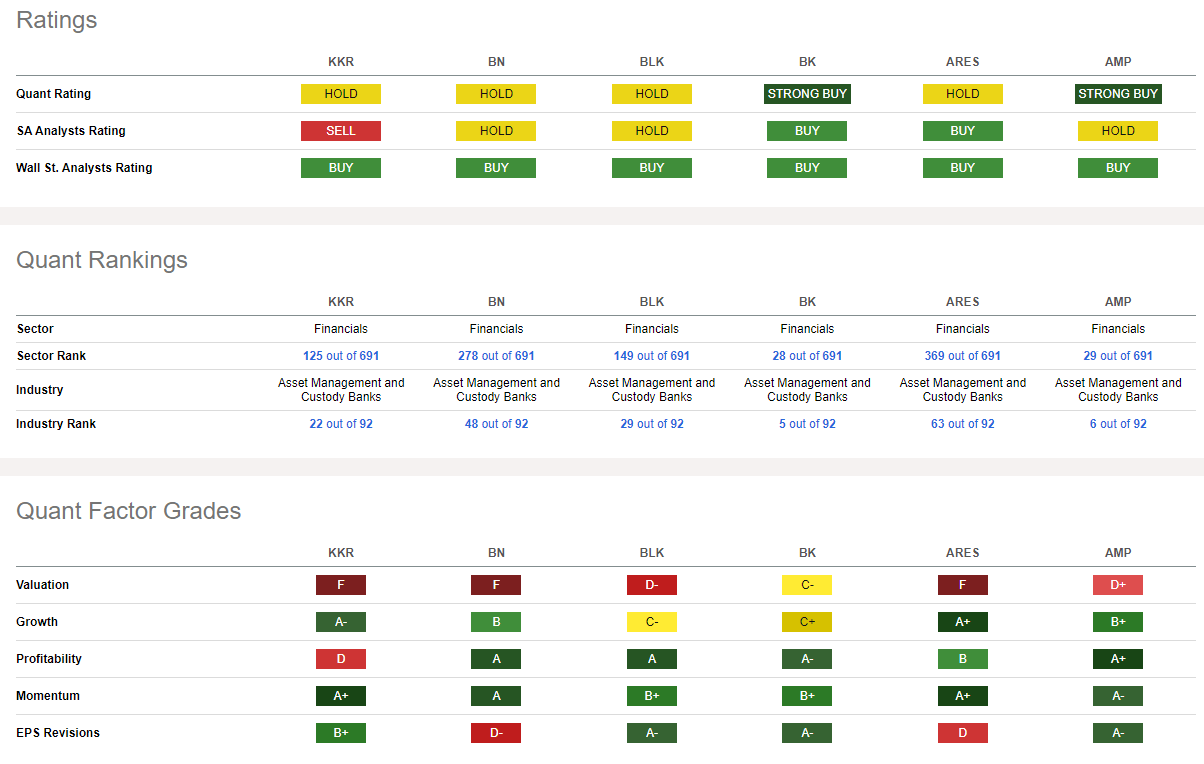
Compared to its peers, KKR features very high growth but a weak valuation grade, although I have demonstrated that the valuation is actually quite appealing when looking ahead. While profitability trends have been modest lately, a string of EPS beats is bullish for future earnings potential. Among the best momentum readings across the market, sellside analysts have turned much more sanguine on the stock via the B+ EPS Revisions grade.
Seeking Alpha
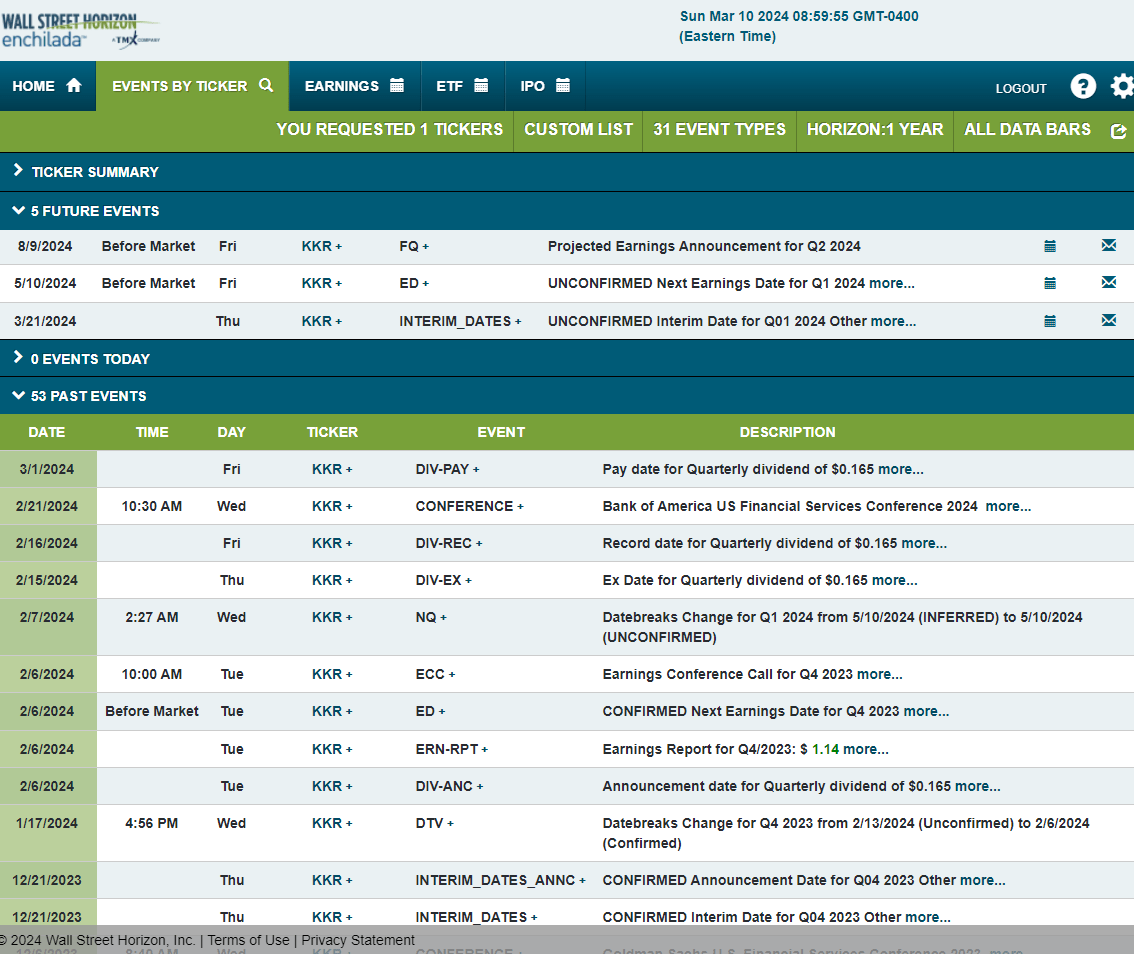
Looking ahead, corporate event data provided by Wall Street Horizon show an unconfirmed Q1 2024 earnings date of Friday, May 10. The firm also provides interim AUM data on Thursday, March 21.
Wall Street Horizon
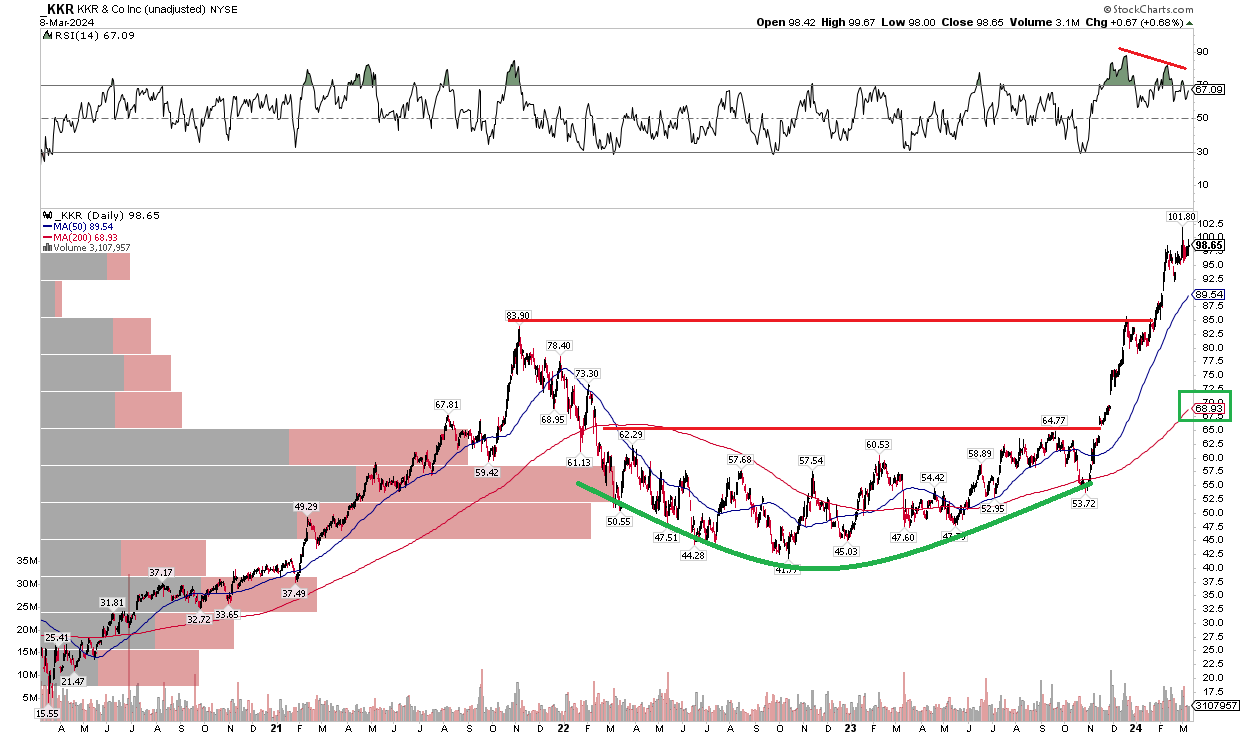
With high EPS growth in store and a valuation that remains decent, KKR’s chart is impressive. Notice in the graph below that shares broke out from a major base late last year, shortly after my October analysis. After touching its rising long-term 200-day moving average in the low to mid $50s in Q4 2023, the stock has nearly doubled. It has been among the major high-flying momentum names that continue to attract investors. KKR moved above its previous all-time high of $84 that was hit in 2021, with just a minor pullback around the turn of the year. With no overhead supply of shares, it is clear skies ahead with support at that old $84 mark.
A cautionary sign is seen in the RSI momentum gauge at the top of the chart, however. It’s printing lower highs as the stock hovers at all-time highs. I would like to see improved RSI to confirm the upward price thrust. Another concern the bulls should have is the price gap around $89 from a month ago. Thus, a pullback to the 50dma and that gap could easily take place without the broader trend breaking.
Overall, KKR’s chart is powerful from the bulls’ perspective despite two near-term signs of caution.
Stockcharts.com
I reiterate my buy rating on KKR. The valuation has improved significantly from my assessment last October and share-price momentum has been superb.