
pcess609
pcess609
The iShares Russell 2000 ETF (NYSEARCA:IWM) tracks a basket of the largest 2000 small-cap US stocks. Small-cap stocks are typically riskier than their large-cap and mega-cap peers in the S&P 500, since they typically have less cash to deploy in times of need, are more sensitive to economic cycles, and have a significantly higher rate of failure due to their smaller nature.
They also come with great reward for getting in early.
Here are the index's top holdings and their performance over the last few years so you can see what kind of risk and reward scenarios you're looking at with small caps. When they win, they win big.
Watch for periwinkle colored line, that's the S&P 500.
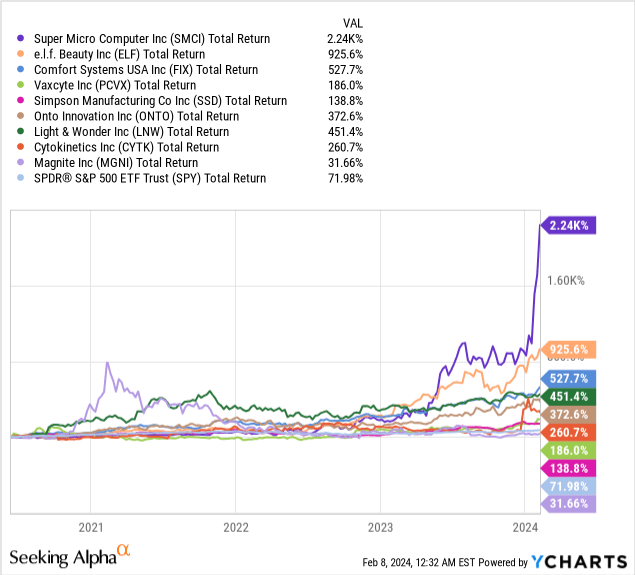
The ETF itself has done well over its lifetime but suffers from quite a bit of volatility.
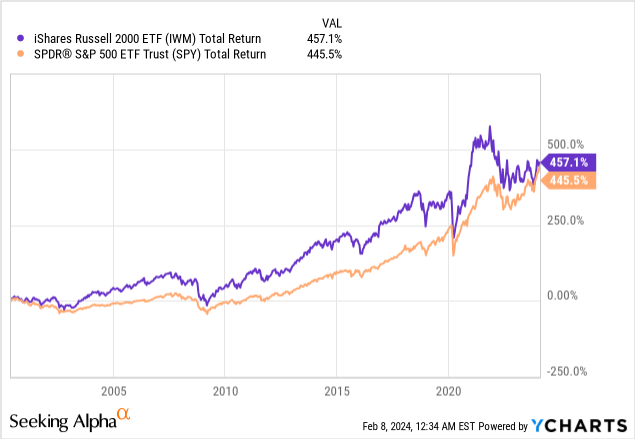
The performance you see in the top holdings is only part of the picture. The ETF holds 1,968 stocks, and most of them are absolute garbage. You have to hope that the winners offset the losers; sometimes they do, and sometimes they don't. You can see that pattern in the erratic price movements of the index compared to the S&P 500, shown above.
High interest rates do not favor small caps, and significant damage was done to the index over 2022 when the Fed raised rates at a rapid pace.
This has led to the question, when is the time to get in to ride the train back up now that the Fed has signaled we are peak rates?
If you want to know my thoughts on 'peak rates,' I wrote about it after the December Fed meeting; you can read it here. It is still relevant today since the Fed did not change rates at the January meeting last month.
While the S&P 500 has hit a new high recently, the Russell 2000 has yet to reclaim its November 2021 high. There is still room to return to previous valuations, let alone push even higher.
Let's see what the technicals say. Is it time to buy, or should investors hold out?
For reference, I will be standardizing the candles I use to 30m and will be looking at most indicators in a 30-day window when I show charts.
Momentum is strong, and one of the factors that is fueling my bull thesis on IWM. All the moving averages are positive (something we will revisit later), giving us a clear picture of IWM's consistent positive momentum.
Figure 1 (Barchart)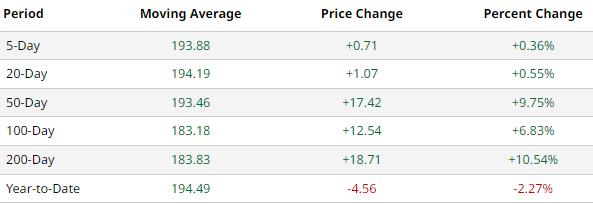
Seeking Alpha's Quant system sees a red flag in the recent momentum and has given IWM a D+, however. One hopeful aspect is to see that the grades have been slowly trending up, with the 1yr, 6mo, and 3mo grades rising linearly. That still doesn't change the fact that the overall grade is incredibly unfavorable.
Figure 2 (Seeking Alpha)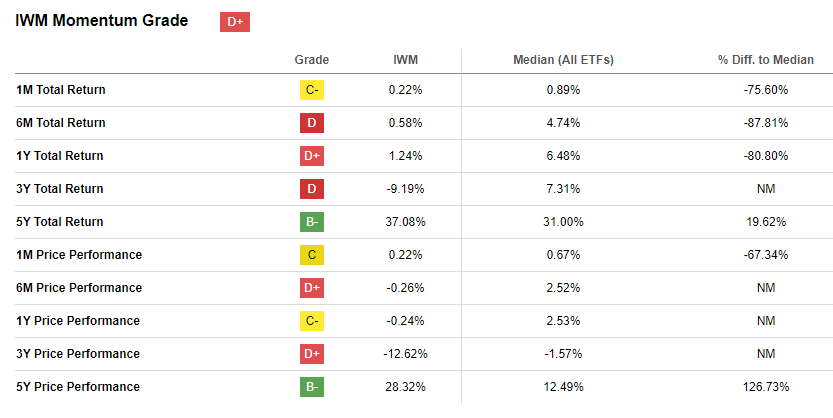
SA Quant's weighting system behind grades is proprietary, so I don't really know how they arrived at this conclusion other than the price and total return figures shown above. Take this with a grain of salt only because I can't explain what's going on under the hood.
TradingView gives us a larger sample of moving averages to watch. We see a surprising amount of buy indicators given the previous two charts. IWM passes 13/15, with one neutral and one sell indicator.
Figure 3 (TradingView)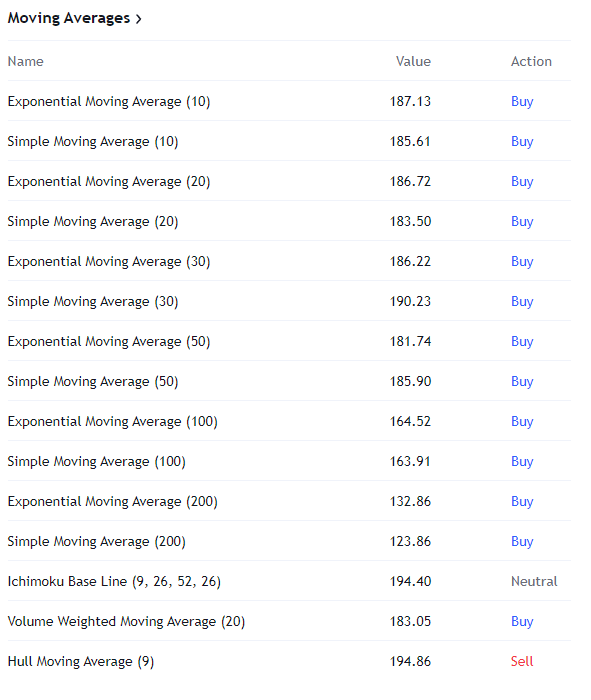
Factoring in moving averages to our previous picture of momentum paints a very mixed image of IWM, but we may be able to overlook the negatives here (and the paltry D+ from SA Quant) if other indicators give a more favorable outlook.
Oscillating technicals are measurements of cyclical patterns of investor behavior and are used to establish trends. They can give us a picture of the relative strength of IWM's momentum. Having good momentum is only helpful if it looks like you can keep it up.
Keep in mind here that these terms are very relative, with "short term" being accompanied by the 20-day average volume and "long term" with the 100-day average.
Figure 3 (Barchart)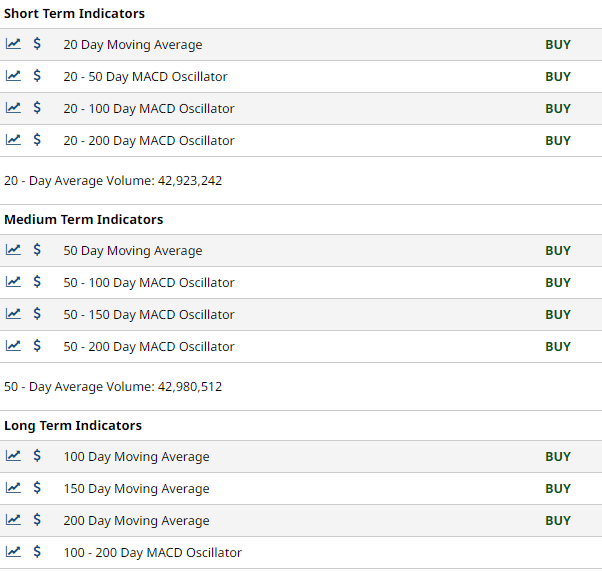
I only evaluate my holdings quarter to quarter and would not recommend holding for less than that based on these indicators. The only indicator that does not give a clear buy signal is the 100–200 day MACD. Currently, that indicator is giving a sell signal.
While there isn't a unanimous buy signal, the overwhelming majority of these indicators are in positive territory and are showing that IWM is likely to continue its positive momentum.
Other oscillating indicators do not show as favorable a view of IWM, mostly presenting as neutral. There are currently no sell indicators, with the most recent rally pulling up the previous sell signal on the Ultimate Oscillator (7, 14, 28) to neutral as well.
Figure 4 (TradingView)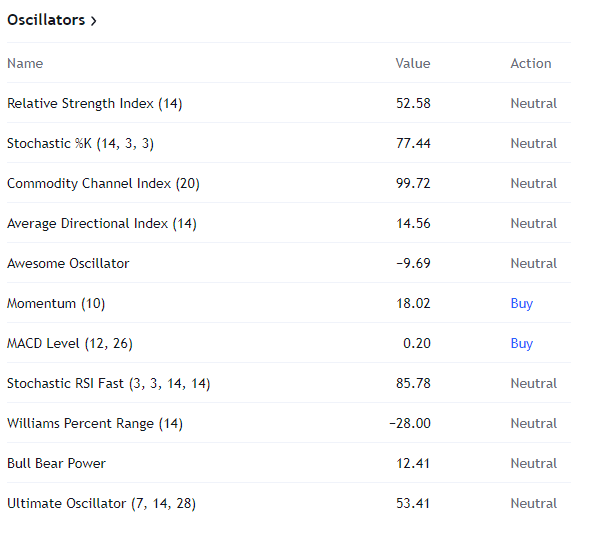
The short-term Momentum (10) and MACD (12, 26) are giving buy signals, meaning that now is likely a valuable time to get in on this trade, as momentum is likely to carry IWM higher in the coming days without a catalyst.
Since IWM is approaching a resistance level, short term momentum will be important to break through.
It's critical that we get to this part last, as we needed the previous two sections to set up the full thesis.
Positive momentum, shown by the consistently positive moving averages, coupled with short-term positive momentum, shown by the oscillating indicators, gives IWM a chance to break out of its next resistance point.
Figure 5 (Barchart)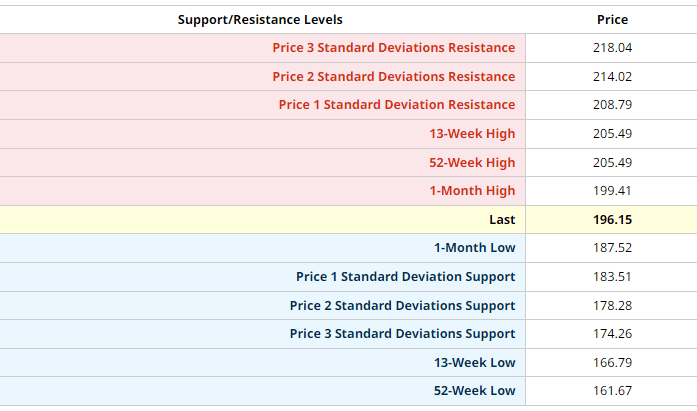
On the downside, only the 1-month low is above all three standard deviations, as the prospect of falling to a new 13-week or 52-week low would require the breakdown of several technical barriers that are unlikely to be broken through without an outside catalyst.
The 1st SD resistance sits 6.24% above IWM's current price.
The 1st SD support sits 6.66% below IWM's current price.
This is the major risk in the trade, is that while the indicators point to the positive side of the trade being the most likely scenario to play out in the coming month, the risk/reward is very slightly asymmetrical to the downside.
This is not enough risk for me to walk away from the trade but is important to note.
IWM's technicals present it as a buy and offer a good set-up for investors to reach new price milestones on the upside before encountering major resistance.
Until the next quarter, I intend to take a position in IWM. I will re-evaluate at that point if it is prudent to continue to overweight them.
For the moderately aggressive investor willing to take on small-cap risk with this ETF, I recommend limiting exposure to 10% or less of total equity exposure.
The key indicator that could change my thesis:
I will be watching this position closely and intend to re-evaluate next quarter.
Thanks for reading.