
RoJDesign
RoJDesign
This article series aims at evaluating ETFs (exchange-traded funds) regarding past performance and portfolio metrics. Reviews with updated data are posted when necessary.
Vanguard Mid-Cap Growth Index Fund ETF (NYSEARCA:VOT) started investing operations on 08/17/2006 and tracks the CRSP US Mid Cap Growth Index. It has 150 holdings, a dividend yield of 0.75%, and an expense ratio of 0.07%. The same portfolio is available as a mutual fund (VMGMX).
As described by Vanguard, the underlying index "is designed to accurately represent the mid-cap growth segment of the U.S. equity market and deliver low turnover." According to CRSP (Center for Research in Security Prices, an affiliate of the University of Chicago), "CRSP Market Indexes are based on a proprietary methodology using publicly-available market data". CRSP growth indexes represent "70% to 85% of cumulative capitalization of CRSP US Total Market". No more details are publicly provided about the methodology. The fund's turnover rate in the most recent fiscal year was 22%. This article will use as a benchmark the parent index CRSP US Mid Cap Index, represented by Vanguard Mid Cap ETF (VO).
The heaviest sector in the portfolio is technology (24.7% of asset value), followed by industrials (20.4%), consumer discretionary (13.1%) and healthcare (11.4%). Other sectors are below 8%. Compared to the parent index, VOT mostly overweights technology and communication. It underweights financials, consumer staples, materials and utilities.
VOT sector breakdown (Chart: author; data: Vanguard)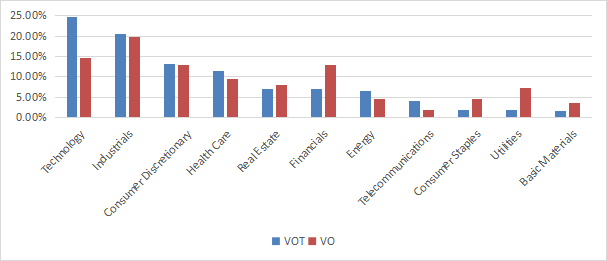
The top 10 holdings, listed in the next table with growth metrics, represent 16.3% of asset value and the top name weighs about 2%. Therefore, the portfolio is well-diversified and risks related to individual companies are very low.
Ticker | Name | Weight % | EPS growth % TTM | EPS growth % 5Y | Sales Growth % TTM | Sales Growth % 5Y |
Arista Networks, Inc. | 2.02% | 53.80 | 45.36 | 33.75 | 22.19 | |
Amphenol Corp. | 1.89% | 1.38 | 10.05 | -0.54 | 8.89 | |
TransDigm Group Inc. | 1.80% | 59.28 | 6.17 | 23.87 | 11.56 | |
Motorola Solutions, Inc. | 1.66% | 25.25 | 12.07 | 9.52 | 6.32 | |
Cintas Corp. | 1.64% | 12.19 | 13.11 | 9.76 | 6.36 | |
Welltower Inc. | 1.51% | 89.47 | -10.51 | 13.30 | 7.13 | |
DexCom, Inc. | 1.47% | 60.29 | 41.21 | 24.49 | 28.56 | |
Microchip Technology Inc. | 1.44% | 15.63 | 50.79 | 6.10 | 16.21 | |
Realty Income Corp. | 1.42% | -11.25 | -0.02 | 22.63 | 25.27 | |
MSCI Inc. | 1.41% | 34.32 | 20.50 | 12.47 | 12.02 |
As expected from a growth fund, VOT is significantly more expensive than the benchmark regarding valuation ratios and has better growth metrics (reported in the next table).
VOT | VO | |
P/E TTM | 26.36 | 20.28 |
Price/Book | 5.08 | 2.87 |
Price/Sales | 4.28 | 1.76 |
Price/Cash Flow | 19.23 | 13.34 |
Earnings growth | 18.48% | 13.02% |
Sales growth % | 13.65% | 8.11% |
Cash flow growth % | 16.48% | 12.86% |
Data source: Fidelity
In my ETF reviews, risky stocks are companies with at least 2 red flags among bad Piotroski score, negative ROA, unsustainable payout ratio, bad or dubious Altman Z-score, excluding financials and real estate where these metrics are unreliable. With this assumption, risky stocks weigh 17.7% of asset value, which is not good. However, according to my calculation of aggregate quality metrics (reported in the next table), portfolio quality is significantly superior to the mid-cap benchmark.
VOT | VO | |
Altman Z-score | 7.98 | 5.00 |
Piotroski F-score | 6.18 | 5.89 |
ROA % TTM | 8.42 | 6.44 |
Since 9/1/2006 VOT has slightly outperformed its parent index. However, the gap in annualized return is hardly significant: only 37 bps. Risk metrics (maximum drawdown and volatility in the next table) are a bit higher and result in an identical risk-adjusted performance (Sharpe ratio).
Total Return | Annual Return | Drawdown | Sharpe ratio | Volatility | |
VOT | 399.70% | 9.61% | -60.17% | 0.51 | 19.00% |
VO | 370.26% | 9.24% | -58.88% | 0.51 | 18.21% |
The growth fund has outperformed by 4.3% over the last 12 months:
VOT vs VO, last 12 months (Seeking Alpha)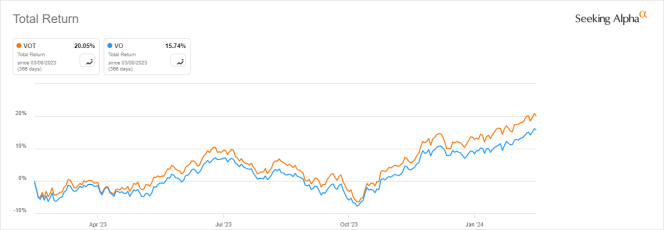
The next table compares characteristics of VOT and five mid-cap growth ETFs implementing different methodologies:
VOT | IJK | IMCG | NUMG | JSMD | FNY | |
Inception | 8/17/2006 | 7/24/2000 | 6/28/2004 | 12/13/2016 | 2/23/2016 | 4/19/2011 |
Expense Ratio | 0.07% | 0.17% | 0.06% | 0.31% | 0.30% | 0.70% |
AUM | $24.16B | $9.07B | $2.13B | $395.48M | $342.58M | $324.74M |
Avg Daily Volume | $40.57M | $32.35M | $13.77M | $1.51M | $1.29M | $1.04M |
Holdings | 153 | 250 | 310 | 59 | 257 | 226 |
Top 10 | 16.28% | 14.74% | 11.39% | 27.93% | 27.45% | 9.85% |
Turnover | 22.00% | 54.00% | 43.00% | 100.00% | 91.00% | 142.00% |
VOT is the largest of these funds (measured in assets under management) and the most liquid in dollar volume. It has one of the two cheapest fees (IMCG is marginally better on this point).
The next chart compares total returns, starting on 12/15/2016 to match all inception dates. VOT performance is average among competitors. IMCG is ahead of the competition.
VOT vs competitors, since 12/15/2016 (Seeking Alpha)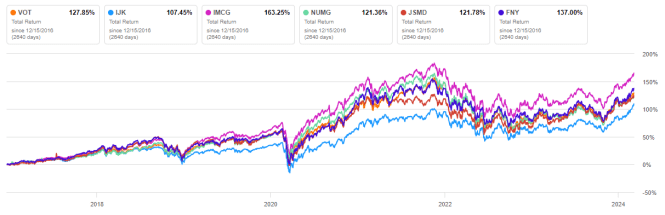
VOT has also been in the middle of the pack over the last 12 months:
VOT vs competitors, 12-month return (Seeking Alpha)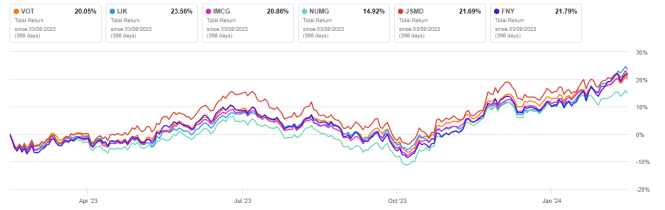
Vanguard Mid-Cap Growth Index Fund ETF has 150 holdings and tracks the CRSP US Mid Cap Growth Index. Technology is the heaviest sector in the portfolio, but it is not overweight like in large-cap growth funds. VOT is well diversified across sectors and holdings. Quality metrics and total return are superior to the parent index. However, VOT performance is average among other mid-cap growth funds. iShares Morningstar Mid-Cap Growth ETF (IMCG) is significantly ahead over an 8-year evaluation period, also charges a low fee, and is even better regarding diversification.