
NicoElNino
NicoElNino
Over the last ten years, the Schwab U.S. Large-Cap Growth ETF (NYSEARCA:SCHG) was the third-best-performing fund in its category, trailing only the Invesco QQQ ETF (QQQ) and the iShares Russell Top 200 Growth ETF (IWY). SCHG also ranked #4/37 over the last three calendar years and #4/36 over the previous five, so based on past performance, there's no argument. SCHG has delivered exceptional returns.
Still, I want to ensure your due diligence continues beyond simple performance charts. A closer look at SCHG reveals it delivered average or below returns 50% of the time over the last decade. Its valuation is also high, over 50% is tied up in Magnificent Seven stocks, and recent earnings surprise statistics might not support the price action SCHG experienced since 2023. Therefore, while SCHG is fundamentally strong relative to its peers, I hope to take ten minutes of your time to explain why overweighting large-cap growth stocks may not be your most prudent decision. I hope you enjoy the analysis.
SCHG tracks the Dow Jones U.S. Large-Cap Growth Total Stock Market Index. The Index is float-adjusted market-cap-weighted, with selections based on growth and value factors, including:
The Index reconstitutes annually in September, meaning SCHG's holdings today differ from when I last reviewed it alongside the Schwab U.S. Dividend Equity ETF (SCHD) in June 2023. In that analysis, I examined the benefits of pairing the two ETFs and specifically noted how the low overlap indicated an efficient combination.
SCHG has an excellent track record, outperforming other low-cost large-cap growth ETFs like the Vanguard Growth ETF (VUG) and the SPDR S&P 500 Growth ETF (SPYG) by 0.50% and 0.94% per year since January 2010. Remarkably, it gained 50.11% in 2023, its best year on record.
Portfolio Visualizer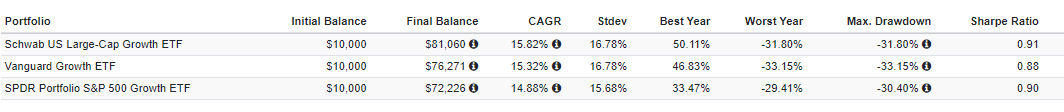
However, this chart also provides clues to some holes in SCHG's track record. You might be wondering why SCHG has only beaten SPYG by 0.94% per year since 2010 but had a "best year" return that was 17% better. The reason is that there were several years where it performed below average, and that's what I want to caution readers about. Rather than relying on 3Y, 5Y, and 10Y performance charts, consider how consistent SCHG's returns have been over the last decade. I found 19 large-cap growth ETFs with that history, and although SCHG ranks #3 on ten-year returns, it also ranked #10/19 or lower 50% of the time.
The Sunday Investor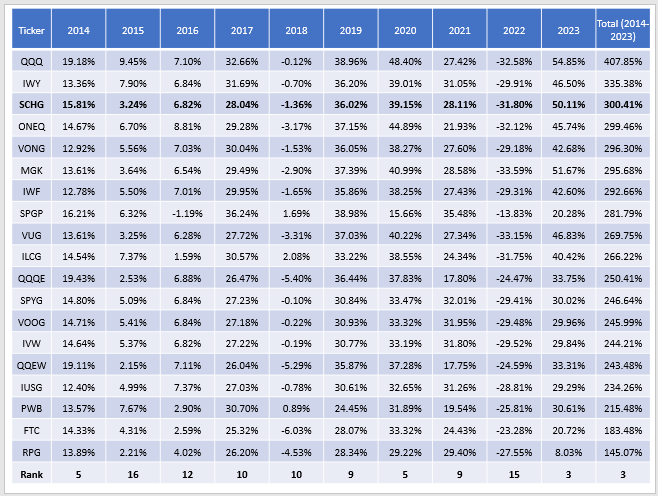
To be sure, the results are still stellar, but it begs the question if investors should aim for ETFs with more consistent annual returns. QQQ obviously comes to mind, but so does IWY, the Fidelity Nasdaq Composite ETF (ONEQ), and the Vanguard Russell 1000 Growth ETF (VONG). These ETFs all have better average annual rankings than SCHG from 2014 to 2023, and in the case of QQQ and IWY, total performance was also better. Consider these average rankings for these 19 ETFs ordered from best to worst:
Author's Note: I've excluded SPGP from this analysis because its Index changed in 2019 and it doesn't provide consistent exposure to growth stocks.
Based on these results related to returns and consistency, let's compare SCHG with QQQ, IWY, ONEQ, and VONG to see which one looks best fundamentally.
First, let's examine sector exposure differences. All ETFs have reasonably similar exposures to Technology, ranging from 44-50%. However, SCHG differentiates itself by overweighting Financials and Health Care and underweighting Consumer Staples.
Morningstar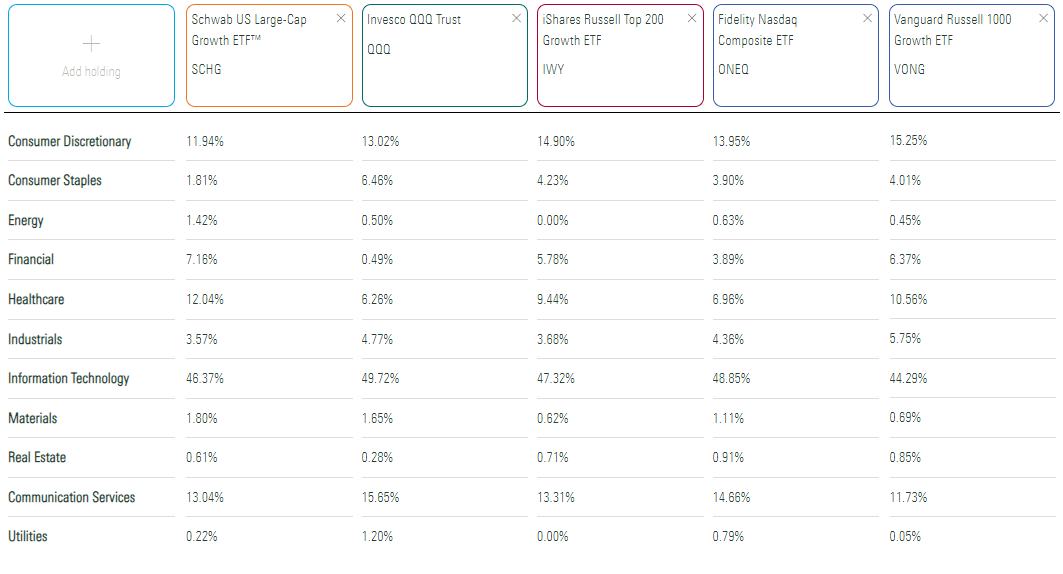
Neither is well-diversified at the sector level, and that's one common theme for most large-cap growth ETFs. One way to evaluate diversification is to compare the sector exposures against a perfectly diversified (i.e., equal weight by sector) ETF and plot the result on a scale from 1-10. I'm happy to explain the calculation to anyone interested in the comments section, but here are the results for the five ETFs, showing SCHG's score is second-best.
Therefore, while I'm not too pleased with SCHG's diversification, there aren't many better choices. Most large-cap growth ETFs are overweight the Magnificent Seven stocks, and these five are no different. Here's a quick cash-adjusted sector snapshot for SCHG, which includes the top three holdings in each sector, where applicable. The Total Magnificent Seven (MSFT, AAPL, NVDA, AMZN, GOOGL, META, TSLA) is 51.19%.
The Sunday Investor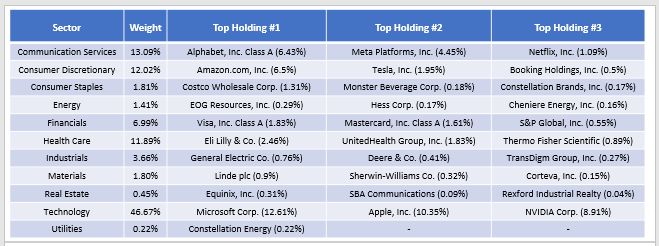
The next table highlights selected fundamental metrics for SCHG's top 25 holdings, which total 72.92% of the portfolio. This concentration level is higher than that of QQQ, ONEQ, and VONG but lower than that of IWY, which has 55.37% allocated to the Magnificent Seven stocks.
The Sunday Investor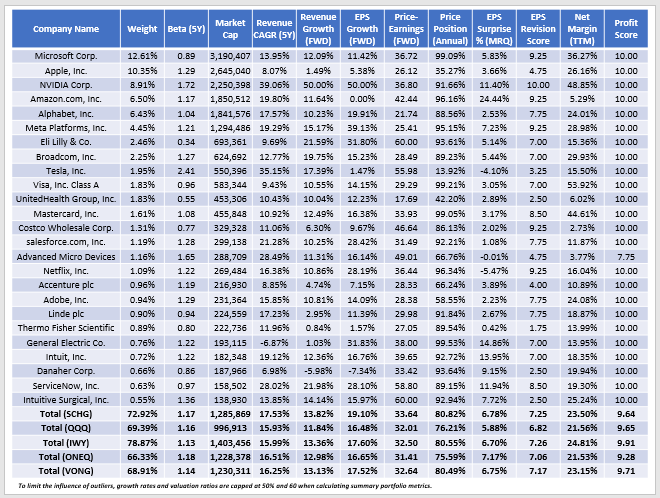
Here are five takeaways to consider:
1. SCHG's five-year beta is 1.17, which is about average for the group. The weighted average beta for the Magnificent Seven stocks is 1.26, so if it isn't already evident, SCHG investors should have a relatively high tolerance for risk. That said, this likely is fine for investors with multiple ETF holdings, especially if they've managed to allocate their capital efficiently. For example, SCHG has only 0.83% overlap with SCHD, as follows:
Since SCHD has a 0.91 five-year beta, an equal-weight pairing of the two nets out to a 1.04 five-year beta, putting it right on par with the SPDR S&P 500 ETF (SPY). It's a simple workaround you can do to gain some control over your growth and value factor exposure, and the benefit of this approach is that quality remains high. SCHG and SCHD have 9.64/10 and 9.38/10 profit scores, which I derived using Seeking Alpha Factor Grades. For the same reason, I also don't think owning more than one of these ETFs is beneficial.
2. SCHG's Index incorporates historical and forward-looking growth and value metrics, which is a reasonable approach. Based on its weighted-average sales and earnings per share growth rates, SCHG emphasizes the growth factor better than any of these four peers. As further evidence, Seeking Alpha provides "Growth Grades" for nearly every U.S. company, and after converting those grades to numbers and weighting them, SCHG comes out on top.
3. There's no question that SCHG is one of the better large-cap growth ETFs on the market. Instead, the only question is how much you will pay for that growth. SCHG consistently trades at a higher forward P/E than nearly all its peers in the large-cap growth category. Today, it trades at 33.64x forward earnings using the simple weighted-average method or 29.50x using the harmonic weighted-average method, which you'll find on Morningstar.
From a GARP perspective, that valuation is justfied. When we divide each ETF's estimated earnings per share growth into its forward P/E (simple weighted average), SCHG's PEG ratio is the lowest:
Still, there are some caveats I want to note:
Seeking Alpha
These caps are rarely required for large-cap value ETFs. For example, SCHD holds no securities with EPS growth rates above 50% or P/E ratios above 60, so in that sense, fundamental analysis is more reliable.
4. Many of SCHG's holdings are trading near their 52-week highs. To illustrate, consider the 80.82% "Price Position" statistic presented in the earlier summary table, calculated as follows:
[Current Price - 52W Low Price] / [52W High Price-52W Low Price]
Compensation analysts call this statistic "range penetration" when calculating an employee's salary compared to their respective salary bands' minimum and maximum. Applying the same logic to stocks, we can see that all Magnificent Seven stocks except Apple and Tesla are trading close to their 52-week high prices. This also substantially impacts SPY, as its price position is nearly as high at 79.26%, but surprisingly, the risk is a bit lower with QQQ, as its price position is 76.21%. Given its strong track record, it's a solid alternative.
Still, all large-cap growth ETF investors are in a difficult position. I first reviewed SCHG on December 20, 2021, when its price was above 80%. SCHG declined by 31.80% the following year, so while it's nearly impossible to predict market declines, managing risk and ensuring you're not overextending on any single factor (i.e., growth) is prudent.
5. Finally, SCHG has an excellent 7.25/10 EPS Revision Score, indicating Wall Street analysts are bullish on its constituents. However, its weighted average 6.78% earnings surprise last quarter is inconsistent with a strong bull market. In fact, it's only average when looking back over the previous ten years. Consider that S&P 500 Index earnings surprises were 15-20% or more in the 2009 and 2020 bull markets, and a consistent downward trend in this figure coincided nicely with the 2022 market downturn. Again, the timing is nearly impossible, but it's a reminder investors should consider risk management.
SCHG's growth features are excellent and rival nearly every other large-cap growth ETF on the market. While I have reliability concerns about the earnings estimates posted for several Magnificent Seven stocks, I have the same concerns for SCHG's competitors, including QQQ, IWY, ONEQ, and VONG. In short, if you want growth, you'll have to pay for it, and based on the PEG ratios I calculated, SCHG does this well. Still, I have three concerns:
1. SCHG has performed average or below 50% of the time over the last ten years. QQQ and IWY delivered higher and more consistent returns, and depending on whether you want more or less exposure to Magnificent Seven stocks, they are reasonable alternatives.
2. Large-cap growth stocks are trading close to their 52-week high prices, and the last time this happened, high P/E stocks like those in SCHG subsequently declined the most. SCHG ranked #15/19 in 2022.
3. Given SCHG's recent strong performance, earnings surprises are weaker than I would expect. While far from disastrous, growth stocks are sensitive to earnings reports. If earnings surprises trend downward close to 1-2%, like in 2021-2022, or even turn negative, like in 2008-2009, SCHG's high P/E will become the focus rather than its 19.10% earnings growth rate.
You can mitigate these concerns by diversifying. Understanding the factors that drive an ETF's returns is essential, and knowing how well SCHG pairs with large-cap value funds like SCHD is a big plus from an efficiency perspective. However, while SCHG's fundamentals look relatively strong, and the alternatives are not necessarily better, short-term headwinds exist for large-cap growth stocks. Hence, the most appropriate rating today is a "hold." Thank you for reading, and I look forward to answering your questions in the comments section below.