
pavlen
pavlen
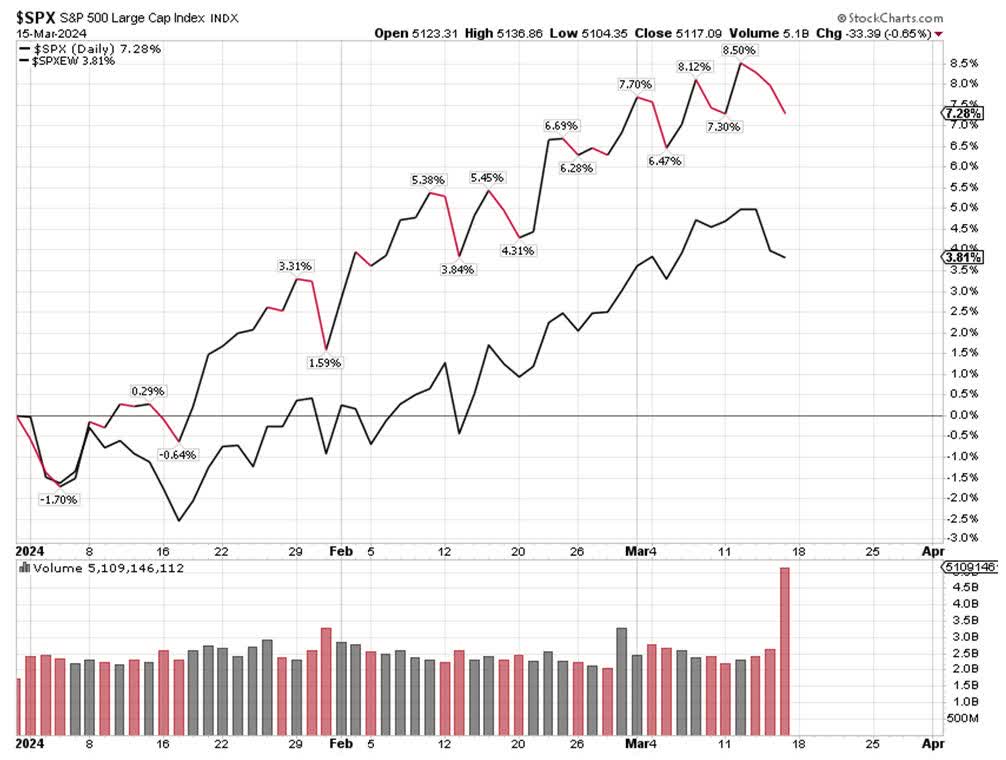
When I included the chart below a mere three weeks ago, the year-to-date performance numbers for the S&P 500 Equal Weight index and the S&P 500 market cap-based index were 2.48% and 6.69%, respectively, a difference of 4.21%.
As of last Friday (below), those numbers are 3.81% and 7.28%, for a difference of 3.57%. While this does not look like a big move, it really is, since it involves trillions of dollars. Basically, it tells us that money has flown out of the tech sector and into the broad market.
Graphs are for illustrative and discussion purposes only. Please read important disclosures at the end of this commentary.
In and of itself, that rotation is a net positive, but because the concentration of trillion-dollar market caps in the tech sector is experiencing outflows, it may cause a bit bigger correction compared to anything we have seen since the rally started in late October.
The S&P 500 has been down marginally two weeks in a row, but because the moves are small, it still managed to register a fresh all-time high on a closing basis last week. In a weird way, we had an all-time high on a daily closing basis on Tuesday in a down week.
How big can a correction be? History gives us some clues.
A 3% to 5% correction can come at any time. Years ago, 10% was considered a normal correction, but today, 10% is considered huge. Still, we experienced a 10% drop from July 31 to October 27 last year.
We may not get a meaningful selloff this spring, as seasonal patterns tend to be strong March to late May, even though the selling into strength of the tech sector suggests some type of pullback may have started.
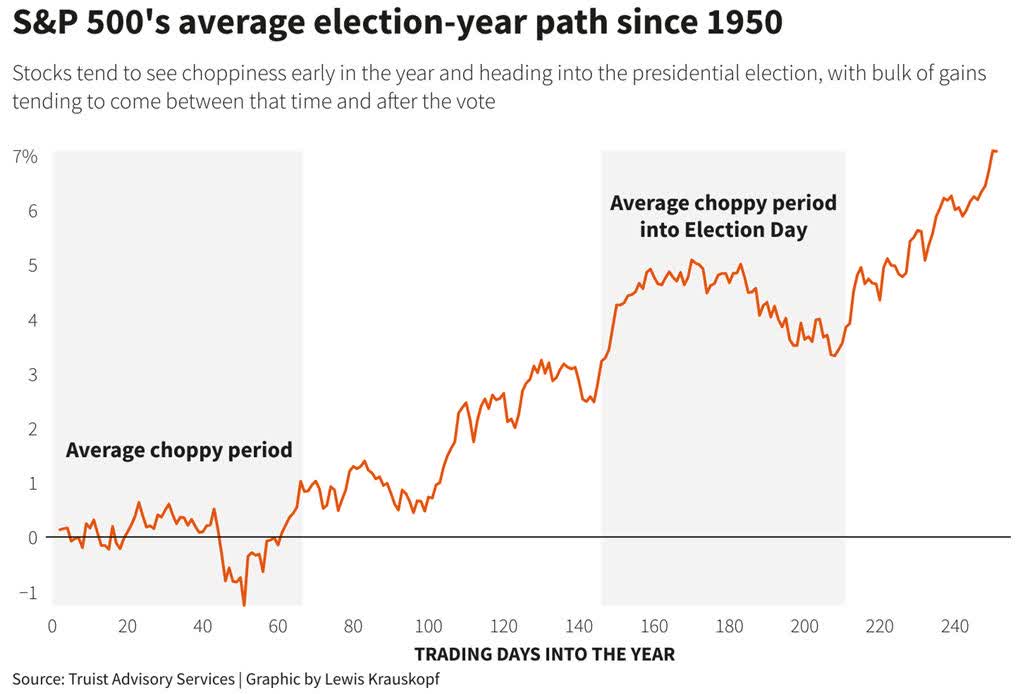
Presidential election years on average tend to be good for the stock market. Since 1950, on average, these presidential election years have tended to see some choppiness in the first two months, which we did not see this year.
Historically, election years see the market rallying mid-year and after the election, but history is only a guide and this presidential election year, so far, is doing better than average.
Graphs are for illustrative and discussion purposes only. Please read important disclosures at the end of this commentary.
However big the correction this year may be – or if there is a correction at all – keep in mind that Jerome Powell can cause volatility this week, as he is due to deliver one of his famous FOMC press conferences tomorrow, and he is known for rocking the markets. There is a lot he can say to swing stocks either way.
For starters, we have seen hotter numbers on both the CPI and PPI, and yet the stock market still managed to recover.
I do believe that because companies tend to raise prices in January for the year that tends to inflate inflation readings for the month, so the overall trend of declining inflation is probably still intact.
If inflation begins declining again, the Fed will likely start cutting interest rates. The closer to the election the Fed starts cutting rates; the more political it will appear.
I think the Fed will end up cutting a minimum of three times before the election, which both the stock and bond market should like, but I am waiting to hear, with great interest, what Jerome will say on Wednesday, as he has been oscillating between dovish and hawkish comments way too many times for this point of the interest rate cycle.
Disclaimer: Please click here for important disclosures located in the "About" section of the Navellier & Associates profile that accompany this article.
Disclosure: *Navellier may hold securities in one or more investment strategies offered to its clients.
Editor's Note: The summary bullets for this article were chosen by Seeking Alpha editors.