Bim
Bim
In 2010, the US automaking industry saw a 26-year low in car sales. Despite the near three decades of dismal growth, hybrid and electric vehicles offered a silver lining, the hope of growth in an ex-growth industry. The company that captured the zeitgeist of this hope IPO’d in 2010, Tesla (TSLA). Just over a decade later, TSLA enjoyed a richer valuation than the top-ten global automakers combined despite having a mere fraction of their deliveries.
Wolfstreet Wolfstreet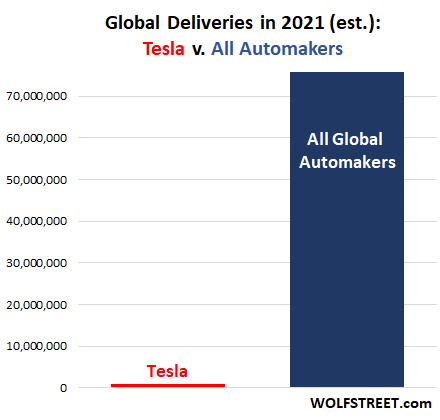
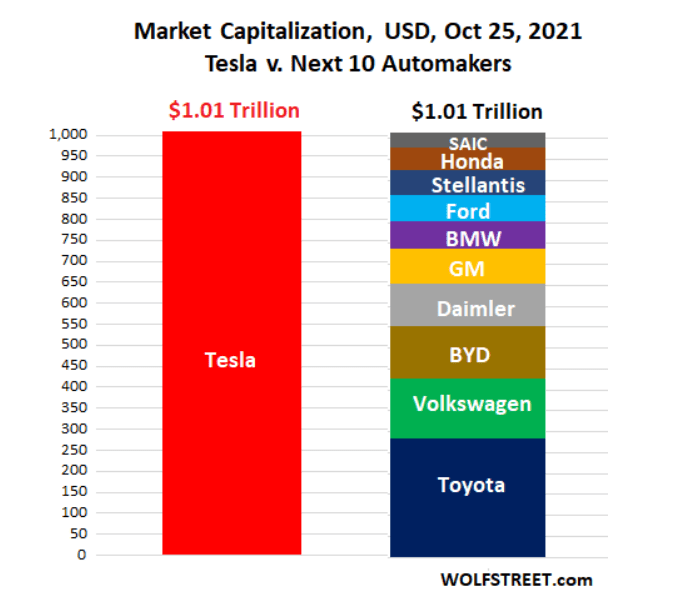
This example demonstrates that when a low to negative growth industry begins to see a pocket of growth once more, the company that centers itself around that growth can enjoy significant margin and multiple expansion.
A similar story is developing in the oil refining industry. Many view the downstream oil refining industry in the US as a sunset industry and the revenue numbers back them up. Industry revenues dropped at a 6.3% CAGR from 2018 – 2023 and are expected to continue declining over the next five years at a 0.1% CAGR. This zero to negative industry growth explains why independent, pure play oil refiners like PBF Energy can have such recently low P/E (2.24) and EV/EBITDA (2.3) ratios. Oil refining is considered to be the opposite of a growth industry and thus deserving of heavily discounted multiples. Granted, crack spreads have been historically high the last few years and have inflated the typical earning power of refiners, but even valued at mid-cycle earnings oil refiners appear cheap.
But a pocket of growth is emerging within the sleepy industry, renewable fuels. Not all renewable fuels however, renewable diesel (RD) and sustainable aviation fuel (SAF) specifically. RD consumption in the US went from 1B gallons to 28B gallons in the years 2011 – 2021, a 139% CAGR.
US Energy Information Administration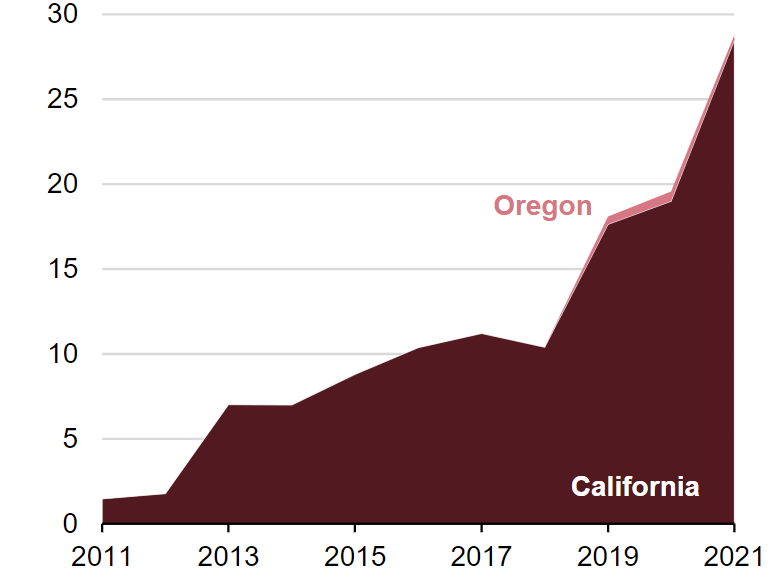
And the pace has not slowed since 2021. In fact, 2023 was a near record setting year for RD imports as domestic demand outstripped domestic supply by 362M gallons.
Biobased Diesel Daily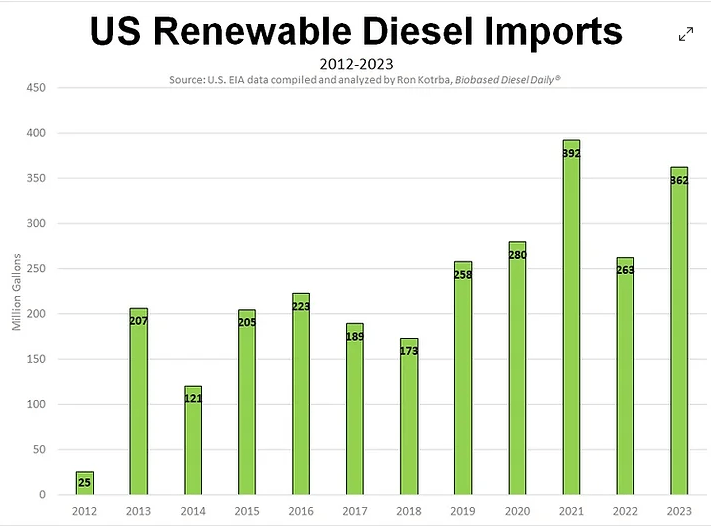
In addition to RD growth, SAF is estimated to grow globally at a 47.7% CAGR over the next seven years with North America and Europe enjoying the bulk of that growth. Why North America and Europe? Both governments are intent on reducing greenhouse gas (GHG) emissions and view the escalating production of SAF as essential to that mission.
Markets and Markets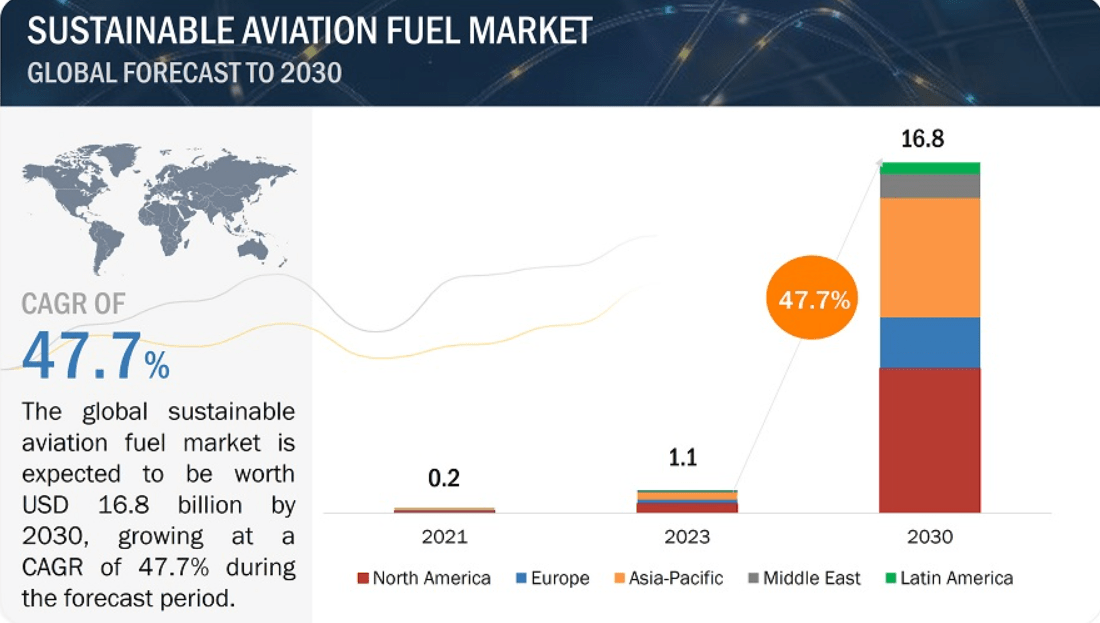
In the US, transportation accounts for approximately 29% of greenhouse gas emissions (GHG). Of that 29%, commercial planes and business jets make up 10% of it. To lower the GHG emissions produced by aviation, the Biden Administration introduced the SAF Grand Challenge in 2021. The Grand Challenge plans to increase SAF production from a mere 15.8M gallons in 2022 to 3B by 2030 and 35B by 2050.
J Bull from data from the US Dept of Energy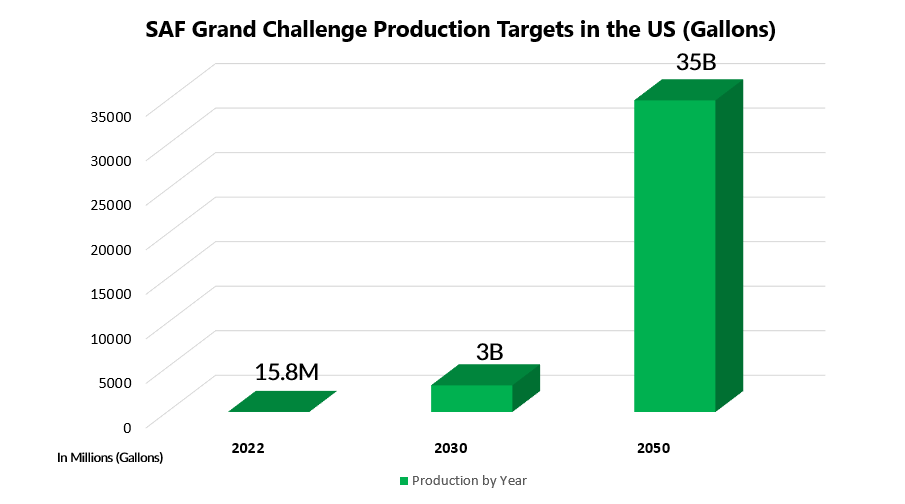
Europe has mandated a similar trajectory with their RefuelEU bill introduced in 2021 and confirmed in 2023 which seeks to replace petroleum based jet fuel with an increasing percentage of SAF ever year, reaching 70% replacement by 2050.
CAPA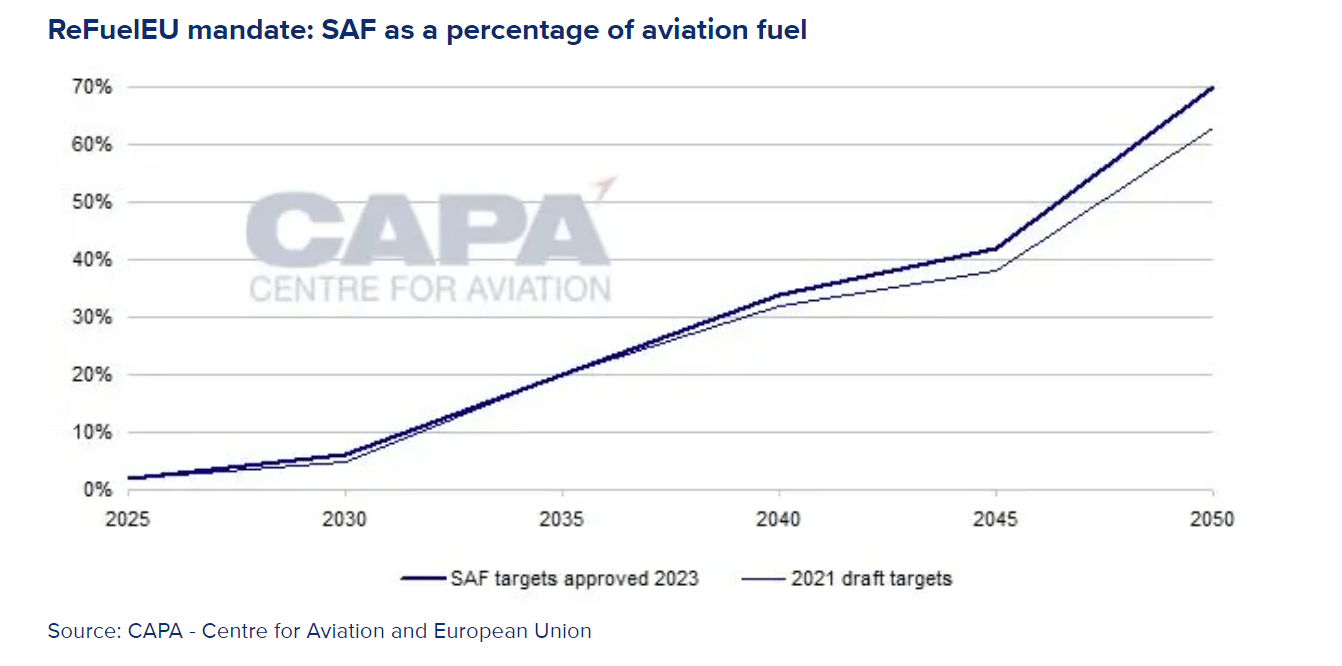
Both governments are putting their money where their mouth is. In the US, credits initiated by the Energy Policy Act of 2005 then expanded by the Energy Security and Independence Act of 2007 and the Inflation Reduction Act of 2022 have all but guaranteed healthy margins on the production of these two fuels for producers going forward. RD receives up to a $1.00 credit per gallon and SAF receives up to a $1.75 credit per gallon produced. While these credits are currently set to expire in 2027, they’ve been renewed in the past and will likely be renewed again, especially given the hope of increased production beyond 2027. Government accountability groups have demonstrated that long term policy uncertainty increases the price and stunts the growth of production over time which makes calls for longer policy certainty likely to be answered. Below is a diagram of relevant renewable fuel credits in play in the US.
J. Bull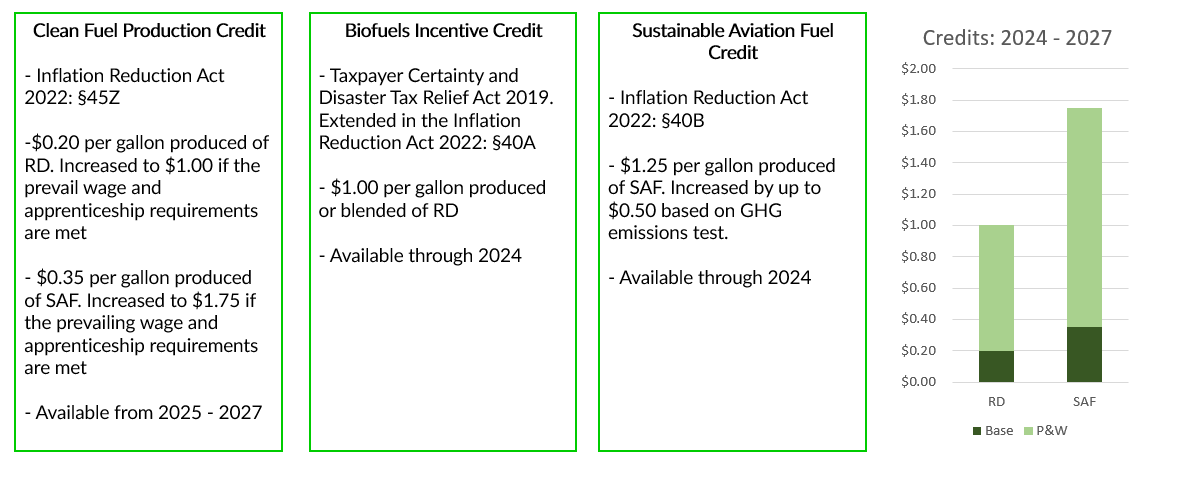
Based on the growth trajectories of these two renewable fuels (RD and SAF), pockets of the refining industry may exhibit tremendous growth for decades to come. The first movers (oil refiners who have converted their petroleum refineries to RD and SAF refineries) will likely enjoy margin and multiple expansion. Since 2021, Calumet Specialty Products (NASDAQ:CLMT) has proven itself to be such a company.
CLMT owns four of the 128 oil refineries still operating in the US. Their refineries are small. In sum, Calumet owns a mere 0.56% of the total refining capacity in the US, 1/10th the domestic capacity of Chevron and 1/20th the domestic capacity of Valero.
US Energy Information Administration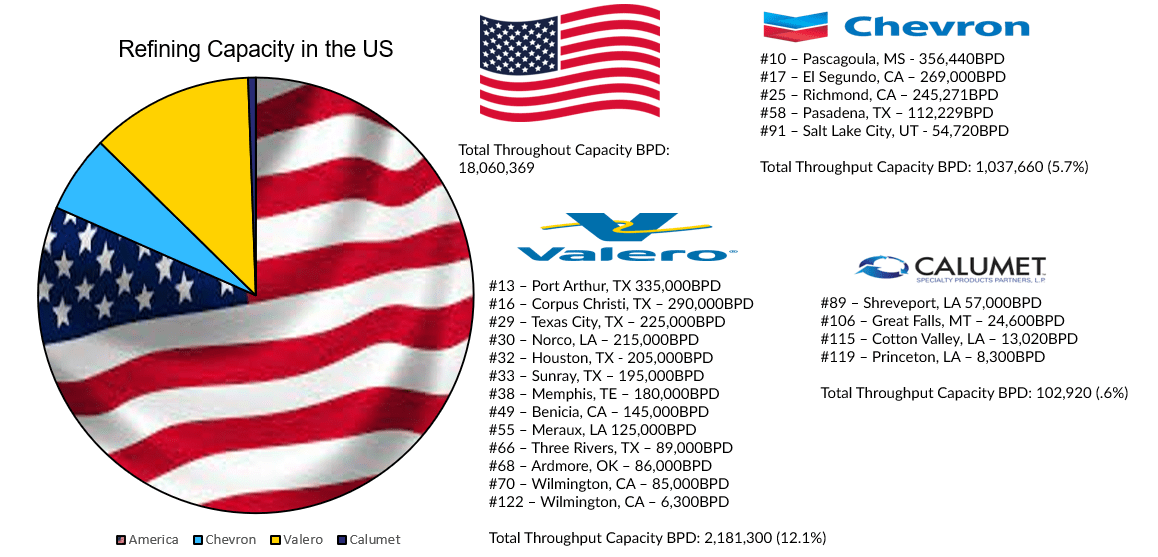
This size, or lack thereof, should be a problem for Calumet. Why? As a refiner, the majority of their revenue goes towards input costs, mainly petroleum feedstock. They neither own their own upstream producer nor have the size to buy crude in bulk. Thus, they have limited bargaining power with their suppliers. The most influential item to their profit margin (cost of crude oil) is higher than their larger competitors which should make them uncompetitive in the commoditized world of refined petroleum products. How has Calumet survived? They have focused on specialty products.
Traditional petroleum products like gasoline and heating oil are commodities and thus offer low margin and high competition. The four main specialty products Calumet offers are: lubricating oils, waxes, solvents, and petroleum packaged products. Different engines or mechanical components require specific lubrication specs. Different candles require specific density ratios in their waxes. Different solvents require specific dissolving properties. Because of the specific requirements these products demand, not only are they hard to commoditize, the end market for them isn’t homogenous either. The end market is frayed which makes customer loyalty sticky. Over the last thirteen years, Calumet has marketed an annual average of over 1,000 different specialty products to over 3,700 different specialty product customers and not one customer has ever made up more than 10% of their specialty product demand.
Calumet has enjoyed much healthier margins over time on their specialty products segment than their larger competitors have on their traditional refined product offerings.
J. Bull, from the companies' 10-Ks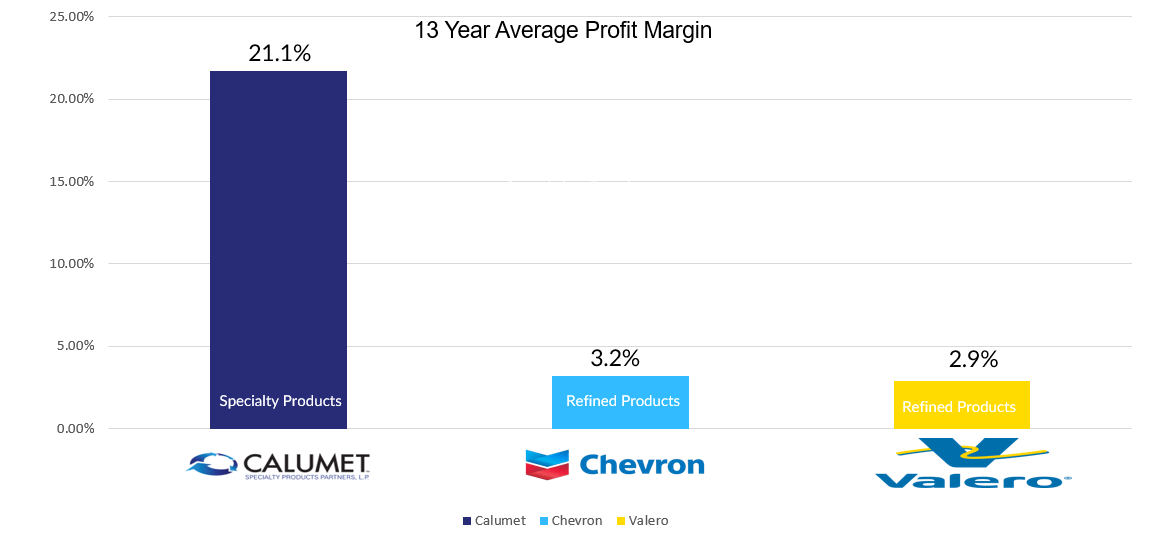
The specialty products segment of Calumet’s business offers a steady stream of cash flow, averaging 205M adjusted EBITDA annually over the last 12 years while the Gulf 2-1-1 crack spread averaged $20.82 (a historically reasonable crack spread) over the same time frame. Unfortunately, the specialty product segment’s growth profile is nothing to write home about. It’s averaged a 4.5% revenue growth rate since 2011, but growth in another segment is ramping up!
In 2020, Calumet started planning to convert their Great Falls refinery in Montana to a dual specialty asphalt and renewable fuels refinery named Montana Renewables (MRL). They planned for the initial conversion to possess 15,000BPD capacity of specialty asphalt and 15,000BPD of RD. Through advantageous loans from the Department of Energy and Montana municipal bond market, they hope to expand their facility’s capability from 15,000BPD of RD to 18,000BPD of SAF.
How do you value this new development within CLMT’s business? In 2022, the private equity firm Warburg Pincus paid 250M in cash in exchange for a preferred equity stake in MRL that converts to a 14.2% diluted common equity stake in CLMT. That deal valued the remaining 85.8% of CLMT’s common equity at approximately 1.51B.
Calumet, edited by J. Bull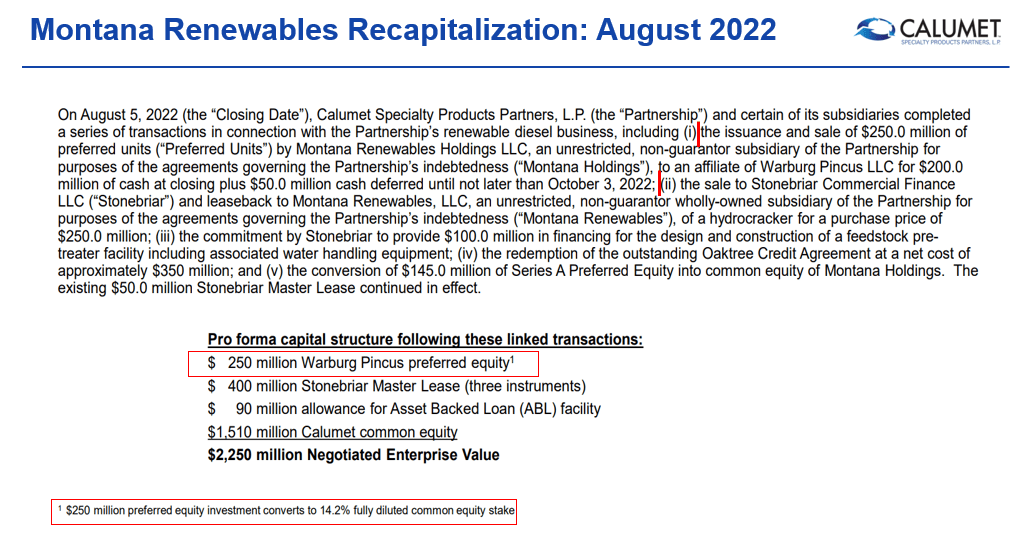
Since then, CLMT has decreased operational risk at MRL by entering into full operations, successfully commissioning a renewable hydrogen plant and pre-treatment feedstock unit, successfully building out their seed oil feedstock, successfully commissioning a SAF production unit (becoming the Western Hemisphere’s largest SAF producer) and executing their first deliveries on a multi-year contract with Shell at very healthy margins.
MRL has enjoyed a $1.25 - $1.45/gallon EBITDA margin on its RD production and expects an even greater margin on its SAF production. How are such good margins possible? McKinsey estimates that of the 128 operating refineries left in the US (down from 300+ in the 1980s) only 50% of them (around 60) are capable of being converted into renewable refineries and only 20% of them (around 25) are able to do so economically which makes renewable fuels produced at scale a rarity.
Not only is MRL fortunate compared to other refineries with regard to its convertibility to renewable production, but it’s also geographically advantaged compared to other renewable competitors in regards to its supply of feedstock and its distribution network of products. Diamond Green Diesel, a joint venture between Valero (VLO) and Darling Ingredients (DAR), is CLMT’s largest competitor. Their RD facility is situated near Port Arthur, Texas on the Gulf Coast. The graph below shows why the transportation costs of feedstock and consequently the GHGs emitted in the production of renewable fuels are greater for Gulf Coast facilities compared to MRL.
Goldman Sachs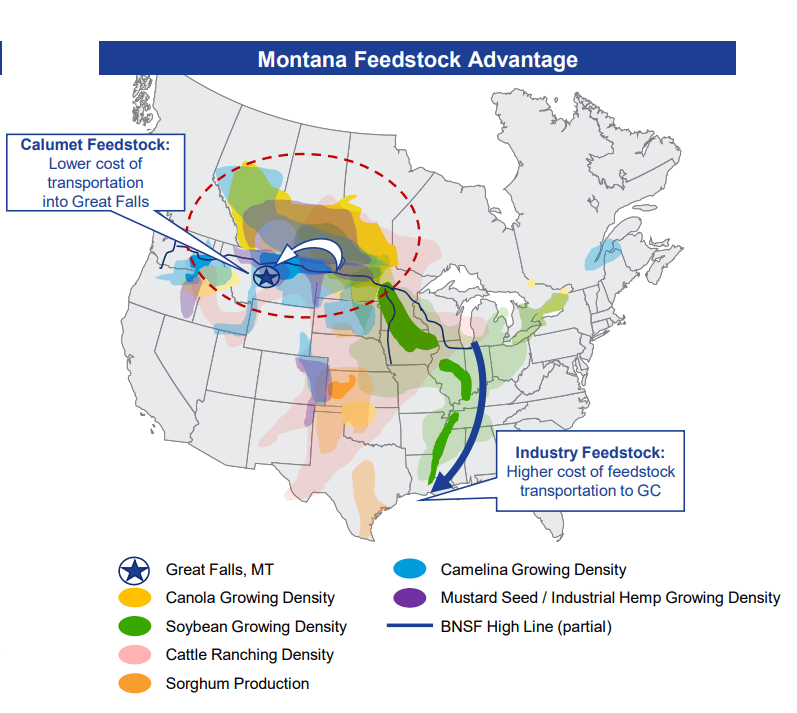
As of 2021, California accounted for 99% of America’s RD consumption. Since then, the Pacific North West has increased its consumption numbers which means the end market for RD in the US is the West Coast. MRL is located on a rail line with easy distribution to the Pacific North West whereas its Gulf Coast competitors must take an 8,000-mile journey through the Panama Canal to reach their end market.
Bank of America Energy Credit Conference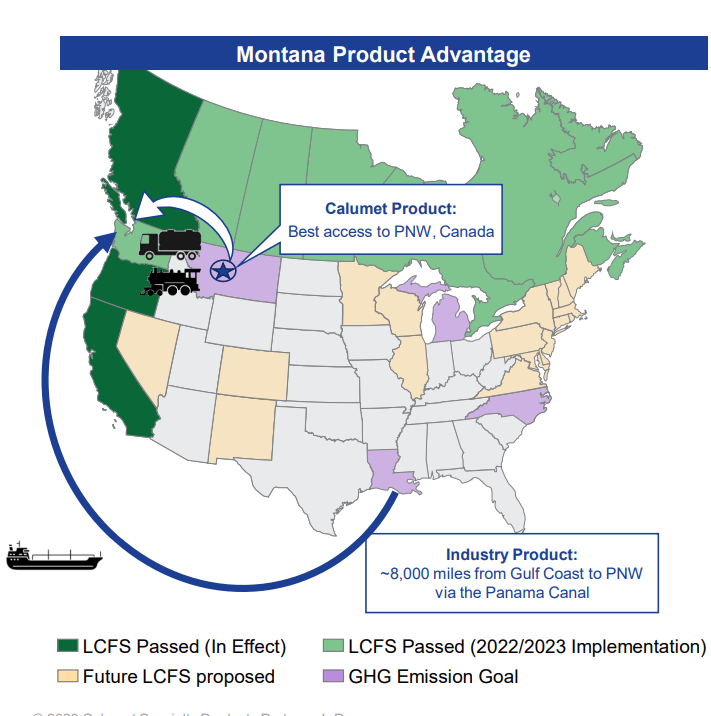
The importance of this geographical advantage will become more vital overtime due to the structure of most government subsidies for renewable fuel production. Remember, the ultimate goal is to reduce GHG emissions over the lifecycle (production and distribution) of the fuel. Take the carbon intensity curve by the California Air Resources Board (CARB) for example.
California Air Resources Board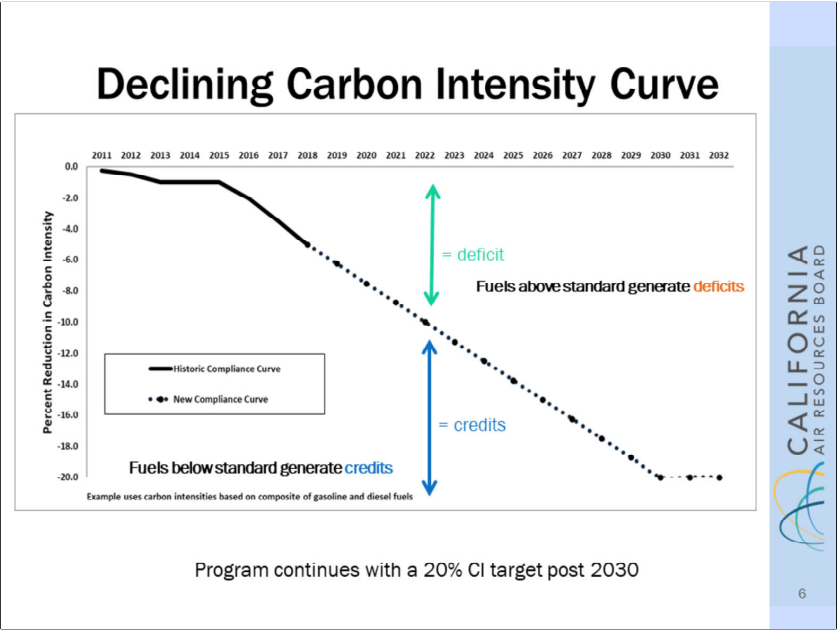
As time goes on, it becomes increasingly harder to generate a credit for renewable fuel without reducing carbon intensity. Similar to California, the Federal credit system has a base credit rate to produce renewable fuels and a floating credit rate based on how much GHGs are reduced in the process. Thus, a renewable fuel producer geographically advantaged in feedstock supply and end market demand will also have a margin advantage that grows over time as the credit amount is increasingly dependent on the carbon intensity being reduced.
MRL has emerged in the growing renewable fuels industry as a crown jewel asset, and CLMT management has expressed their interest in looking to strategically sell it or go forward with an initial public offering. What might a buyout valuation look like?
CLMT management has recently released their production goals for MRL.
Bank of America Leveraged Finance Conference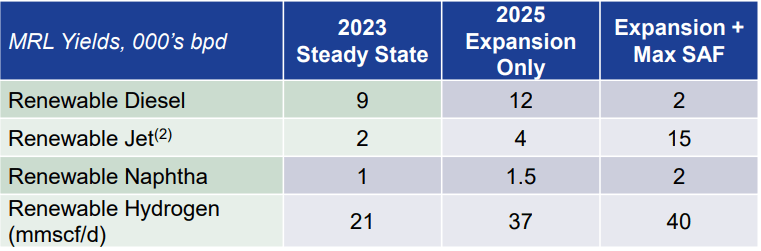
If management executes on these goals, EBITDA going forward becomes easy to calculate.
J. Bull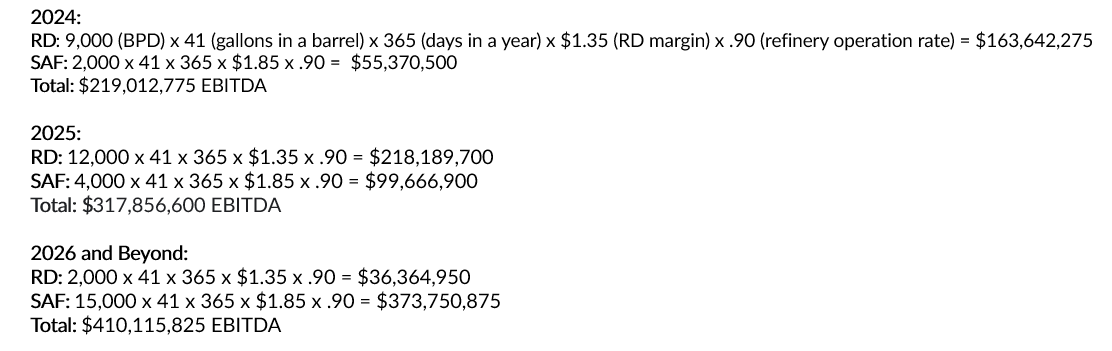
CLMT management has commissioned studies that demonstrate a renewable refinery should be valued at 12 – 15x EBITDA. Traditional refineries are currently valued around 7-8x EBITDA. Given the higher growth trajectory of demand for renewable fuels and the more limited number of supply refineries that can come online, a richer valuation for a renewable refinery makes sense. If MRL successfully does over 400M of EBIDTA in 2026 with all operational risk behind them and the low side of guidance minus a 15% enthusiastic management discount is used, MRL should be valued at 4.182B (410M EBITDA x 10.8 Multiple). I think this is an incredibly conservative number. Nevertheless, CLMT’s entire EV is currently 3.14B. In other words, if management successfully executes the SAF expansion at MRL, MRL will be worth more than all of CLMT’s current market cap and debt.
If a 4B sale of MRL went through, CLMT would wipe all of its debt (2B current total debt + 800M to finish SAF expansion) and be left over with approximately 1.2B. They’d also still have control of their legacy specialty products business which has historically done 205M of annual EBITDA for over a decade and is projected to do on average 250M annually going forward. At a conservative 7x EBITDA multiple, the legacy specialty products business is worth 1.75B. The 1.5B in cash from sale added to the 1.75B legacy business equals a 3.25B equity valuation, an approximate 3x from its current 1.14B market cap currently. Thus, we expect to see the price of CLMT’s partner units (likely to be converted into stock on a 1-for-1 basis near the end of 2024) go from its current price of $14.24 to north of $40 within the next two years.
The biggest risk to CLMT is that the US government doesn’t extend the renewable fuel credits set to expire in 2027 as this would be detrimental to the MRL business model. We believe this to be highly unlikely. There are reasons why RD and SAF have grown so rapidly recently and why governments all around the world our pinning their GHG reduction targets on increased RD and SAF production and consumption.
In 2005, Congress passed the Energy Policy Act. This bill sought to “reduce energy consumption, improve energy security, reduce pollution [and GHGs]” (SEC 324A). One perceived way of achieving these goals was by “[i]ncreasing the conversion efficiency of all forms of renewable energy through improved technologies. Decreasing the cost of renewable energy generation and delivery. Promoting the diversity of the energy supply” (SEC 931). Another goal was to make the “[c]commercial production of biobased fuels at prices competitive with fossil fuels” (SEC 941).
In 2007, Congress expanded upon these renewable fuel goals by passing the Energy Security and Independence Act. Thus, the Renewable Fuel Standard (RFS) was born (SEC 201). The RFS specified the type of renewable fuels to be produced and their production targets until 2022.
US Department of Energy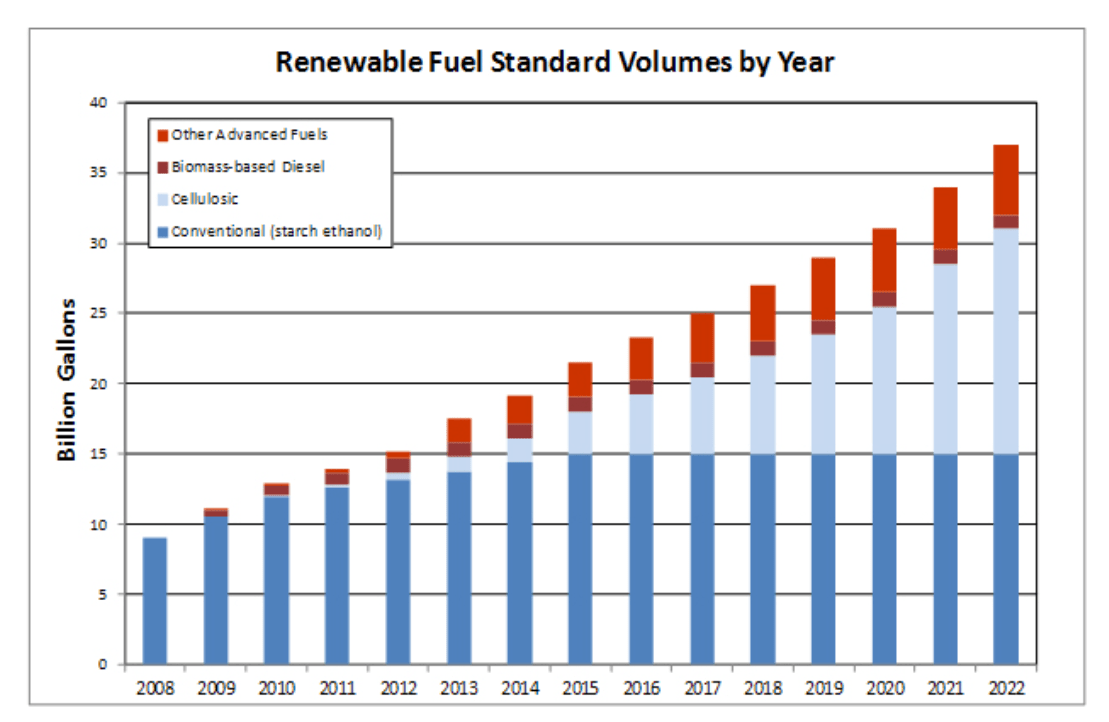
The EPA in partnership with the Department of Energy and the Department of Agriculture wanted to see the production of renewable fuels ascend from 9B gallons to 36B gallons domestically in under 15 years. They believed that goal could be accomplished by a composite of four renewable fuels.
The base renewable fuel would be Conventional (starch ethanol). The EPA estimated that the production and distribution of starch ethanol created 20% less GHG emissions than the production and distribution of gasoline. Consequently, ethanol production started ramping up and gasoline was cut with ethanol. Corn producers appreciated the tail wind to corn prices ethanol provided because corn was the main feedstock for ethanol, but whether the ethanol mix improved upon its pure petroleum counterpart was dubious.
The next largest renewable fuel would be cellulosic, fuel that is derived from the tough skin of certain plants. The EPA estimated that the production and distribution of cellulosic would reduce GHG emissions by 60% compared to other petroleum fuels. Unfortunately, the technology to produce cellulosic fuel and its feedstock supply chain hasn’t caught up with the policy mandating its production. Despite the lofty goal of producing over 15B gallons of cellulosic fuel by 2022, its production volumes are set to barely exceed 1B in 2024, a 15x disappointment.
The next renewable fuel would be biomass-based diesel, a renewable fuel generated from certain animal fats, plant secretions, or cooking oil. The EPA estimated that the production and distribution of biomass-based diesel would reduce GHG emissions by 50% compared to petroleum fuels. RD and SAF fall under the biomass-based fuel category.
Because these renewable fuels were not economic for oil refiners to produce at first, the EPA devised a system to elicit a supply response that remains in existence today.
The government essentially taxes oil refiners and importers. For every gallon of oil that oil refiners produce or importers import, they must produce or pay the production cost of a certain percentage of renewable fuels. This percentage system is updated (typically increased) annually by the EPA. Here is what 2024’s system looks like:
Pillsbury Law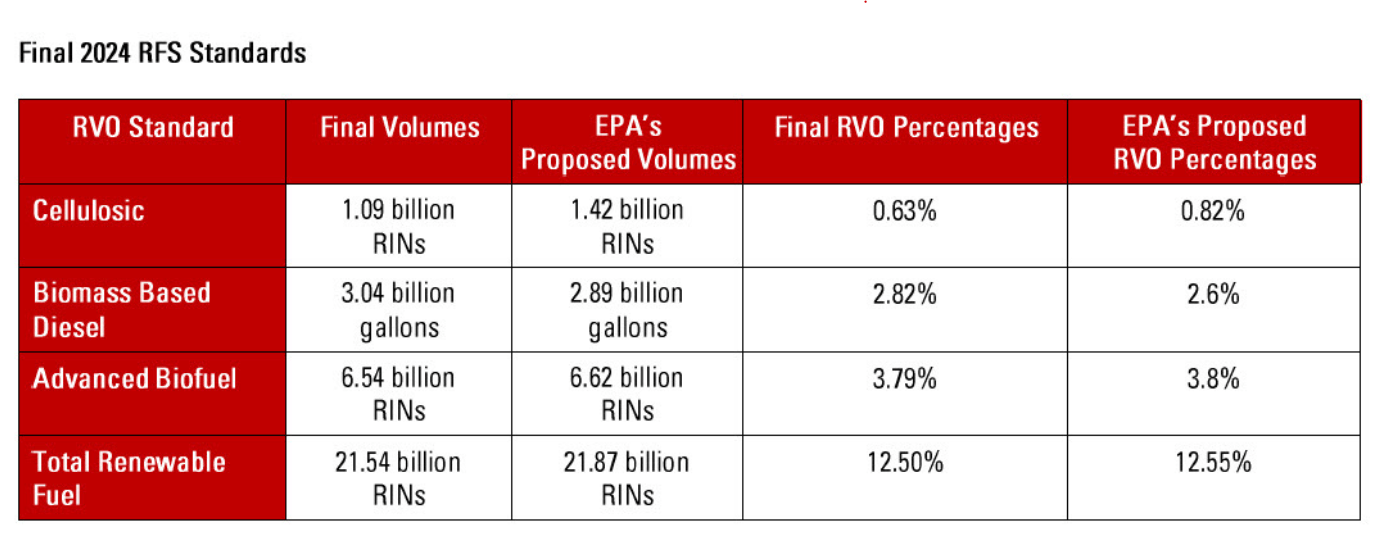
This chart looks hard to handle on the surface but its rather easy to understand. Essentially, the EPA estimates every year how much petroleum product will be consumed in the US then estimates who will supply that demand and in what quantity then apportions renewable volume obligations (RVOs) in accordance with the share of production.
For example, if I am a petroleum refiner and I refine one gallon of petroleum product, I am automatically assigned an obligation to produce a corresponding percentage of renewable fuels, 0.63% of cellulosic, 2.82% of biomass-based diesel, etc. If I don’t have the technology to produce these renewable fuels, I must pay for their production cost by going into the open Renewable Identification Number (RIN) market where renewable fuel producers who’ve produced in excess of their RVOs sell RINs to fuel producers who’ve produced less than their RVOs. Each category of renewable fuel (cellulosic, advanced biofuel, etc.) has their own RIN market. While prices for RINs in the open market are ideally tethered to actual production cost, market dynamics can and do get odd sometimes.
We saw earlier how ethanol failed to improve upon its pure petroleum counterpart and how cellulosic fuel failed to be produced by a large margin at the targeted level, but what about biomass-based diesel? The most prominent bio-mass based diesel until recently was biodiesel.
Unfortunately, biodiesel is a far inferior product compared to petroleum diesel. How so? Biodiesel isn’t a real hydrocarbon due to its oxygen content. The presence of oxygen makes it pack 7% less energy by volume. In addition, the oxygen can corrode barrels and storage tanks making the storage time of biodiesel significantly less. Oxygen renders biodiesel more vulnerable to microbial growth which can clog fuel lines. Finally, biodiesel has a higher cloud point which means it gels at a higher temperature, 36°F compared to the 16°F cloud point of petroleum diesel. Once biodiesel gels, it becomes difficult to transport via fuel lines. Due to the inferior qualities of biodiesel, it cannot be used as a standalone fuel. Instead, it must be blended in with traditional petroleum diesel which results in a less effective and pricier final product.
J. Bull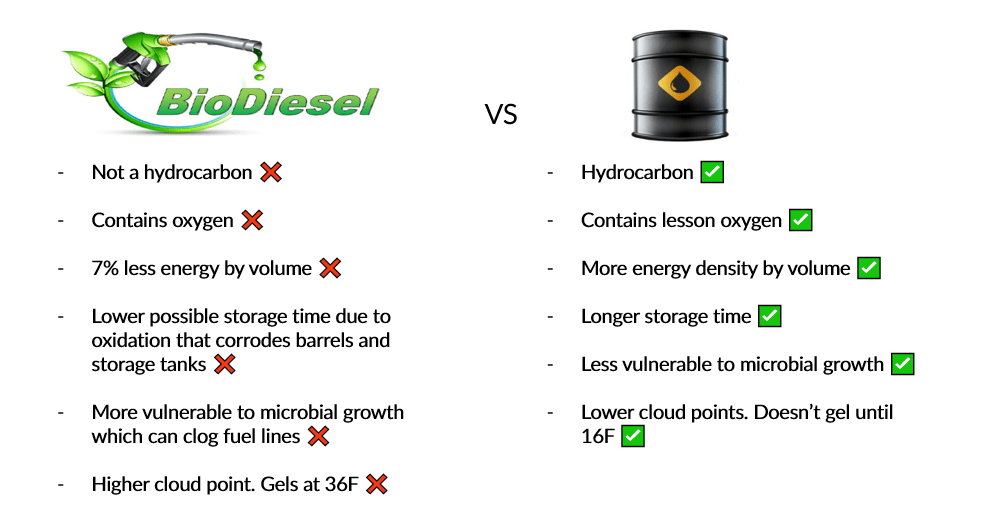
The disappointment of bio-diesel paved the way for renewable diesel (RD). RD is created from the same feedstocks (animals fats, plant secretions, and cooking oils) as biodiesel but utilizes a different chemical conversion process. Unlike biodiesel, RD is a hydrocarbon, having the same chemical composition as petroleum diesel. It contains no oxygen and thus has no storage problems. Its cloud point is -40°F making it very suitable for storage and transportation in cold weather. It possesses only 4% less energy by volume compared to the 7% of biodiesel. It can be a standalone fuel unlike biodiesel that has to get mixed in with petroleum diesel. Most importantly, its refined in a manner very similar to the way petroleum diesel is refined. Thus, traditional oil refiners are capable of converting their oil refining plants into RD refining plants at a relatively low cost just as CLMT did.
J. Bull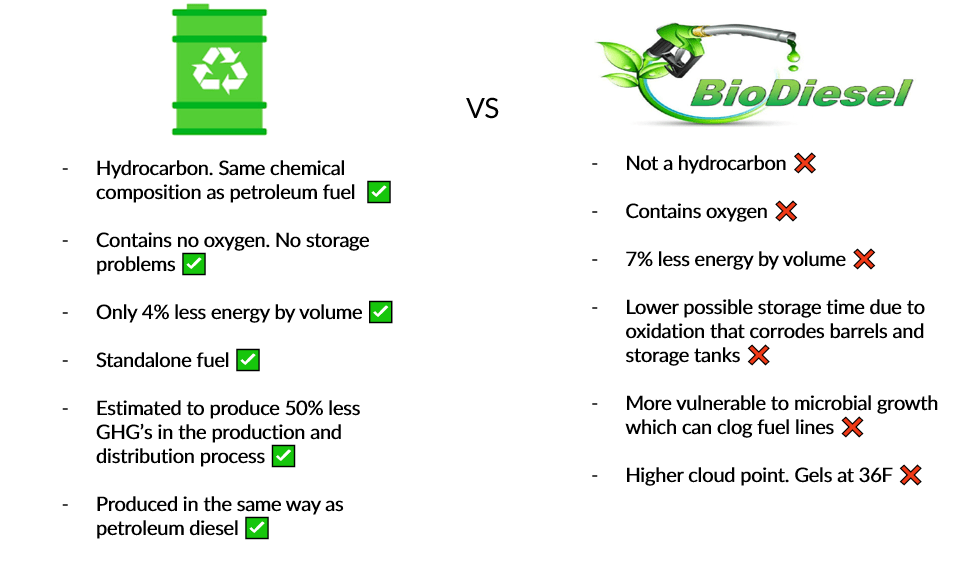
Because of RD’s superior product profile, its growth has outperformed bio-diesel since 2021.
U.S. Energy Information Administration (EIA)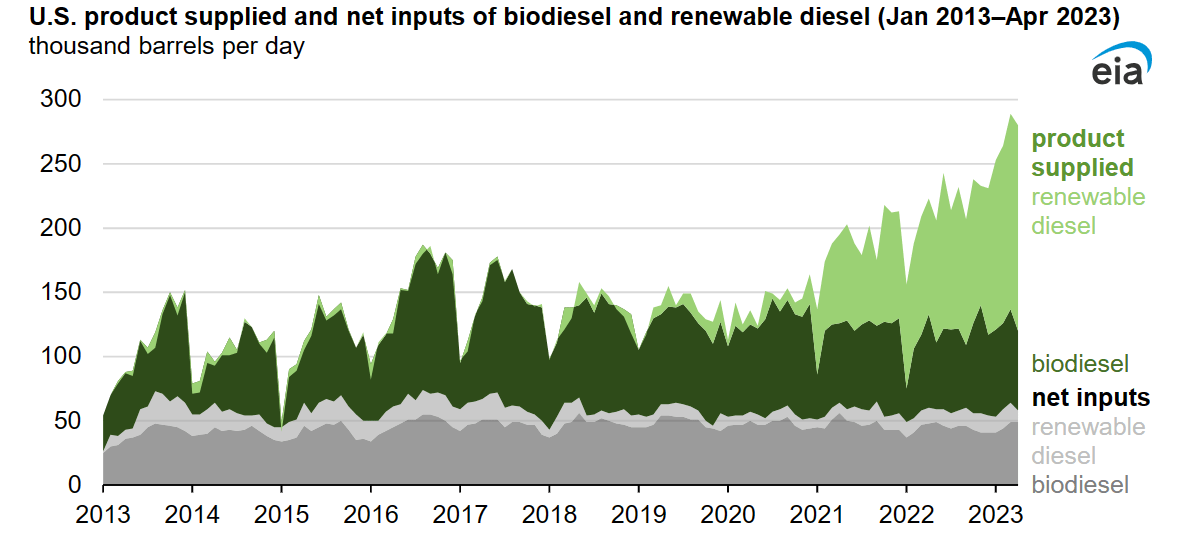
Insufficiency of RD domestic supply has kept biodiesel imports high. As RD domestic production ramps up, it will likely take more market share from biodiesel.
Biobased Diesel Daily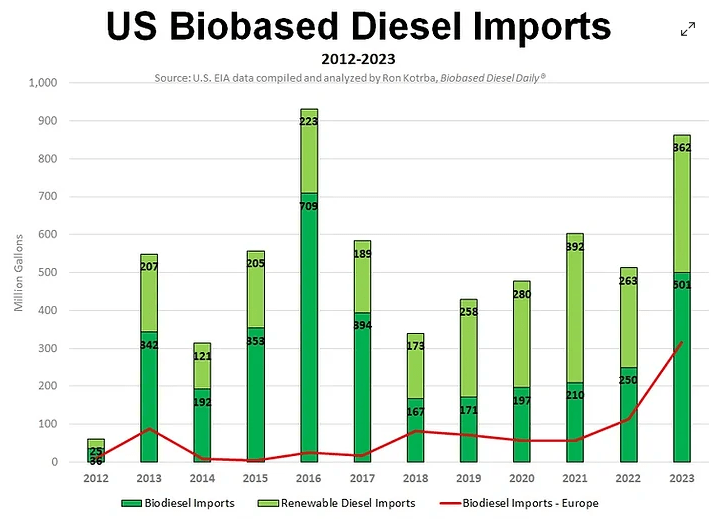
And it’s not just bio-diesel that RD is stealing market share from. In California, RD now makes up 49% of all diesel consumption with petroleum diesel making up the other 51%. Close to 600 (7.4%) of California’s gas stations offer RD. With government subsidies, the cost of RD and petroleum diesel has been virtually identical over the last several years.
US Department of Energy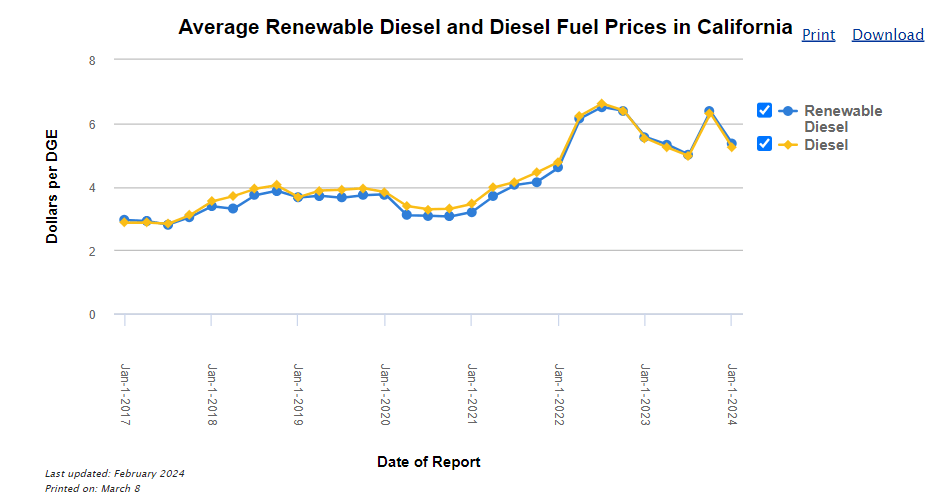
SAF is very similar to RD both in its production process and its effectiveness to replace the traditional petroleum fuel used, jet fuel in SAF’s case. Some commercial airlines have already achieved trans-Atlantic flights fueled exclusively by SAF. Major airlines such as American Airlines, Alaska Airlines, British Airways, Finnair, Japan Airlines and Qatar Airways have plans in place to purchase SAF annually. Even budget airlines like Ryanair are beginning to incorporate SAF into their fuel mix. It’s not just commercial airlines either, logistics companies are utilizing SAF as well.
Unlike the failed renewable fuels that came before them which at best made traditional petroleum products pricier and less functional, RD and SAF offer legitimate replacements for petroleum fuels and thus offer real hope to governments around the world at reducing GHG emissions in transportation. Even if the lofty targets of the RFS, SAF Grand Challenge, and RefuelEU aren’t reached, earnest attempts are being and will continue to be made. In addition, as the morality of an eco-friendlier world becomes deeper entrenched in the populous, the cost to political regimes not underwriting renewable fuels or companies not adding renewable fuels to their fuel mix as their competitors market their own green initiatives increases.
CLMT is a heavily levered entity. A recession could cause crack spreads to tighten and their cash flowing specialty products business to take a downturn which would make it hard for them to service their debt. We believe this scenario is unlikely however. Their specialty products business has shown incredible resilience even when crack spreads have collapsed. For example, their specialty products business was still able to generate 189M of adjusted EBITDA in 2016 when the Gulf Coast 2-1-1 Crack spread averaged a very low $12.33 that year (its currently $29.53 in March 2024).
J. Bull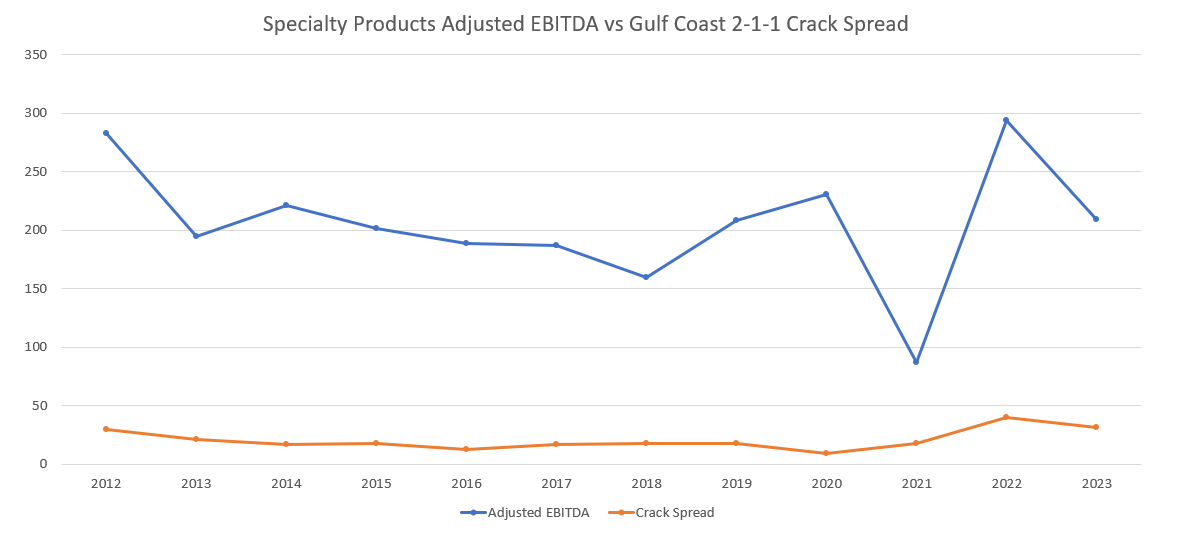
Also, CLMT potentially has a very large off-balance sheet liability in the form of RINS. They may be obligated to produce renewable fuel or purchase RINS to fulfill their obligations from priors’ years of petroleum refining. Historically, RIN purchase requirements have been non-cash charges they’ve expensed on their income statement. Their total RIN liability amounts to about 65M RINS and fluctuates in how much cost it would take to satisfy that requirement based on price movements in the RIN markets. In the past, CLMT was granted a small refinery exemption (SRE) which exempted them from fulfilling their RVO. However, whether this exemption still applies to their refineries during certain years is currently in legal limbo.
However, we think the litigation will be favorable towards CLMT. The original rule as seen in SEC 201(k) of the Energy Security Act of 2007 reads, “The term ‘small refinery’ means a refinery for which the average aggregate daily crude oil throughput for a calendar year (as determined by dividing the aggregate throughput for the calendar year by the number of days in the calendar year) does not exceed 75,000 barrels.” Historically, all of CLMT’s refineries in every year have produced under that quota.
We would like to thank Josiah Bull for this piece.