
deepblue4you
deepblue4you
The Vanguard Total Stock Market ETF (NYSEARCA:VTI) is a low-cost, one-stop-shop solution for investors seeking market-cap-weighted exposure to nearly 4,000 U.S. stocks. Since February 1993, it's matched the SPDR S&P 500 ETF (SPY) with a 10.17% annualized gain and turned a mere $10,000 investment into a whopping $203,000. However, it hasn't always been a smooth ride. VTI declined by 44% in the early 2000s, 51% during the Great Financial Crisis, 21% in the Q1 2020 pandemic crash, and, most recently, 25% in the first nine months of 2022. These declines might not matter to long-term investors, but as your time horizon shrinks, managing risk is a necessity. Highlighting the risk and reward opportunities across the total U.S. stock market is the purpose of this article, and I hope you can use this information to find suitable complementary ETFs to match your investment objectives, several of which I will discuss below. With that said, let's start with a brief overview of VTI's strategy and performance.
Since April 2011, VTI has tracked the performance of the CRSP US Total Market Index, providing U.S. equity exposure to large-, mid-, and small-cap stocks representing roughly 100% of the investable market. VTI launched on May 24, 2001, has $356.6 billion in net assets, a 1.35% dividend yield, a 3.40% turnover rate, and 3,747 holdings as of January 31, 2024. Perhaps its biggest draw is its low 0.03% expense ratio. It's an excellent choice for investors who want to increase their U.S. equity exposure but aren't sure what segments to target.
VTI employs a passively managed Index sampling approach, meaning not all stocks in the Index are in the ETF. Based on the table below, this approach works, as VTI's NAV is within 0.01% of its benchmark Index since its inception and over the last ten years.
Vanguard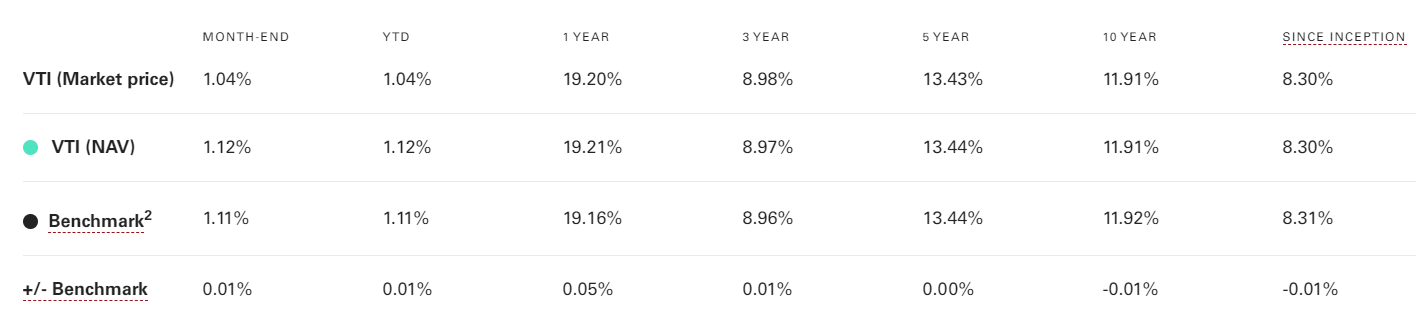
VTI has an 86% overlap by weight with SPY, so it's unsurprising to see similarities in their respective performance charts. As shown below, nearly all metrics are the same, with VTI gaining an annualized 10.17% since February 1993. Please note VTI's returns are backfilled with the Vanguard Total Stock Market Index Fund Investor Shares (VTSMX) from until June 2001.
Portfolio Visualizer
The rolling five-year return chart also highlights the similarities between VTI and SPY. As of January 2024, SPY has a 0.76% annualized edge (14.20% vs. 13.44%), but VTI outperformed SPY by 1.13% per year for the five years ending February 2014. This period covered the recovery after the Great Financial Crisis, as less-profitable stocks outperformed, consistent with positive market sentiment.
Portfolio Visualizer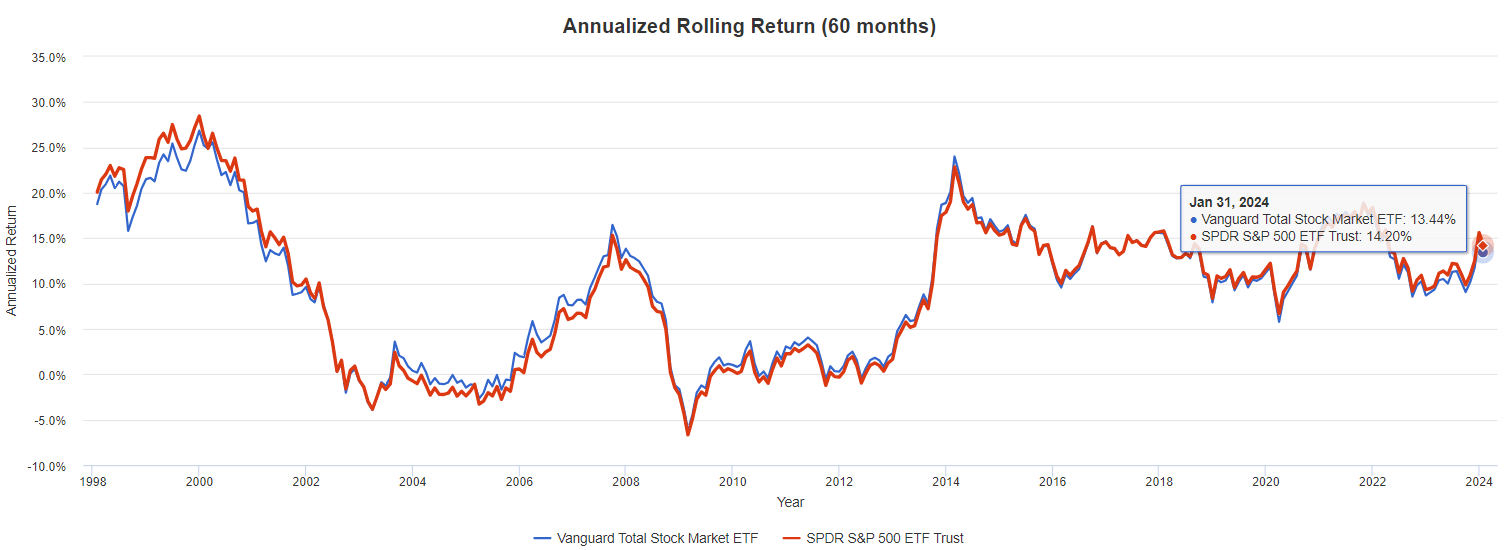
Assessing market sentiment and alternating between VTI and SPY might give you an edge, but that defeats the purpose of owning either fund. Instead, it's more helpful to have a broad understanding of the entire U.S. stock market and, if you'd like, use it to tilt your portfolio in a direction that best aligns with your investment objectives and risk profile. Let's see how VTI looks on various fundamental metrics by sector to get started.
The table below highlights how VTI has 28% allocated to Technology stocks, followed by Financials (14%), Health Care (13%), and Consumer Discretionary (10%). Energy (4%), Materials (3%), Real Estate (3%), and Utilities (2%) are not well represented.
The Sunday Investor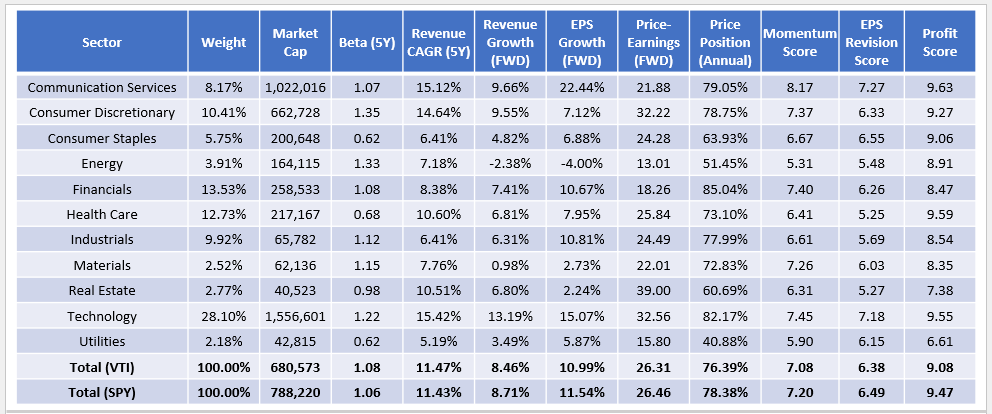
Here are three things to consider:
1. There's a difference between "flight to quality" and "flight to safety." Using each sector's profit scores as a guide, Communication Services, Health Care, and Technology are the highest-quality sectors, but Consumer Staples and Utilities are the safest sectors with the lowest five-year betas. If you want to reduce risk, I suggest the higher-quality Consumer Staples sector. Per the drawdown tables below, the Vanguard Consumer Staples ETF (VDC) usually does better than the Vanguard Utilities ETF (VPU).
Portfolio Visualizer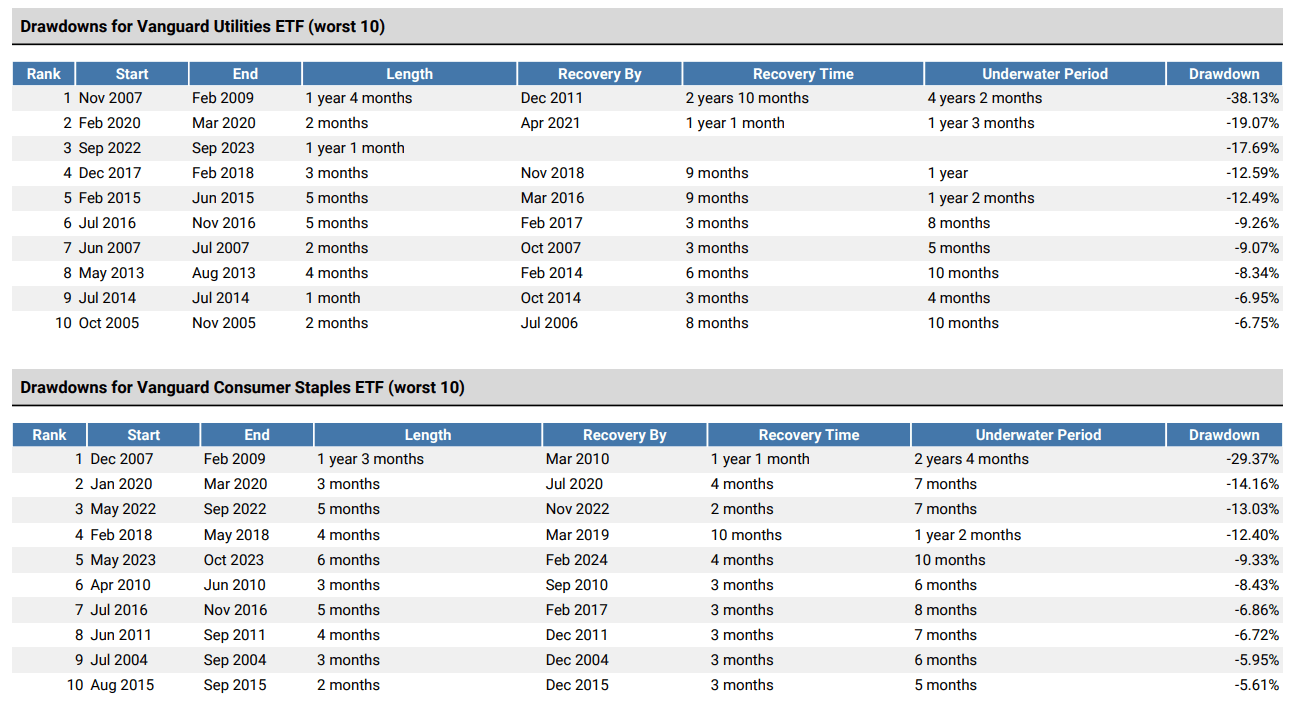
2. Over the last two years, many value ETFs overweighted the Energy sector for its high growth rates and cheap valuations. However, this might change soon. The Energy sector's estimated sales and earnings per share growth rates are -2.38% and -4.00%, respectively, and, combined with the unpredictability of oil prices, I do not recommend risk-averse investors overweight this sector, regardless of how strong its fundamentals might look.
3. Technology stocks dominate the market and offer an impressive 15.07% estimated earnings per share growth. The sector is also expensive at 32.56x forward earnings under the weighted average method. To get a quick idea of whether the trade-off makes sense, you can calculate a PEG ratio by dividing the earnings growth rate into the P/E, with lower values indicating better value. Below is the result for each sector, excluding Real Estate.
Technology's 2.16 PEG ratio is one of the better ones, which might explain why it also has one of the higher Momentum Scores. Technology stocks continue to deliver, with Microsoft (MSFT), Apple (AAPL), and Nvidia (NVDA) reporting 5.83%, 3.66%, and 11.31% earnings surprises about one month ago. Wall Street analysts are also bullish on the sector, evidenced by a 7.18/10 EPS Revision Score compared to 6.38/10 for VTI. In short, it might be too early to bet against big tech, though I support lowering the exposure through ETFs like the JPMorgan U.S. Quality Factor ETF (JQUA) and the Invesco S&P 100 Equal Weight ETF (EQWL). You can read my latest analysis of EQWL here to understand why.
The following table breaks down VTI by its top 25 sub-industries, which total 64% of the fund. This number is high because VTI is market-cap-weighted and dominated by mega-cap stocks. To illustrate, the 56 stocks with market caps above $150 billion comprise 51.27% of the fund, so VTI doesn't offer much advantage over SPY regarding diversification.
The Sunday Investor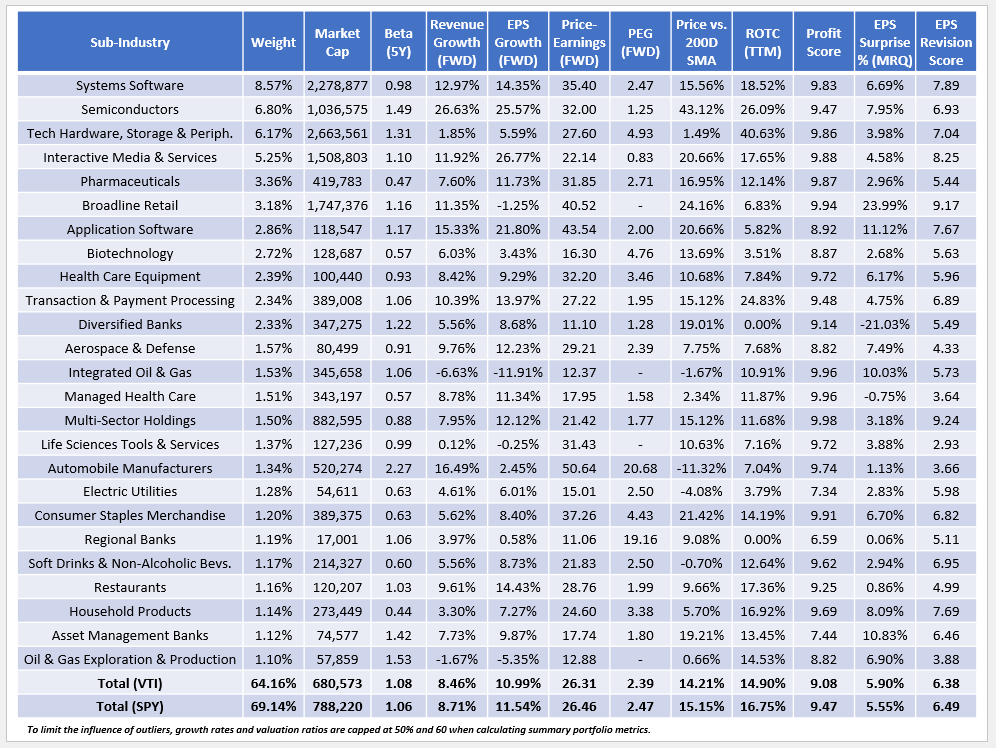
Readers can use this table to identify sub-industries that can reduce risk, enhance returns, or both. Here are three suggestions that rank well on their growth/valuation combination, profitability, earnings surprises, and earnings revisions:
Semiconductors: An Earnings Growth Standout
Despite Nvidia (NVDA) soaring 242% over the last year, the Semiconductor industry looks solid on paper, featuring 25.57% estimated earnings per share growth at a 32.00x forward earnings valuation, or 29.95x under the harmonic weighted average calculation method. This valuation ranks about #135/160 by sub-industry, but it's also one of only a handful of high-quality sub-industries to offer 20%+ earnings growth. I underestimated Semiconductor stocks in my October 2023 review of the iShares Semiconductor ETF (SOXX). I opted for a more cautious approach, but this sub-industry is undoubtedly thriving in a growth-favored market.
Soft Drinks & Non-Alcoholic Beverages
The Soft Drinks & Non-Alcoholic Beverages sub-industry is mainly PepsiCo (PEP) and Coca-Cola (KO), with 0.50% and 0.49% weightings each in VTI. These stocks have a 9.62/10 profit score, a low 0.60 five-year beta, and an above-average EPS Revisions score. It's one of the best ways to reduce risk while keeping quality high, but you may want to go the individual stock route on this one. The only ETF with 25% or more allocated to this sub-industry is the First Trust Nasdaq Food & Beverage ETF (FTXG) at 28.36%, and unfortunately, its 0.60% expense ratio is excessive.
One downside is that an equal-weight portfolio of PepsiCo and Coca-Cola did not outperform VTI in moderate market declines. It lagged by over 6% between February and May 2018 and outperformed by only 5% during the Q1 2020 COVID-19 crash. It's not a big risk-reducer, but it's also one of only a handful of top sub-industries to trade below its 200-day moving average price.
Property & Casualty Insurance
Property & Casualty Insurance stocks only comprise 1.02% of VTI. However, I recently noted how the Invesco KBW Property & Casualty Insurance ETF (KBWP) was one of 50 ETFs never to post a double-digit annual decline between 2011-2023. This smoother ride resulted in KBWP beating VTI by an annualized 0.76% since 2011 despite a somewhat high 0.35% expense ratio.
Portfolio Visualizer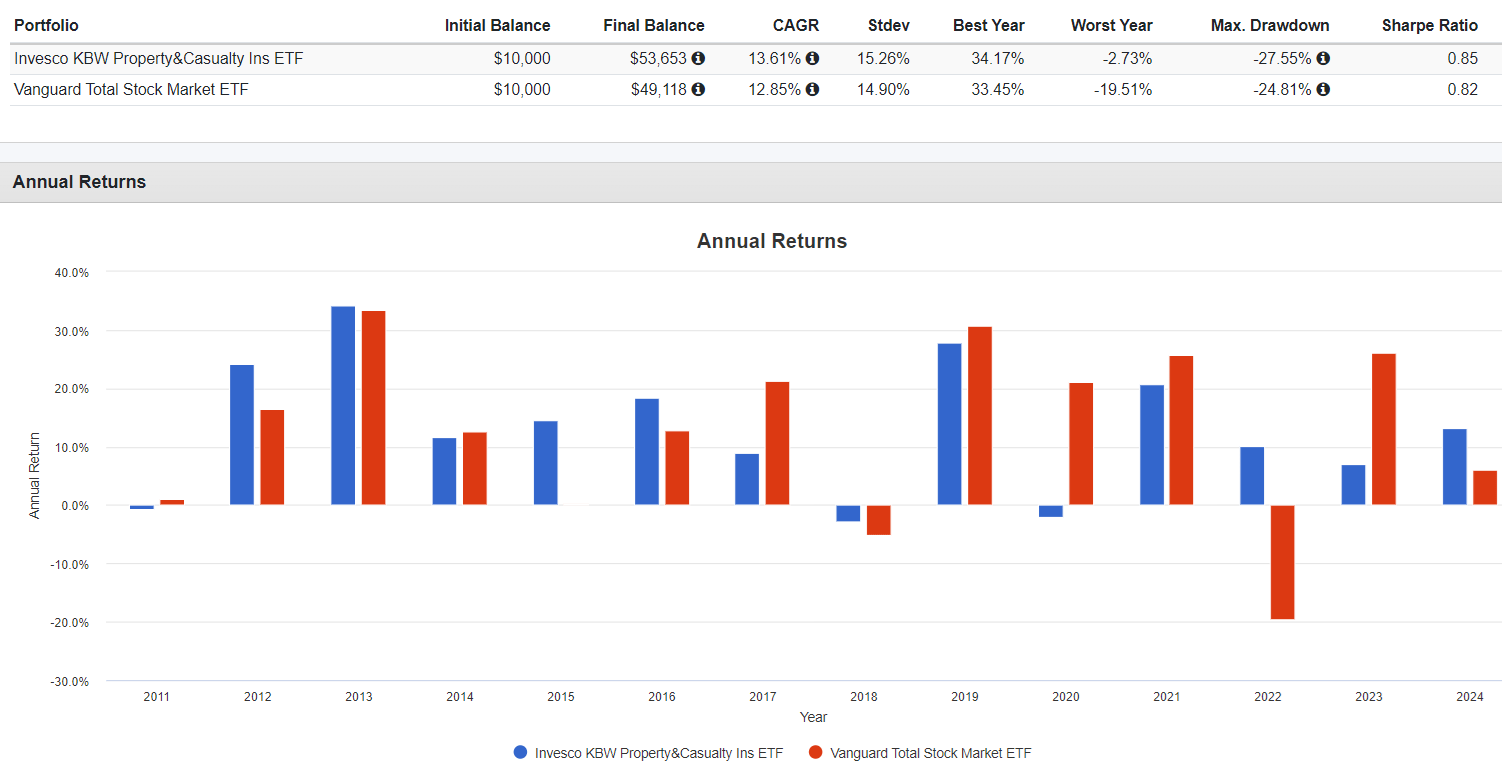
KBWP's weighted average market capitalization is about $35 billion, which is nothing close to VTI's $681 billion. As a result, this defensive sub-industry is likely not prominent in any portfolio anchored by low-cost Index funds like VTI.
There are very few differences between VTI and SPY, and both are solid core positions in your equity portfolio. SPY is more concentrated, but not by much, and this partly explains why the two have delivered nearly identical returns over the last 30 years. Pick one, and as long as your time horizon is long enough, I doubt you will go wrong. However, this article explored the fundamentals of VTI's sectors and sub-industries to identify which segments are worth buying today. I have four takeaways for you:
1. Energy stocks are highly volatile, and I do not recommend overweighting them if you are risk-averse. It wasn't long ago when the Energy Select Sector SPDR ETF (XLE) had some of the best earnings growth rates and was among the cheapest sector ETFs. Today, the picture looks much different, with VTI's Energy stocks' earnings expected to decline by 4.00% over the next year and key stocks like Exxon Mobil (XOM) and Chevron (CVX) posting negative net total returns since January 2023. Energy was an inflation bet that paid off for many dividend and value funds in 2022, but that ship has sailed, and it's time to adjust your outlook.
2. Utilities and Consumer Staples have identical 0.62 five-year betas, but Consumer Staples is the higher-quality sector, offers a bit better growth potential, and has a better track record in drawdowns. The Consumer Staples Select SPDR ETF (XLP) is an easy solution if you're looking to keep costs down. Otherwise, adding PepsiCo or Coca-Cola will reduce your portfolio's risk without sacrificing quality. Industry-specific ETFs like FTXG are too costly.
3. The semiconductor sub-industry is one of the few that feature a 20%+ earnings per share growth rate, and although its 32.00x forward earnings valuation is high, the mix is one of the better ones available. I missed the boat on SOXX in October, but since the goal was risk-reduction, I'm not too disappointed. The Semiconductor sub-industry has a 1.49 five-year beta (1.62 over the last two years), and SOXX has demonstrated slightly weaker risk-adjusted returns (Sharpe and Sortino Ratios) over the last decade compared to the Vanguard Information Technology ETF (VGT).
Portfolio Visualizer
4. The Property & Casualty Insurance sub-industry is an excellent way to reduce portfolio risk without necessarily sacrificing returns. As I described in my bullish review of KBWP, insiders are generally bullish on the insurance industry for 2024, Wall Street analysts have increased earnings estimates for most constituents, and its five-year beta is low at 0.63. Furthermore, its low market cap means P&C stocks likely aren't prominent in your portfolio, making it an excellent diversifier.
Thank you for reading this analysis, and if you have any questions or would like to know more about the fundamentals and performance of other U.S. equity ETFs, please let me know in the comments section below.