
Mihaela Rosu
Mihaela Rosu
The Sentiment King has held strong buy signals on both GLD and UGL for over six months. UGL is the ProShare 2X version of GLD. In the last two weeks, both have broken above their long-term resistance lines. Since they were recommended, UGL is up 21.1% and GLD is up 13.3%.
We want to update the indicators that originally produced these strong buy signals for gold to see if they're still active, and whether this breakout has legs.
We can see the recent price breakout above resistance lines in both these price charts. We've inserted dash dashed lines to highlight each ETF’s three and a half year resistance line.
The ProShare Ultra 2X Gold Fund (The Sentiment King) The State Street Gold ETF (The Sentiment King)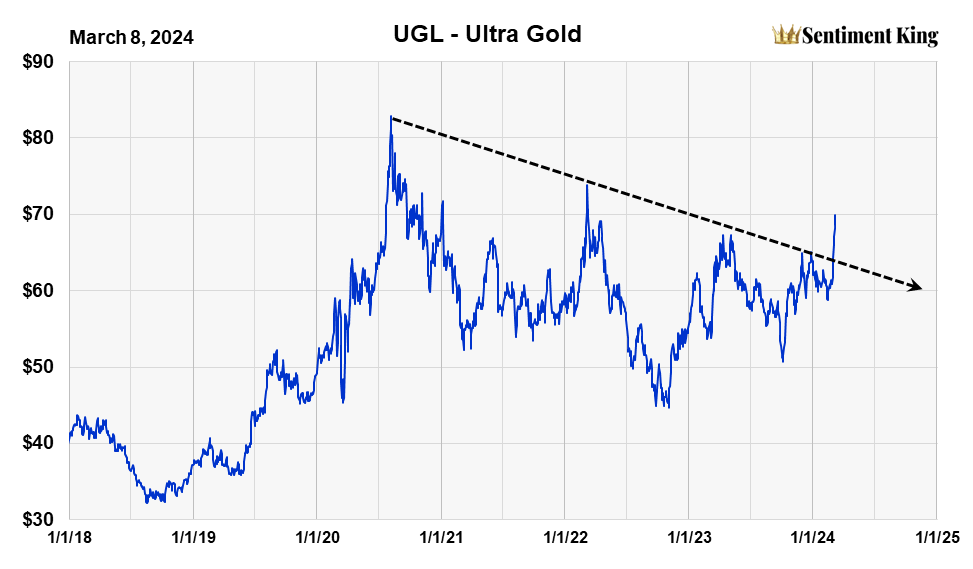
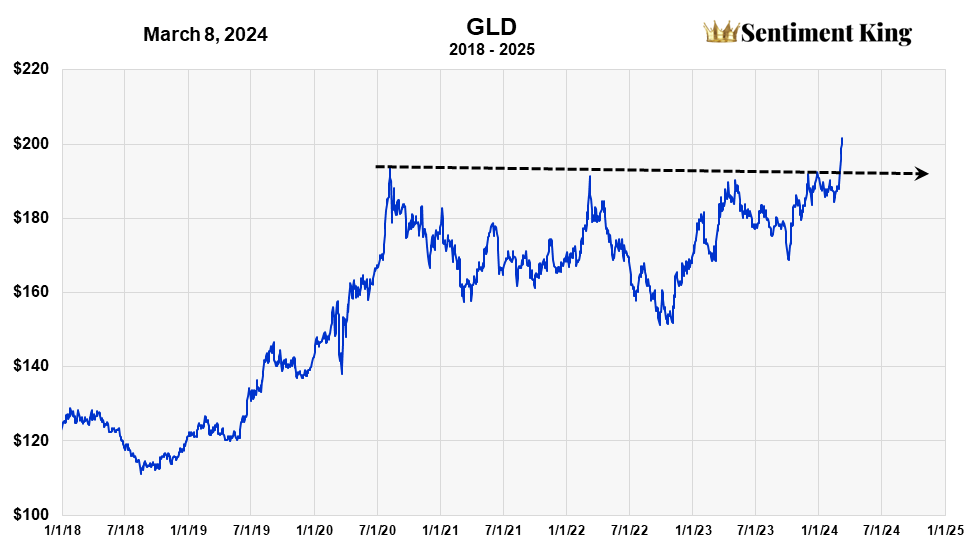
The resistance line in UGL is downward sloping, while the one for GLD is horizontal. A resistance line breakout after 3 1/2 years of resistance is a significant, long-term event. Can prices settle back and retest the breakout point? Yes, but it is highly unlikely.
(Before we move on, these two charts highlight something important about using leverage. While the resistance line in GLD is horizontal, that of UGL is downward sloping. This gradual decline in value of UGL versus GLD is due to the added cost to investors of using margin, and it represents the additional risk of investing in ETFs that use margin. While you do get the multiplying advantage of leverage when prices are moving up, there's the carrying cost of waiting for that to occur).
Seven months ago, last August, we gave a strong buy signal on UGL. We essentially repeated that strong buy signal for gold investments with this October article on GLD. Both strong buy signals were based on the two indicators we will update here.
Commitment of Traders Data
The Sentiment king has developed a very helpful indicator to forecast gold long-term. We call it the "SK Long-Term Gold Buyer Index" and it's shown below. It is created by merging, in a statistically consistent manner, the CFTC commitment of traders' data of both money managers and gold producers.
This is the Sentiment King's Long Term Buying Index for Gold. It's based on combining commitment of trader's data for gold producers with that of asset money managers. It's always positive if gold producers are long gold futures, and it's likewise positive if money managers are short gold futures. Both conditions are bullish in themselves. Our index combines them and highlights moments when both conditions exist. The Green Zone readings are when money managers are short gold futures and gold producers are long. Red zone readings represent low short positions of the money managers and low long positions of the gold producers. (The Sentiment King)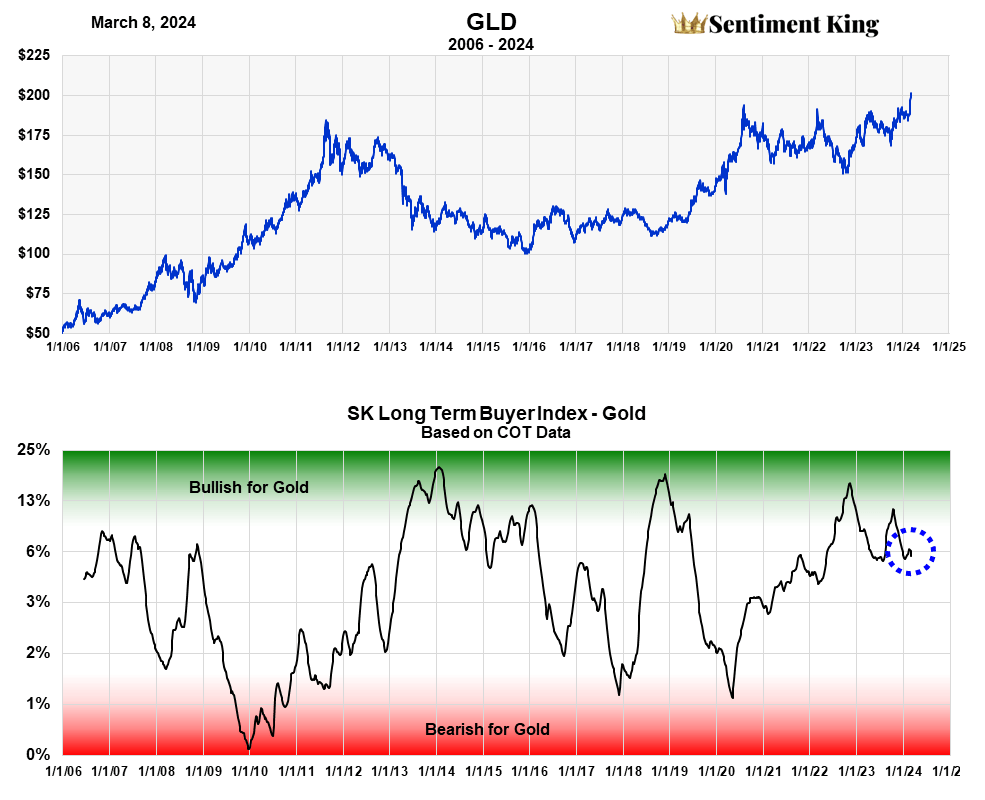
We are amazed at how this long-term indicator for gold has remained near the bullish zone since gold made its recent long-term low at the end of 2022. We've circled where the indicator is today. It shows how far it's away from a red zone reading, which would be a major sell signal for gold.
This indicator continues to be long term bullish for gold and is why we continue to have strong buy signals for both GLD and UGL.
Gold Newsletter Writer Survey
Mark Hulbert has long kept track of what newsletter writers are saying about gold on a daily basis. Records go back to before 2000. To gain a longer term perspective we take his daily numbers and perform a time weighted moving average on them. We then graph that number on the Sentiment King red-green ranking scale, which shows extreme bullish or bearish sentiment. It acts as the contrary opinion indicator. Green Zone readings, which represent extreme bearish sentiments, are bullish for gold. The opposite is true for the Red Zone. (The Sentiment King)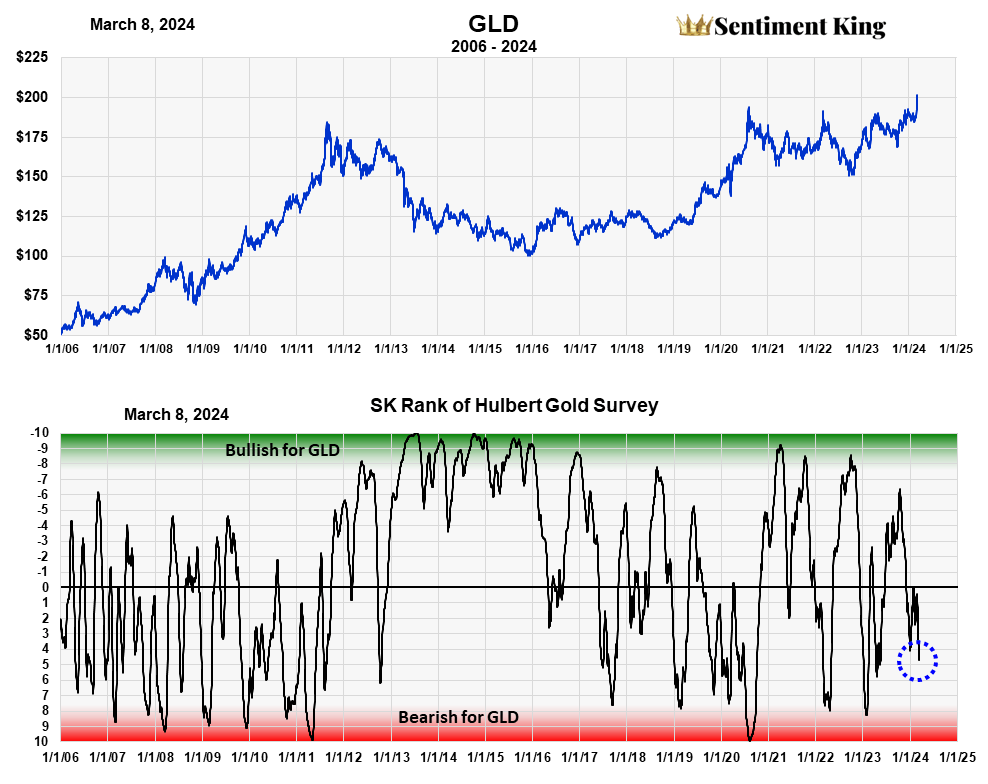
The strong buy signal produced by the COT data is confirmed by this indicator based on surveys of gold newsletter writers. The current ranking of this indicator on the Sentiment King ranking scale, shown by the blue circle, is a considerable distance from any Red Zone sell signal.
With the strong buy signal on gold still in force, which ETF should the investor use - GLD or UGL?
That obviously depends on the risk tolerance and age of the investor. At my age, less risk is preferable, which is why I prefer GLD. UGL will produce higher gains than GLD during long advances, but there is an erosive cost of using UGL that accumulates over time.
UGL will also under perform during long rest periods when gold prices are stagnant. This was seen in the two prices charts at the beginning. We leave it to the reader to assess the pros and cons of each when making their decision.
As we mentioned, there are unique risks that come with investing in UGL not found in most other ETFs. There is a constant downward price erosion that increases the longer one holds the fund. This comes from what is called “carrying costs” due to the fact the ETF must use some form of margin or leverage. Both the ProShares website and the SEC have detailed messages on the inherent risks of using leveraged ETFs.