Scott Olson/Getty Images News
Scott Olson/Getty Images News
With a market capitalization as of this writing of $20.53 billion, Darden Restaurants, Inc. (NYSE:DRI) is not only a giant in the casual dining space, it's also one of the largest restaurants out there. Sure, it doesn't stand up to the size of some of the other major players. But as far as restaurants go, the company has proven itself to be an undeniable success.
At first glance, many individuals likely don't know the firm by name. But most people, at least in the us, have dined at one of its locations. Its most popular chains are Olive Garden and LongHorn Steakhouse. Up until 2014, the company also owned Red Lobster. It also owns a slew of other restaurants such as, but not limited to, Cheddar's Scratch Kitchen, Yard House, and Ruth's Chris Steak House.
The last time I wrote about the company was in an article that was published in December of 2022. In the time since then, management has demonstrated continued growth, a good chunk of which can be attributed to the firm's acquisition, in 2023, of Ruth's Hospitality Group, the owner of Ruth's Chris Steak House in exchange for $724.6 million. But at the time that I wrote my article on the company, I didn't find myself terribly impressed. I acknowledged robust sales and earnings that had been exceeding analysts' expectations. I also said that shares did not look unreasonably priced. However, there were margin concerns and the stock was not cheap enough for a value investor like me. This led me to rate the business a "hold," which is a rating that I assign when I believe that shares should generate performance that is more or less in line with the broader market for the foreseeable future.
Since then, that is exactly what has transpired. While the S&P 500 (SP500) is up 33.6%, shares of this restaurant play have seen an upside of 28.6%. Despite this robust upside, the stock is trading at levels that are more or less in line with when I last wrote about the company. However, relative to similar firms, shares do look very pricey. This leads me to keep a more cautious rating on the stock. But it's also important to note that, with earnings coming up, the picture can always change. And with that in mind, there are some things that investors should be paying close attention to.
Author - SEC EDGAR Data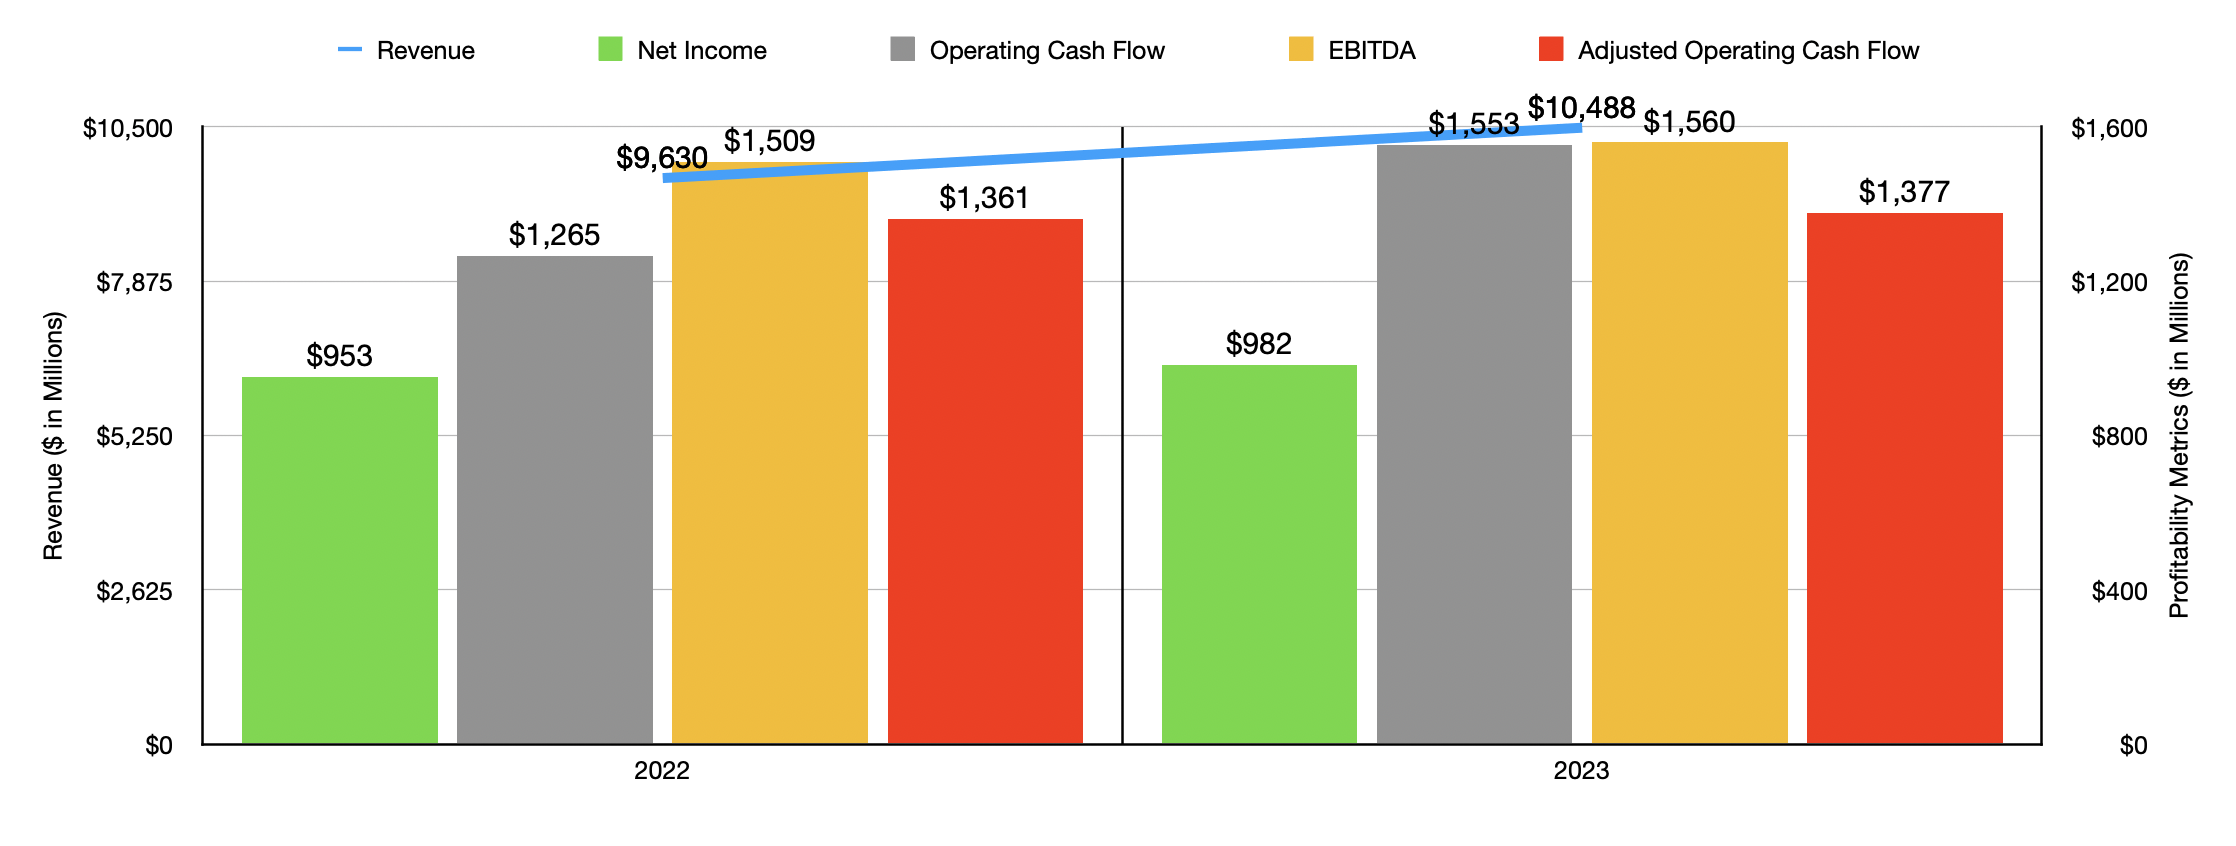
Since I wrote about Darden Restaurants in December of 2022, a lot has happened. As I mentioned already, the firm acquired another restaurant chain. That firm, Ruth's Chris Steak House, currently has 78 locations in operation. This has made possible growth that otherwise would have been slower had the company not made the purchase. That's why it's not terribly surprising to see that revenue, in fiscal 2023, came in at $10.49 billion. That's an increase of 8.9% over the $9.63 billion in sales reported for fiscal 2022.
Of course, there were other contributors to the upside the company experienced. For instance, the firm had a blended same restaurant sales increase of 6.8% during that window of time. It also enjoyed sales from 47 net new restaurants that were opened. All told, this was instrumental in pushing up the number of locations of the company from 1,914 to 2,010.
Darden Restaurants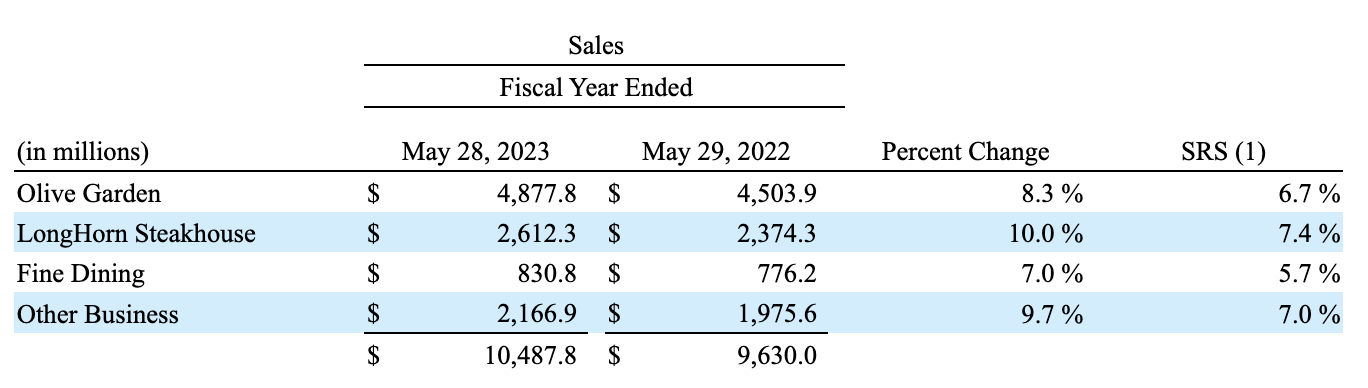
With the increase in revenue came a rise in profits. Net income grew from $953 million to $982 million. Operating cash flow saw an even more impressive increase from $1.27 billion to $1.55 billion. But if we adjust for changes in working capital, we get a more modest increase from $1.36 billion to $1.38 billion. Lastly, EBITDA managed to rise slightly from $1.51 billion to $1.56 billion.
Darden Restaurants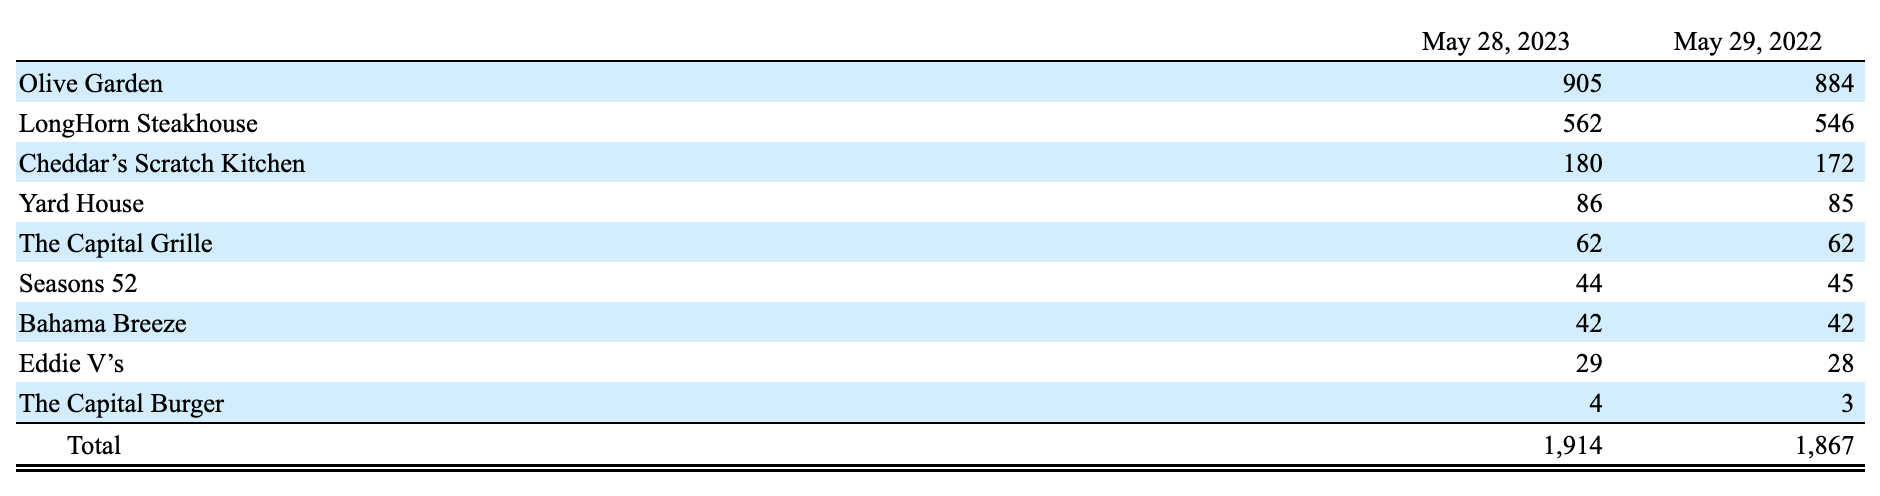
For the 2024 fiscal year, growth for the business continues. Thanks to an increase in store count from 1,887 to 2,010, the company has seen revenue grow from $4.93 billion in the first half of 2023 to $5.46 billion in the first half of the current fiscal year. Naturally, same restaurant sales growth also contributed to the upside the company experienced. While its fine dining operations reported a year-over-year decline of 2.3%, Olive Garden grew by 5.1%. LongHorn Steakhouse saw an even more impressive 6.5% rise. All of the other operations combined reported a modest uptick of 0.3%.
It is worth noting that the vast majority of the increase in same restaurant sales for both Olive Garden and LongHorn Steakhouse came from increased prices. But both restaurant chains reported a rise in guest counts totaling 0.1% on a same restaurant basis. On the fine dining side of the equation, the company actually suffered a 6% decline in same restaurant guest counts that more than offset a 4.5% rise in average check size. And for the other restaurants, the company saw a 3.4% drop in same restaurant guest counts that was offset largely by a 2.5% rise in average check size.
Author - SEC EDGAR Data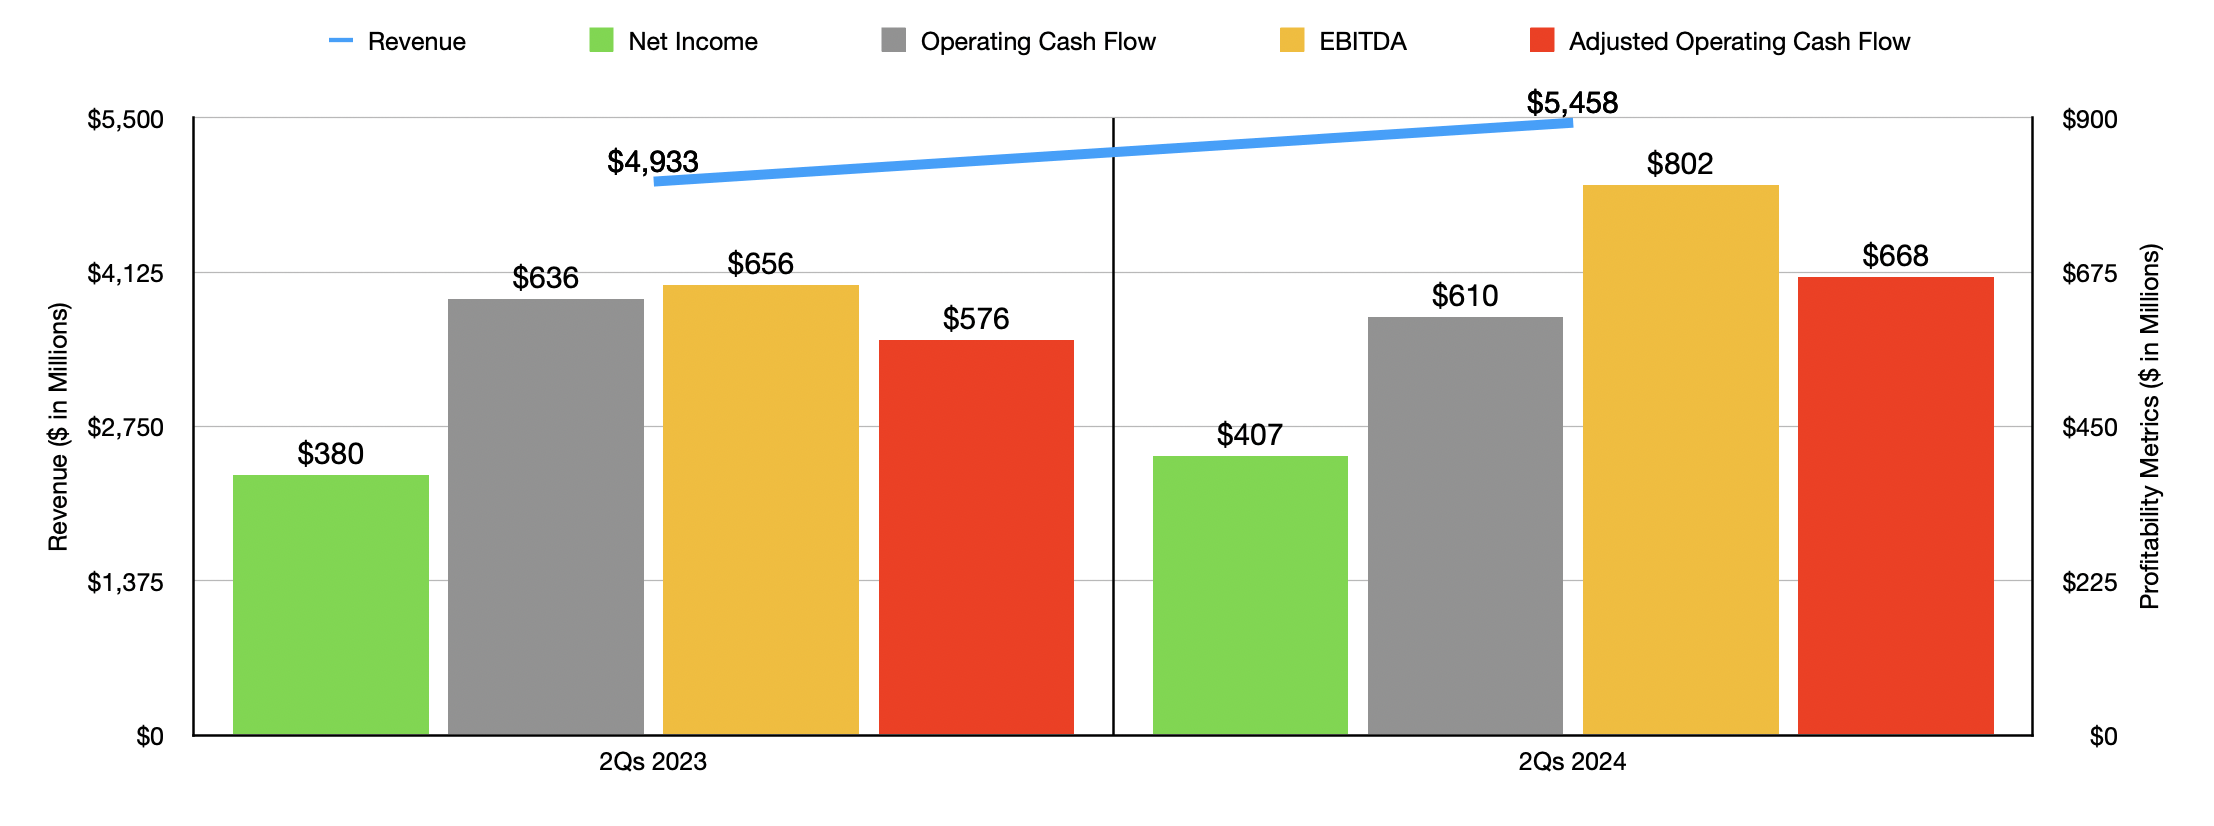
Higher prices and higher revenue driven by said prices naturally had a positive impact on the company's bottom line. Net profits expanded from $380 million to $407 million. Other profitability metrics largely increased. The one exception though was operating cash flow. It managed to drop from $636 million to $610 million. But if we adjust for changes in working capital, we get an increase from $576 million to $668 million. Meanwhile, EBITDA for the chain managed to rise from $656 million to $802 million.
Darden Restaurants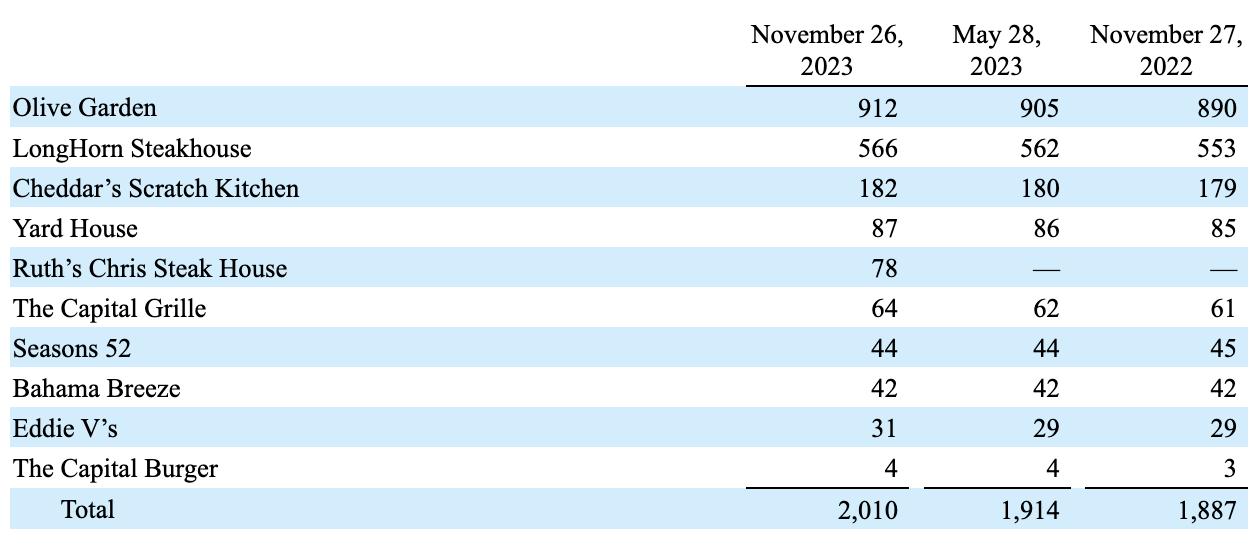
Darden Restaurants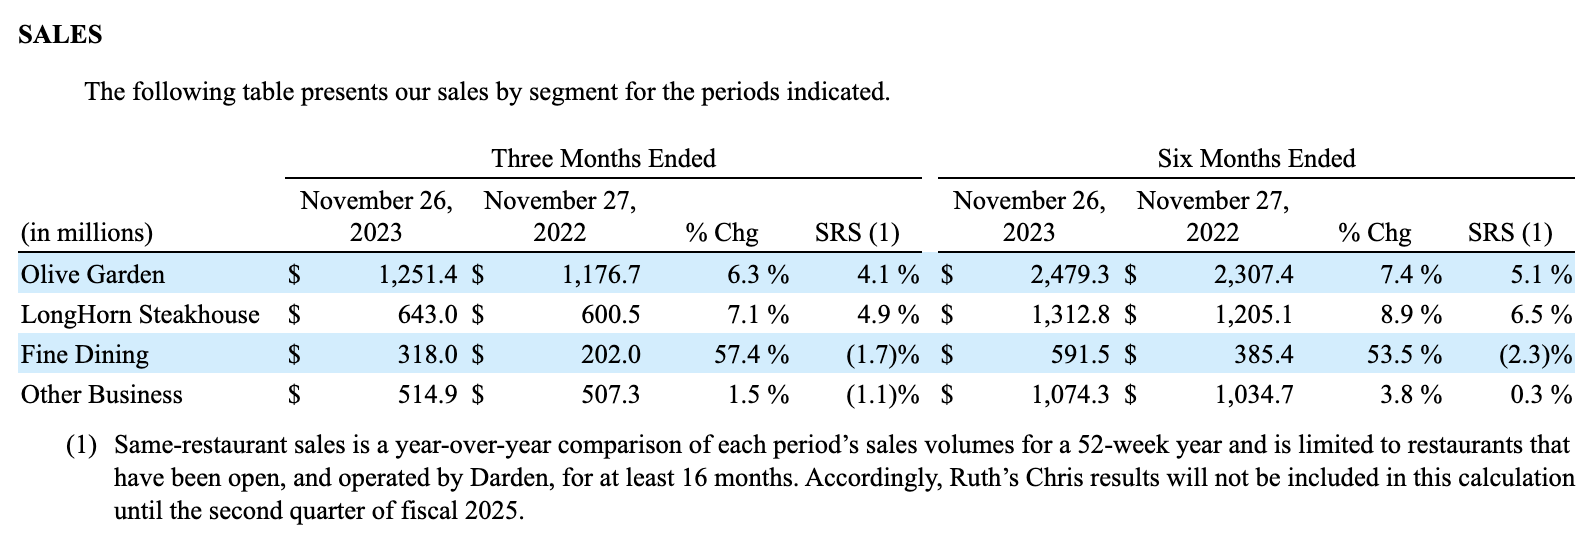
When it comes to the 2024 fiscal year in its entirety, management seems optimistic. They anticipate revenue of around $11.5 billion, with same restaurant sales growth of between 2.5% and 3%. A lot of the growth will also come from between 50 and 55 new openings, with much of the company's $600 million capital expenditure budget going to those new locations. Earnings per share from continuing operations, meanwhile, should be between $8.75 and $8.90. At the midpoint, that should translate to net profits of around $1.07 billion. Assuming other profitability metrics rise at the same rate, that would give us adjusted operating cash flow of nearly $1.50 billion and EBITDA of approximately $1.70 billion.
Author - SEC EDGAR Data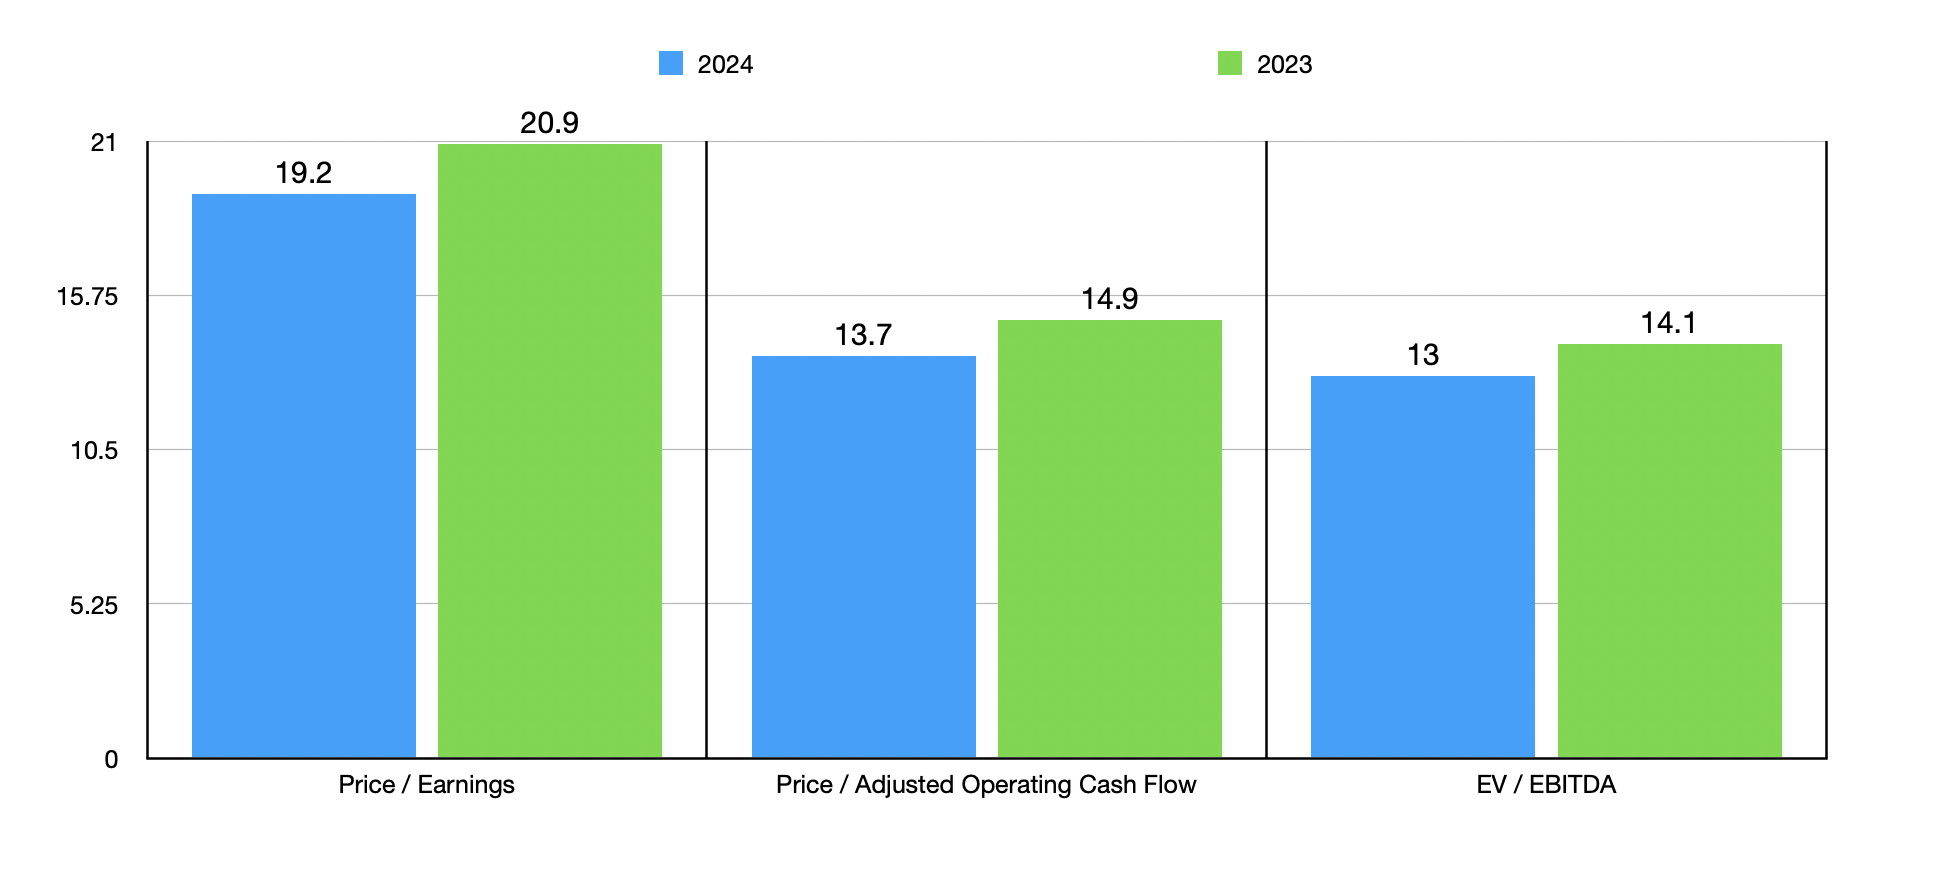
Taking these estimates, as well as historical results for fiscal 2023, I valued the company as shown in the chart above. The stock looks a bit pricey relative to earnings. But when it comes to cash flows, it doesn't look too bad. I then, in the table below, compared it to five similar firms. What I found was that, using each of the three valuation metrics, four of the five companies ended up being cheaper than it. This means that it's trading near the higher end of the range.
| Company | Price / Earnings | Price / Operating Cash Flow | EV / EBITDA |
| Darden Restaurants, Inc. | 19.2 | 13.7 | 13.0 |
| Texas Roadhouse, Inc. (TXRH) | 33.6 | 18.1 | 19.7 |
| Bloomin' Brands, Inc. (BLMN) | 11.3 | 5.2 | 6.1 |
| The Cheesecake Factory Incorporated (CAKE) | 17.3 | 8.0 | 11.1 |
| Dine Brands Global, Inc. (DIN) | 7.5 | 5.5 | 8.1 |
| Brinker International, Inc. (EAT) | 13.8 | 6.3 | 7.6 |
Naturally, this picture can change. An increase in guidance can make shares look more attractive, while a decrease in guidance could make them look rather pricey.
The good news is that, before the market opens on March 21st, the management team at Darden Restaurants is expected to announce financial results covering the third quarter of the 2024 fiscal year. Heading into that time, analysts are forecasting sales of $3.03 billion.
If this comes to fruition, it would be about 8.8% above the $2.79 billion generated the same time of the 2023 fiscal year. Earnings per share, meanwhile, are expected to be around $2.62. That would be up from the $2.34 reported the same time in 2023, translating to an increase in net profits from $287 million last year to $317 million this year. Unfortunately, estimates were not provided when it came to other profitability metrics. But in the table below, you can see what the important ones were are the company, and what they were for the third quarter of the 2023 fiscal year.
Author - SEC EDGAR Data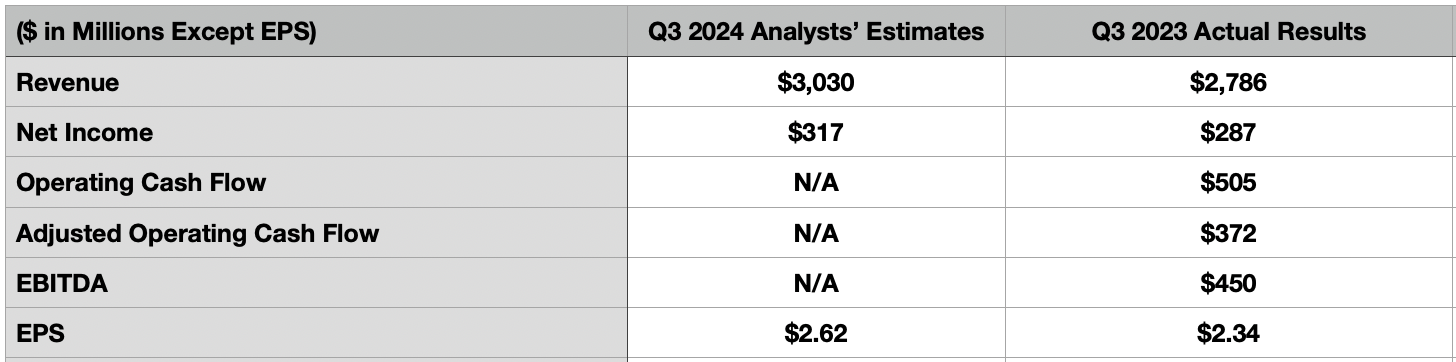
Heading into earnings, the fundamental picture for Darden Restaurants looks quite solid. I have no issues with the company from an operational perspective. As far as restaurants are concerned, it's fairly impressive.
But this doesn't make Darden Restaurants, Inc. stock an attractive opportunity. Shares are not exactly cheap enough for me to get a taste for. And relative to similar firms, it does look very expensive. If the picture changes when new data and guidance come out, my mind could change. But as things stand, I believe that the "hold" rating I assigned the stock previously still makes sense.