
wildpixel
wildpixel
I must acknowledge right off the bat that my hasty Sell call on ProShares UltraShort 20+ Year Treasury ETF (NYSEARCA:TBT) in early June came from a position of weakness, for returns at a certain point are temping to realize. I thought about low risk tolerance investors and saw it prudent to raise cash or invest at the intersection of growth and value. In this article, I attempt to rectify my miss and argue that TBT remains a Buy as the bond market has demonstrated clear downward momentum; the pain we are experiencing in the stock and bond markets is clearly the lagged effect of quantitative tightening. Technically and fundamentally, I find that the nature of correction takes time, and there are likely more advances in store for TBT price and volume.
I believe that the market and the Fed are often in lockstep or a form of equilibrium; however, the effects of the global pandemic, now just about four years old, have produced a Fed reaction so strongly dovish to hawkish that the subsequent market response must be equally affected, over time. The effects of monetary policy transmission are estimated to take 3-5 years according to the Quantitative Finance program at Wesleyan University. I argue that the momentum indicators suggest that the lags taking effect in the bond market will likely persist. The underlying fundamental indicators, such as the tone of forward guidance, the dot plot, and historical context indicate that this phenomenon of high and rising yields will persist for some time. I will begin with technical analysis before diving into a brief overview of the fundamental macroeconomic situation.
Pre Pandemic - Present Price and Volume (TradingView)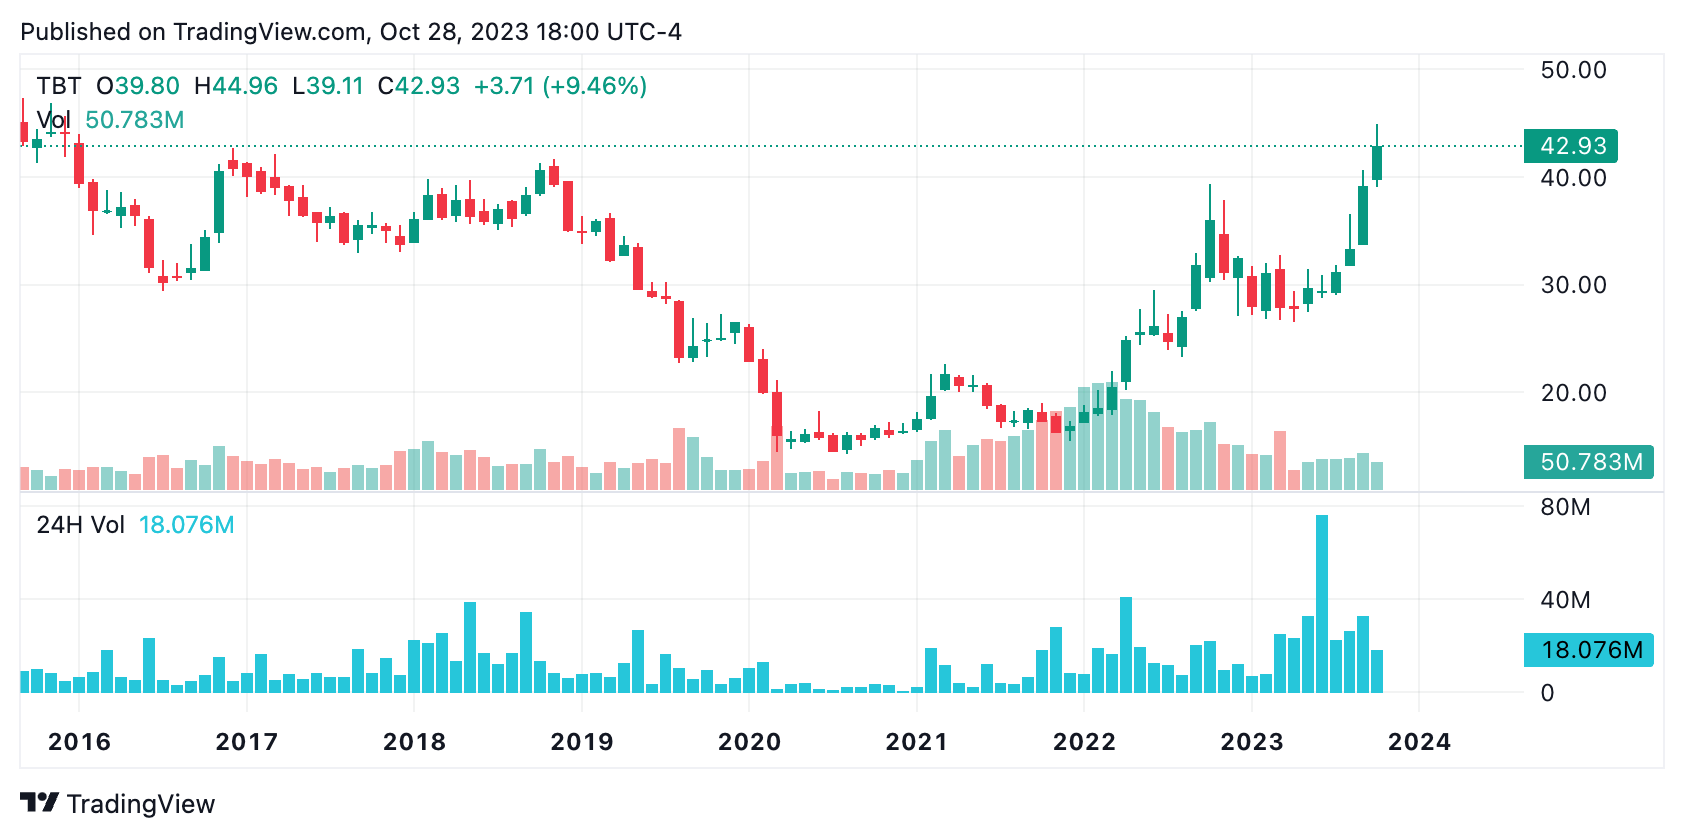
The chart above, from well before the pandemic through the present, depicts certain characteristics indicative of a new bull market for a security. First, I will point out that this chart is exhibiting an "inverse head and shoulders" formation. This is characterized primarily by the dual price consolidation around the high twenty dollar range. The third time advancing beyond the thirty dollar range, it broke above 40 dollars/share. In this latest advance, TBT breaks out of a long term downtrend from fund inception, on a line connecting major high points. Finally, it exhibits a variation of the "cup and handle," the cup and handle bottom, with major increases in volume over the long run. This last volume point emphasizes that institutions are accumulating these shares as more money pours into the market as confidence in these instruments grows. Recent contractions from volume peaks in mid 2023 indicate bond insurance sellers are growing concerned about the bond market on which they earn billions annually. I foresee the offloading of bonds from balance sheets to raise capital for higher interest transactions and the insurance sellers to stop selling, before they ultimately start covering and squeezing prices higher.
Given the high rate of core inflation, more than double the target, we would expect this vehicle to be trading higher than it is. Afterall, the ratio of inflation/interest when TBT went public at all time highs was much lower than it currently is. I take this ratio, or differential, as the key factor in the valuation of this instrument, as the greater the inflation, the greater the interest rate as a rough premise. However, the greater this ratio is with respect to the magnitude of the inflation problem, the difference between observed and target inflation, the more probable are rate increases. High inflation with relatively low interest rates is my best indicator of interest rate appreciation. This analysis does depend on the Fed's allegiance to its word that the target is absolutely and still 2%. I anticipate that we see the market run interest rates over time to an equilibrium, where they need to be, with no further liquidity injections to be expected. In short, the market will lead the Fed.
Federal Reserve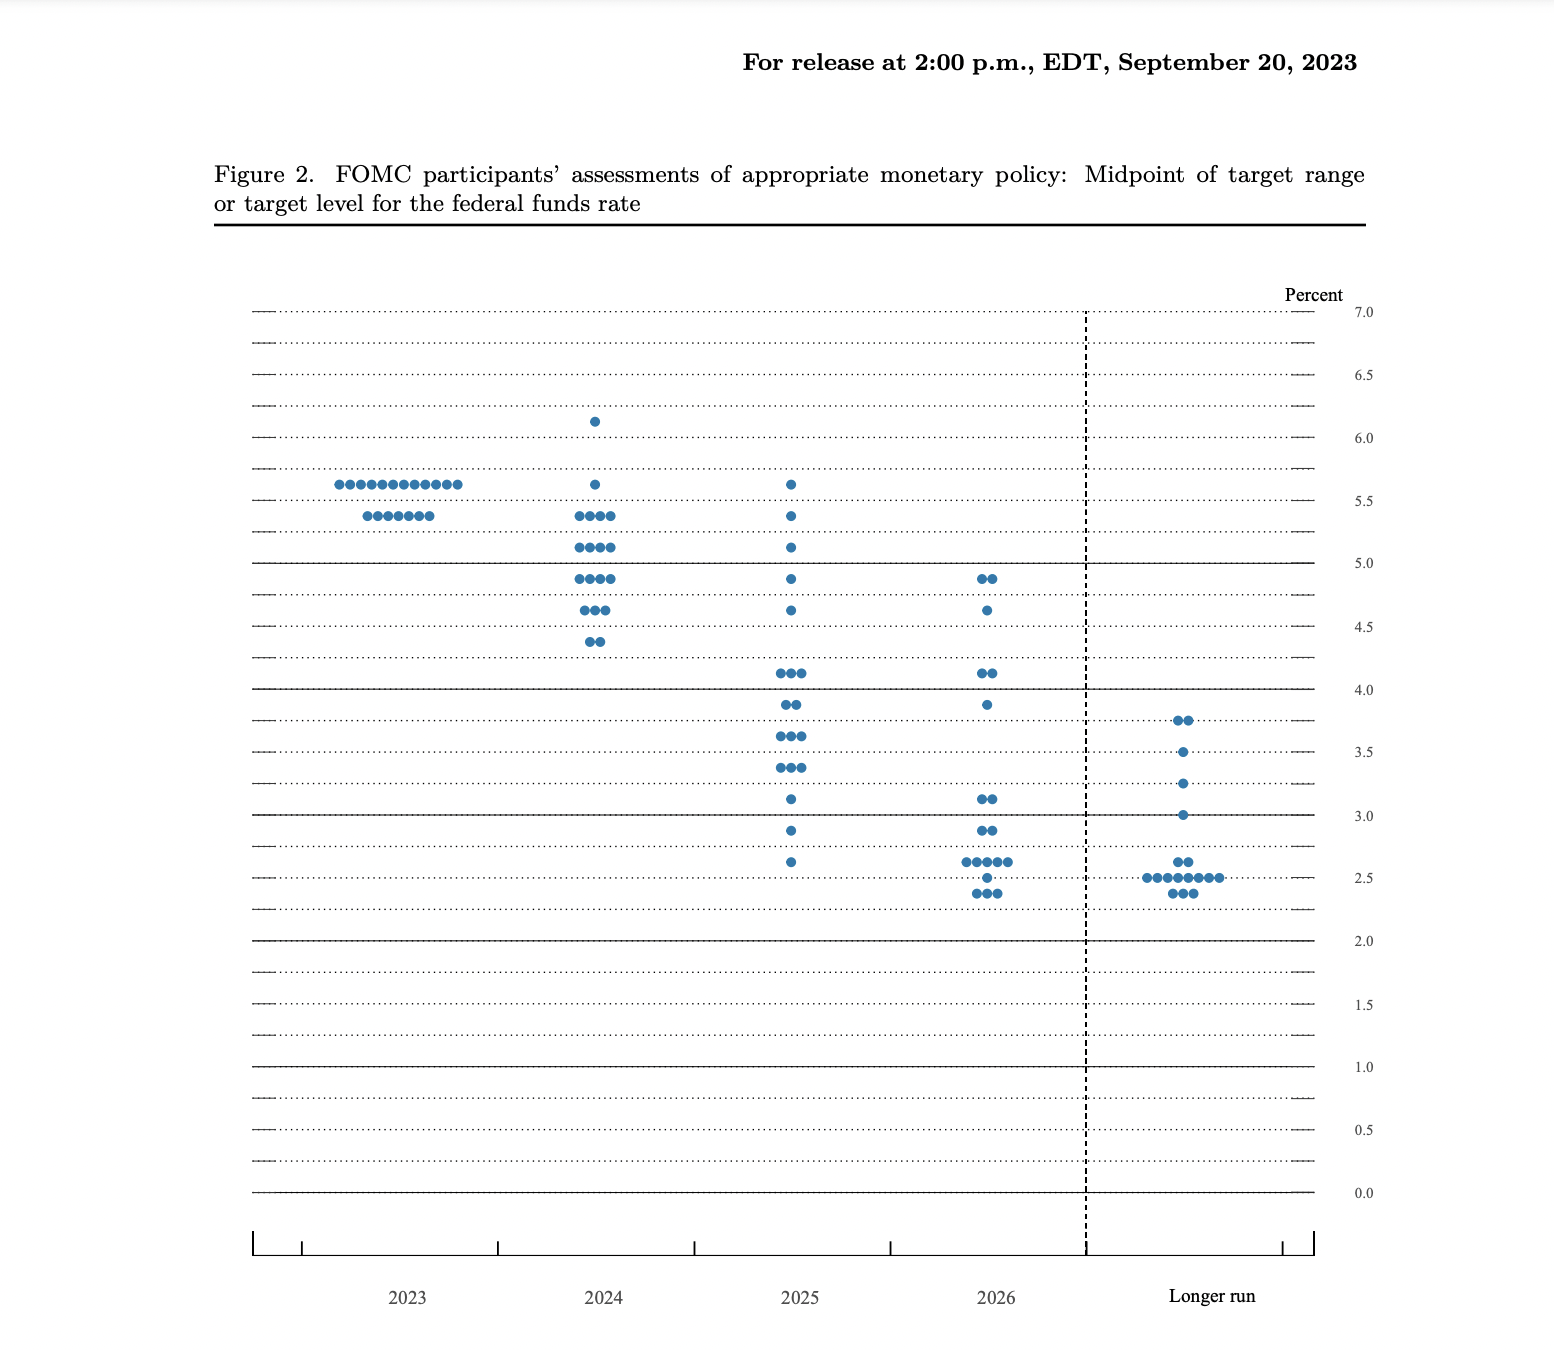
The main point in the chart above is that although the Fed is guiding rate cuts as early as 2024, a growing coalition sees rates hovering around current consensus levels or higher. For the remainder of 2023, the majority expects interest rates to be held constant. In the final two months of 2023, it is still unknown how the retail sector will react during holiday season to interest rates that have increased about 47%, or 5.5%/3.75%, from the lows during holiday season around this time last year. With the Federal Reserve unlikely to liquidate any issued debt obligations much while demand for money is high, expect first a further increase in interest rates as financing of production becomes more expensive, and goods and services inventories decrease quickly, prices to rise, and a real economic contraction to occur. I therefore expect the Federal reserve to revise the outlook to a more hawkish one in response to measures of stagflation. Unemployment remains low, around natural rates, and the sad truth is that unemployment can increase motivation to achieve a career match, which reflects Jerome Powell's view that we "need" more unemployment in the economy.
As I've written before, this instrument is meant to be a short term and tactical holding rather than an investment to be held for years. The momentum and burgeoning story suggest that risks outweigh rewards in TBT for a medium term hedge. Remember that this is leveraged, tracking -2x the daily performance of the ICE U.S. Treasury 20+ Year Bond Index. It invests primarily in interest rate swaps, which decay in value as options do over time. This loss in value over time suggests that quicker holding periods are recommendable to capture fast movements in the underlying securities. Leading agencies cation against leveraged ETFs. FINRA warns, "While there may be trading and hedging strategies that justify holding leveraged and inverse ETPs longer than a day, investors with an intermediate or long-term time horizon should carefully consider whether these products are appropriate for their portfolio. You could suffer losses even if the longer-term performance of the underlying index is up for a leveraged ETP or down for an inverse ETP." the SEC also warns, "Most leveraged and inverse ETFs “reset” daily, meaning that they are designed to achieve their stated objectives on a daily basis. Their performance over longer periods of time -- over weeks or months or years -- can differ significantly from the stated multiple of the performance (or inverse of the performance) of their underlying index or benchmark during the same period of time. This effect can be magnified in volatile markets." This is so because of the nature of the coefficient compounding backwards and forwards; click the link above for examples. Lastly, leveraged ETFs are relatively expensive when compared with their peers. ProShares Short 20+ Year Treasury ETF (TBF) is still an option for those taking a more risk averse approach, and ProShares UltraPro Short 20+ Year Treasury ETF (TTT) is for those who take a more risk-affine approach, with -1X and -3X exposure respectively.
In this article I revise my rating of TBT to a Buy from a Sell. A more mature read on the evolving macroeconomic landscape and trade momentum suggest that the market will lead the Fed into a real economic contraction driven by a supply shock in the money market timed when our consumer economy enters the new holiday season. I believe a sharp run up in the price of TBT is not out of the question and simultaneously that traders may be better off holding a stronger hand in this fund as transmission time approaches the end of 2024. If there is a rate cut when the Federal Reserve begins presenting this final week of October, 2023, I recommend this as an opportunity buy a dip in TBT. There are of course many other factors to consider such as leverage on leverage and options plays in the exotic derivatives markets. I finally reiterate that this opportunity is for sophisticated investors with a comprehensive understanding of the current debates in the fields of macroeconomics and finance and the risks associated with such speculation. This piece reflects my honest market outlook on 10/30/2023 as I write and is subject to change, revision, or follow up to be published exclusively on Seeking Alpha.