
R.M. Nunes
R.M. Nunes
Sixth Street Specialty Lending, Inc. (NYSE:TSLX) is one of the largest BDCs with a NAV of close to $1.5 billion. Over the past 5-year period, TSLX has outperformed the broader BDC market in a quite consistent manner. What is rather TSLX-specific is that the Fund trades at a relatively notable premium over NAV, which makes it the fourth most expensive BDC with P/NAV of 1.21x.
However, investors have to, first of all, understand that there is a justified basis behind that premium, and, second - TSLX has traded at similar premiums over the underlying NAV over most of its trading days.
Early January this year, I wrote an article comparing TSLX with Main Street Capital (NYSE:MAIN), which is also commonly considered one of the strongest and resilient BDCs. While both BDCs seemed enticing, MAIN's premium at ~1.5x was, in my opinion, just too wide to explain the fundamental difference from TSLX. In fact, my thesis was that even if MAIN and TSLX traded at the same multiples, I would still opt for TSLX given the following:
Now, in mid-February, TSLX circulated Q4, 2023 earnings report, which has revealed several interesting dynamics that together strengthen the thesis even further.
Let's now walk through the key figures and events of Q4, 2023.
Before we dissect the earnings, let's quickly establish a baseline of what has been happening in the BDC market lately.
While the overall BDC market experienced a strong push at the beginning of 2023, once the banking sector started to recover and the overall M&A environment deteriorated, most BDCs became subject to net investment outflows later in the year. Sourcing fresh volumes has turned out to be rather difficult when one of the key avenues of deal origination is in a major decline. On top of that we could add growing liquidity reserves of BDCs and increasing competition both of which render new deal origination more difficult.
As a consequence of lower demand and still robust supply (i.e., lenders, who are willing and able to lend in private space), the spreads have been increasingly experiencing a downward pressure. This means that incremental investment volumes contribute less to adjusted NII generation. Furthermore, such dynamics introduces a risk of eventually dropping adjusted NII if no meaningful growth is recorded at the portfolio level. Namely, BDCs have to grow their portfolios (i.e., focus on volume) in order to combat the effects from margin compression as the previously issued higher yielding investments are gradually replaced with lower yielding ones.
Finally, some BDCs have already registered notable upticks in non-accrual investments, signaling that the period of "ultra-low bankruptcies" is quite naturally changing or converging back to a more normal level.
Now, if we assess TSLX's earnings report, we will notice that the Management has done an excellent job in navigating the aforementioned headwinds.
One of the most important metrics - adjusted NII per share - has increased for a third quarter in a row, reaching $0.62 per share. What is also worth underscoring is the situation in the NAV front, where the values have been slowly but surely marching higher since Q4, 2022 despite TTM dividend yield (distribution of capital) of ~9.5%.
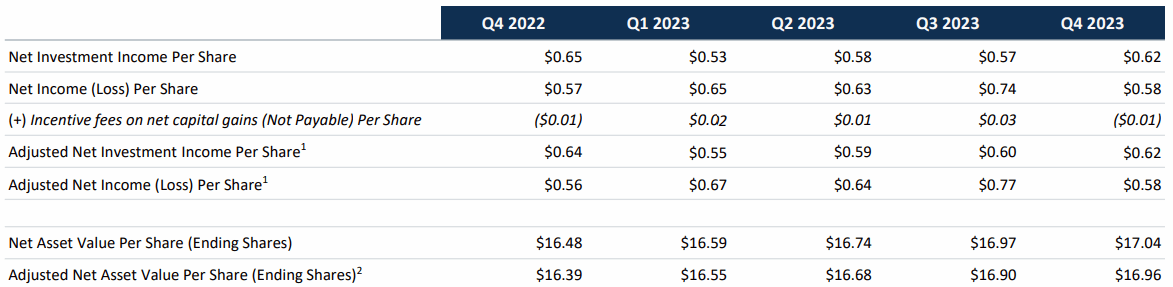
Earnings Presentation
If we peel back the onion a bit, we will notice two drivers that have explained this strong performance.
First is the positive net investment activity, where TSLX experienced a growing asset base over 2023 period. This should be viewed quite positively given that many (especially smaller size) BDCs have struggled to maintain status quo in their portfolio values. For TSLX the asset base has expanded for the third quarter in a row, registering a bit more notable increase in Q4, 2023.
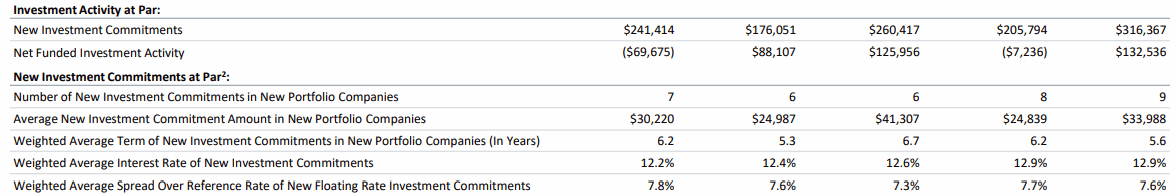
Earnings Presentation
Interestingly, as the table above indicates, TSLX has managed to keep the weighted average spreads fairly consistent at ~7.5% levels that helps mitigating the risk of at least near-term pressure on the adjusted NII generation.
Here one might speculate that TSLX has been so successful both yield and volume wise because it has relaxed some of its underwriting standards just to get the deal flow through.
Yet (and this is a nice segway to the next driver of TSLX performance), the portfolio quality has been maintained at very robust levels.
The performance rating of TSLX's portfolio companies continued to be strong in Q4, 2023, with a weighted average rating of 1.16 times on a scale of one to five (one is the strongest - i.e., performing above expectations - and, five is effectively a non-accrual). During the quarter, the average rating actually improved from 1.17 in Q3, 2023 to 1.16 now.
Even if we look at the chart below, we can see that the exposure to cyclical investments has continued to shrink, playing a marginal role in the overall TSLX portfolio.
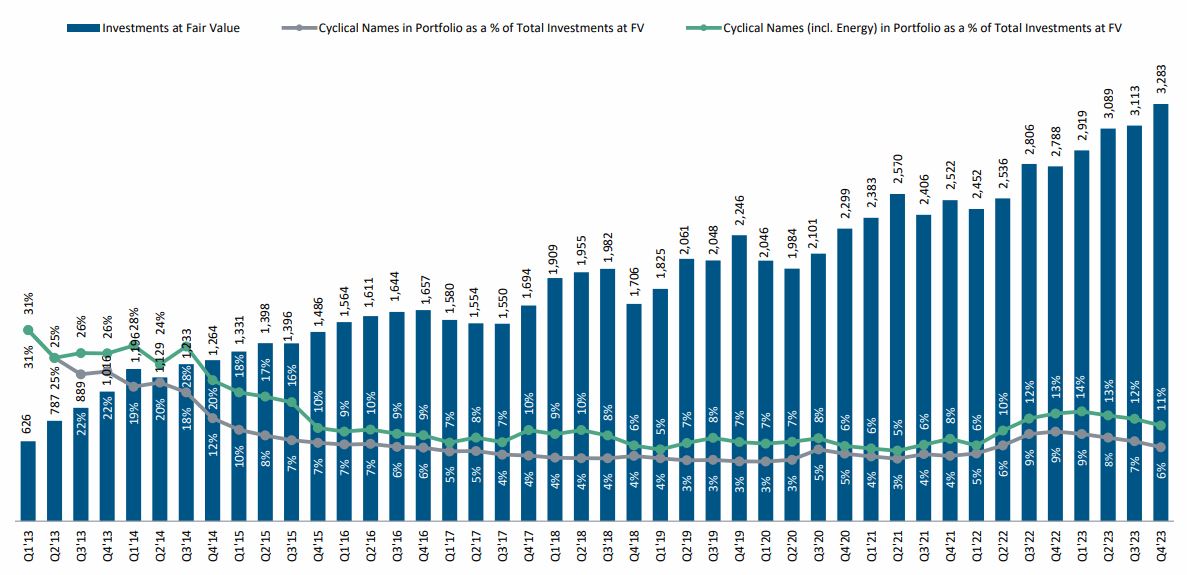
Investor Presentation
Moreover, the weighted average revenue and EBITDA of the portfolio companies both increased 6% on a q-o-q basis that further confirms the fundamental strengthening of TSLX's profile.
Finally, as opposed to more and more BDCs, TSLX did not register an increase in its non-accrual stock. There was only one portfolio company under non-accrual status, representing less than 1% of the portfolio fair value.
In a nutshell, TSLX delivered a rock-solid performance in all of the most important fronts of BDC business - e.g., expanding adjusted NII generation per share basis, positive net investment flows and strengthening portfolio quality.
All of this was achieved despite the prevailing headwinds on the industry-level, where many BDCs are increasingly suffering from negative net investment flows, spread compression and deteriorating portfolio quality via growing non-accruals.
In my opinion, TSLX continues to be well-positioned to deliver solid returns on a go forward basis. The huge exposure to first lien, overweight of non-cyclical and cash generating businesses in combination with improving portfolio quality from already strong base levels provide the necessary characteristics to go long the BDC.