memoriesarecaptured
memoriesarecaptured
My "Hold" thesis for Tootsie Roll (NYSE:TR) is based both on my quantitative pricing methods, which indicate that the stock is already priced according to its intrinsic value, and on the analysis of operability and margins. The latter indicates lower margins than ideal for a small, low-growth company, which should be focused on keeping costs as low as possible. The lack of proportional adjustment of COGS with revenue occurred precisely during the period in which turnover increased, indicating that the company will not be able to maintain increasing margins in a scenario of increased turnover, as we are planning for 2024.
In my opinion, it would be safer to see the increase in the return on equity established in accordance with the improvement in margins, and not just by the increase in turnover. The company has no liquidity risk and its structure is extremely healthy. It is an interesting purchase when the price is appropriate, I see no window for a potential upside in the medium term, as the share is priced according to an implied growth of approximately 11%.
According to the company's official history, Leo Hirshfield, an Austrian-Jewish immigrant to the United States, began his career in the candy business in New York in 1896. He founded Tootsie Rolls in 1907, naming the candy in honor of his daughter “Tootsie”. After his death in 1922, the company struggled until it was acquired by the Rubin family in 1935. Under Bernard Rubin, the company prospered, changed its formula and expanded its operations to Hoboken, New Jersey. Ellen Rubin Gordon has been the company's current president and CEO since 2015.
Tootsie Roll features a variety of recognized candy brands such as Tootsie Roll, Tootsie Pop, Charms Blow Pop, Mason Dots, Andes, Sugar Daddy, Charleston Chew, Dubble Bubble, Razzles, Caramel Apple Pop, Junior Mints, Cella's Chocolate-Covered Cherries and Nik-L-Nip.

Brands owned by Tootsie Roll (Tootsie Roll)
Tootsie Roll is headquartered in Chicago and has operations in Illinois; Massachusetts; Tennessee; Wisconsin. Internationally, the company is geographically present in Mexico City and Concord, Ontario. The distribution of Tootsie's products is carefully planned, connecting its factories with retailers such as convenience stores, e-commerce platforms, the official Tootsie website and selected retail outlets, ensuring wide availability for consumers.

A patriotic advertisement for Tootsie Rolls during World War I (Tootsie Roll)
Tootsie has a deep-rooted history in the United States, especially at the turn of the century when the brand was at the height of its popularity. Although it may have lost some of its strength today, Tootsie remains an iconic figure in American history and culture, and is present in stories dating back to the First World War.
On the other hand, just as the company has a long history of ups and downs in the United States, it is unable to develop its brand for the foreign market, unlike what The Hershey Company (HSY) did, for example. This limits revenue expansion and, consequently, translates into a much less responsive asset rotation, since its expansionary potential for revenue growth is limited.
Tootsie needs to position itself in a way that understands its place in the market. If the company is planning to remain a national, financially healthy and non-leveraged company, maintaining the business in a simple and controllable manner, it must maintain excellent margin performance. Take advantage of below-average turnover to generate more profits with less revenue.
In this way, by maintaining its margins in a controlled manner and maintaining an operating position focused not only on the product, but on production efficiency, Tootsie will be able to maintain itself in a saturated market taken over by giants, which, leveraged, maintain their presence globally. Tootsie, focusing on its target audience and improving its operations, is ready to maintain itself in perpetuity, slowly and always.
I will begin the fundamental analysis of Tootsie Roll Industries by scrutinizing the delimitation of the company's capital structure, verifying the dissonance between the sources of capital internalized by the company and its proper allocation of the same in assets.
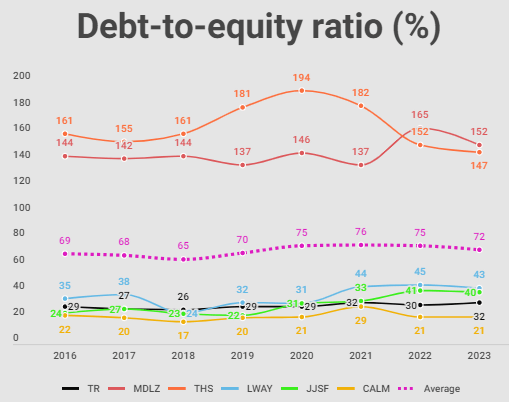
Tootsie's debt-to-equity ratio in perspective through the years (Author)
Tootsie Roll remains at conservative levels when we consider the participation of third-party capital in the composition of the source of resources used, maintaining an average of 29.25% of the proportion of third-party capital to equity. This number indicates Tootsie's small dependence on third-party capital.
Given Tootsie's management behavior pattern, we can infer that the company is opting for growth that avoids unnecessary leverage. However, as I always say, when it comes to capital structure and sources of financing, we always need to look at the cost of capital, both our own and third parties, and analyze what the cost of raising resources is through each route.
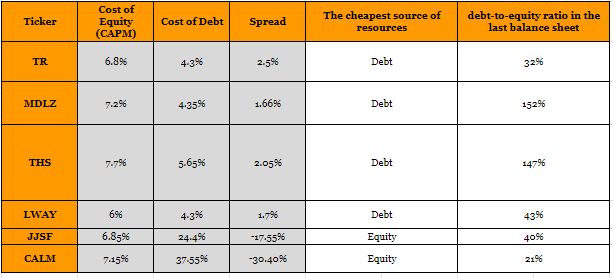
Sources of financing and the respective cost of capital (Author)
When we compare Tootsie's Return on Equity with the Cost of Equity, we can see whether the company is generating a return above what it is using for this form of capital.
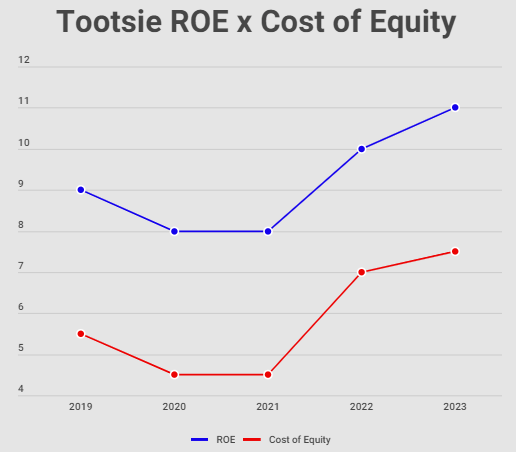
Tootsie return on equity x cost of equity (Author)
Tootsie, as shown in the graph above, achieves a positive spread of approximately 3.5-4.5% between the cost of equity and the return on this capital contributed between shareholders as a result of Tootsie's operations.
In the same vein, it is important to highlight that both the Profitability of Assets when compared to WACC and the Profitability of Third Party Capital when compared to the Cost of Debt, both point to a positive profitability from the use of different types of capital in Tootsie's operations. Therefore, we can see this company's preference in using equity capital as a managerial preference in the orderly control of leverage, despite the cost of debt capital being lower than the cost of equity, and this is a prudent attitude on the part of managers.
Still on leverage, it is up to us to identify two types of very important indicators that are often forgotten by analysts: the Degree of Financial Leverage and the Sustainable Growth Indicator.
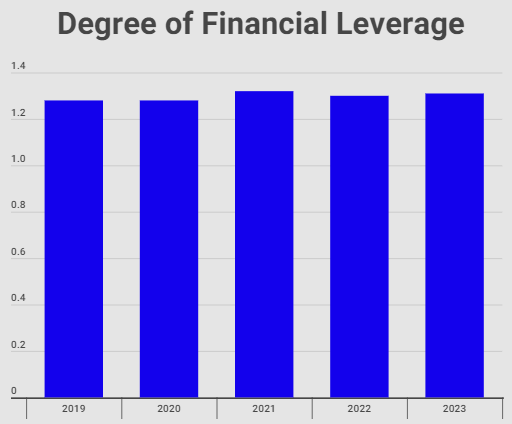
Tootsie's financial leverage level since 2020 (Author)
Here, it's clear that company administrators utilized external resources to enhance shareholder results. This is indicated by the Degree of Financial Leverage, which shows that shareholder returns surpassed the overall company returns. In other words, the Return on Equity (ROE) exceeded the Return on Assets (ROA). Considering that ROE represents the return generated specifically for shareholders based on their investment, this suggests that the company effectively boosted its returns by employing leverage. We can infer this due to the relationship found in the degree of financial leverage, which indicated a result greater than 1 during the years analyzed.
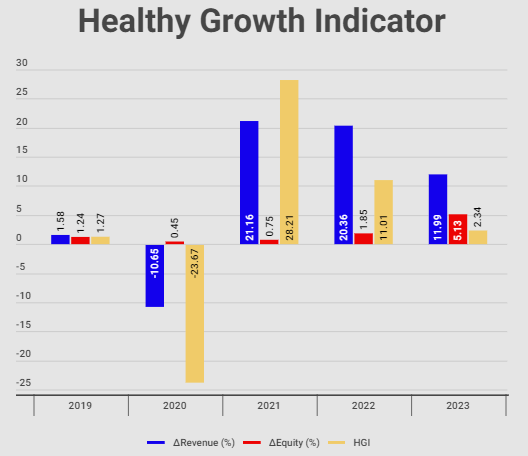
Healthy growth indicator: important, but contains intrinsic limitations (Author)
The Healthy Growth Indicator aims to verify the direct relationship between revenue growth and equity growth. Extremely conservative in nature, it has the premise that growth in revenue is only sustainable when there is a balance with equity, therefore, the ideal benchmark would be uniform growth. However, this may not actually be the case in practice, as revenue growth is often driven by different factors, such as changes in market conditions, marketing strategies, launch of new products or services, among others.
Still talking about the capital structure, leaving aside the discussion about the profitability of Tootsie's different sources of capital and turning to the structure of third-party capital used in the company and in the sector, I will highlight below the percentage of debt obligations short term in relation to the total obligations of each company, this way I will arrive at the debt profile of these companies.
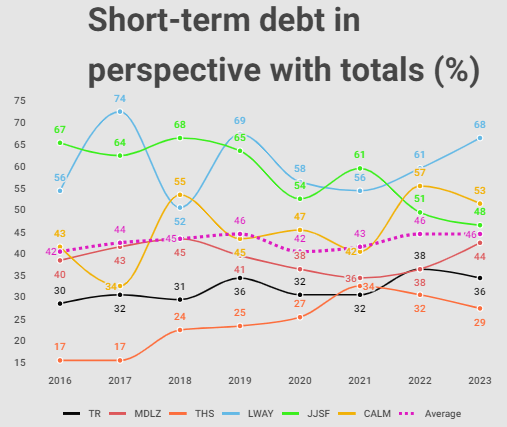
Analysis of Tootsie's debt profile in perspective with other companies over the years (Author)
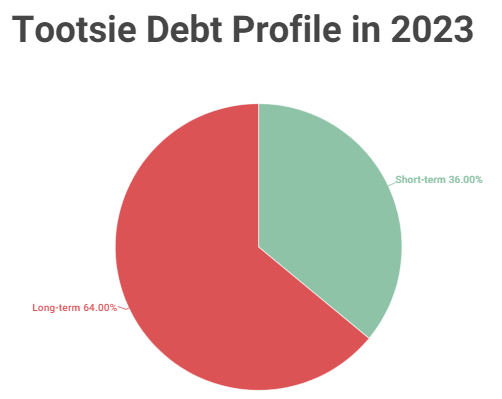
Tootsie debt profile analysis (Author)
Tootsie stands out as one of the companies with one of the best debt profiles in the sector, with an average of 33% of its debt maturing in the short term. The sector average is 44%.
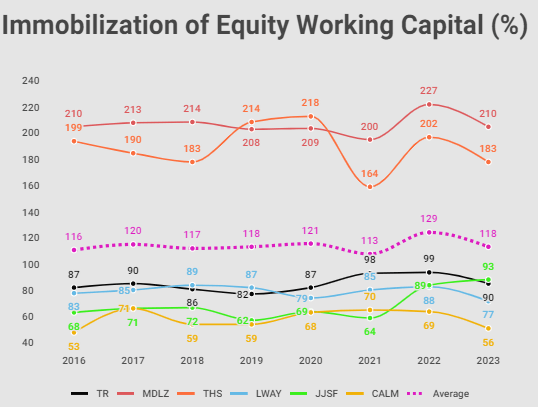
Immobilization of Tootsie's equity working capital over the years (Author)
Regarding the proportion of equity capital that was immobilized and the presence of own working capital in Tootsie's operating cycle, we can observe from the graph above, which illustrates the proportion of equity immobilized, that the company still maintains 10% of its net equity for the financing of its current assets, representing its own working capital.
Own working capital is the portion of equity invested in current assets, and which has not been fixed. This means that this equity flows through Tootsie's current assets and that the company currently maintains $8.234 million to maintain the financing of its commercial turnover, and, in this way, is not dependent on external financing for its daily and more liquid operations.
Therefore, I will list below the evolution of own working capital included in Tootsie's current assets.
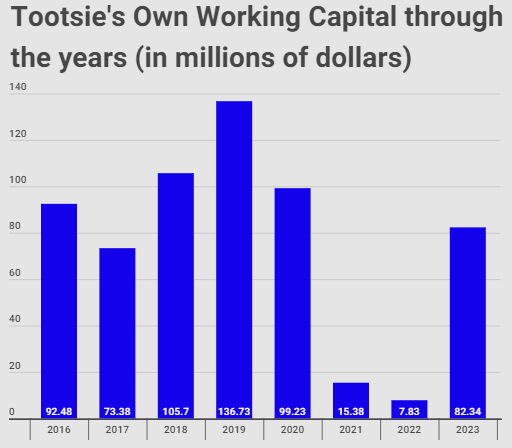
Tootsie's own working capital through the years (Author)
We were able to observe the deterioration of Tootsie's own working capital during the years 2021 and mainly 2022, when the amount of non-immobilized assets that went to daily operations fell by 88.75% and 94.27% if we compare with the year 2019, which was the year in which Tootsie had a more robust working capital of its own.
But what explains this depletion of own working capital in 2021 and 2022? Own working capital responds to two different stimuli: the difference between total assets and current assets (i.e. permanent assets) and the amount of equity. When comparing permanent assets with equity, we find the percentage of equity that was immobilized. Therefore, we can infer that the depletion of net working capital was not due to a decrease in equity, but rather due to a 32% increase in long-term investments (realizable over a period of more than one year). Therefore, I do not see this depletion as a bad thing, but rather as a cautious capital allocation.
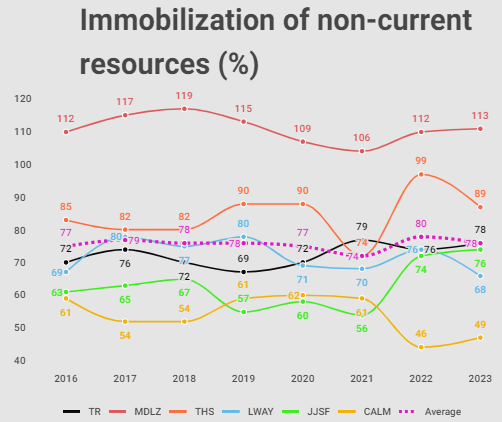
Immobilization of Tootsie's non-current resources over the years (Author)
Tootsie allocates an average of 74.25% of its non-current resources to fixed assets, this means that it keeps 25.75% of non-current resources for working financing, and this is more than what is necessary for the working capital needs from Tootsie. As a rule, this index should not exceed 100%, since dependence on short-term resources to finance turnover is highly dangerous, depending solely and exclusively on the period's cash flow to pay these short-term obligations, being completely at the mercy of economic fluctuations.
Once again I would like to emphasize, if a company is able to maintain its own working capital, it is a very favorable situation, since this capital is not callable. However, if the company is unable to maintain its own working capital, but maintains an adequate net working capital, with long-term debts and accommodative interest rates, the company will be able to immobilize all of its own working capital.
Now, when the company immobilizes all its own resources and long-term liabilities, its turnover will depend on short-term resources, and this is not a comfortable position to be in. Therefore, in my stock picking, I prioritize actions that can maintain good net working capital.
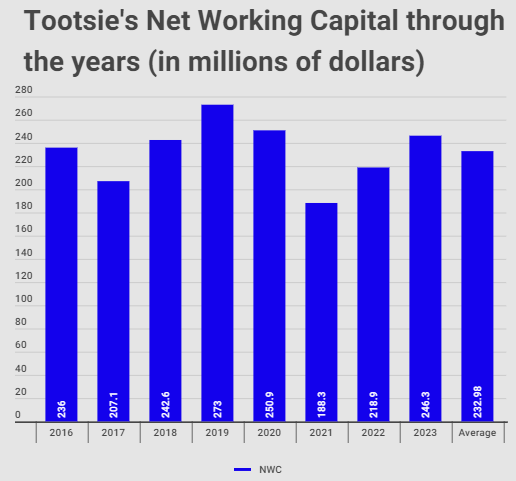
Tootsie's net working capital through the years (Author)
Despite the decrease in net working capital, largely due to the below-average result, the company had a small contraction in its current assets, mainly in its cash (Tootsie also increased its sales period to attract more customers, increasing receivables that same year). Recently, with the normalization of revenue, Tootsie has maintained net working capital at normal levels, slightly above average, without any need to use third-party resources to finance its operations.
Now I will analyze Tootsie's liquidity, and, consequently, its ability to meet its obligations using its resources at the balance sheet date. Despite being 'static', these indicators will give us some idea of Tootsie's solvency conditions over various time horizons.
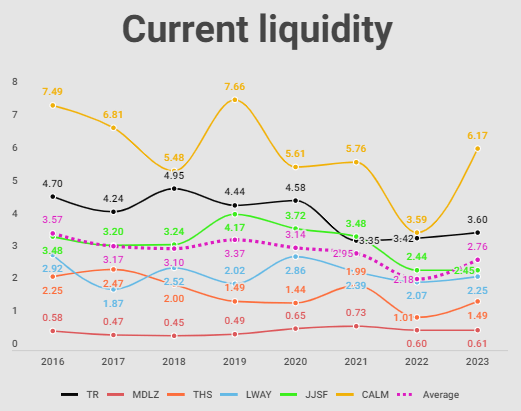
Comparison of Tootsie's current liquidity in perspective with other companies (Author)
Observing the current liquidity indicator gives us an idea of the abundance of liquidity that Tootsie has, surpassing the industry average in all periods analyzed. But in addition to current liquidity, which can often mislead the analyst, since it considers some assets that are not so liquid (such as inventory) and biases the solvency analysis, we must consider other types of liquidity, such as the acid test ratio and immediate liquidity.
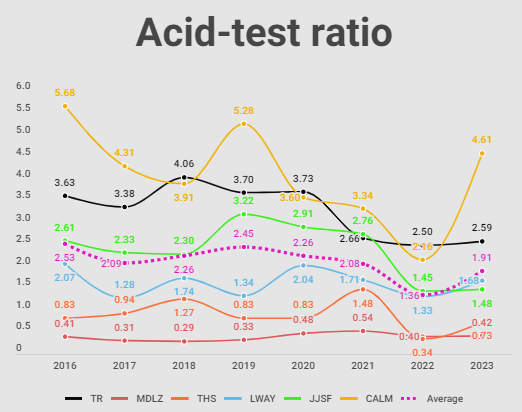
Analysis of the acid-test ratio in perspective with other companies (Author)
When we exclude stocks from the liquidity analysis based on the acid-test ratio, we change the conditions of the indicator by only considering current assets with high convertibility. Therefore, we can say that Tootsie Roll, even disregarding inventories, has liquidity well above the industry average and is healthy as a whole.
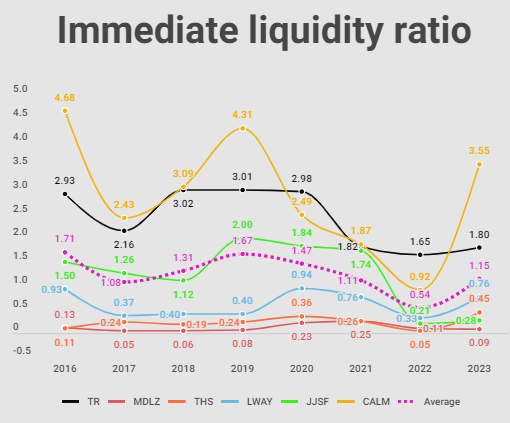
Analysis of the immediate liquidity indicator in perspective with other companies (Author)
To calculate Tootsie Roll's immediate liquidity, I also use cash allocated to short-term financial investments, when they exist, as cash available. From the data obtained, we can identify Tootsie's liquidity situation as exceptional, presenting performance in all three liquidity indexes that is much higher than the industry.
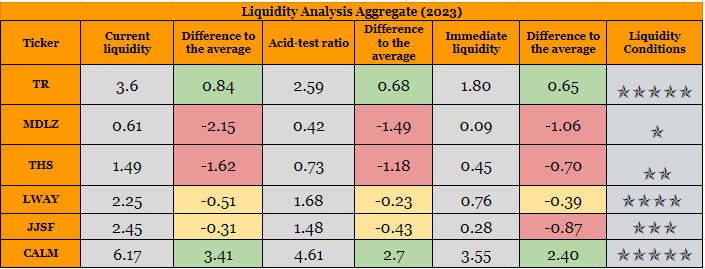
Aggregate liquidity analysis of Tootsie and other companies based on year 2023 (Author)
After analyzing Tootsie's liquidity, I will now analyze the profitability of the operation, observing the margins and profitability achieved through the company's main operations.
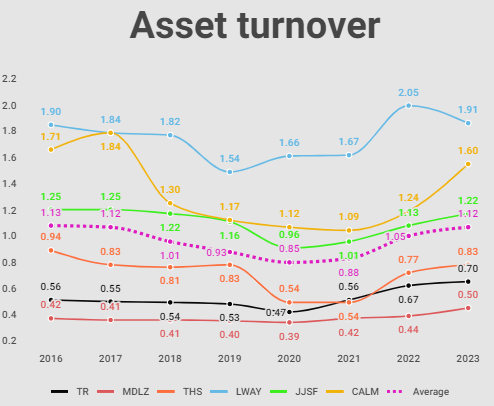
Tootsie's asset turnover in perspective with other companies analyzed (Author)
Tootsie's asset turnover indicates an ability about 37% lower than the industry average to generate revenue from its revenue. Despite this, the trend indicates an upward trend due to the marginal increase in revenue after 2020 and 2021. However, we must look beyond turnover to margins, which are the only way for the company to maintain the substantial sales provided by the turnover analysis. There is no point in high turnover and low margin.
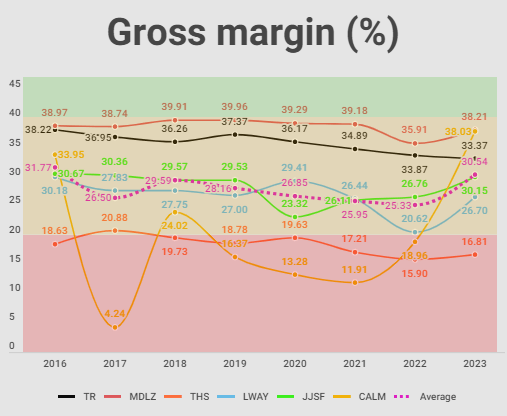
Tootsie's gross margin in perspective with other companies analyzed (Author)
Despite the recent decline in Tootsie's gross margin, it is still higher than the industry average. One point I focus on is that the company is unable to maintain the COGS parameterization in relation to the marginal increase in revenue in recent years (that is, the company is unable to maintain a stable gross margin when revenue increases), this implicitly infers that, due to need to increase asset turnover, which if it is below the sector average, the increase in revenue would only come through an unwanted increase in COGS, reducing its total profitability. In other words, under current operating conditions, revenue growth would only materialize through a deterioration in gross margin.
Therefore, Tootsie finds itself in a delicate situation regarding the operability of its assets and the fixed cost panorama: if it increases revenue in relation to its assets, gross margin falls, if it focuses its attention on operability and efficiency, your asset turnover drops as revenue will decrease.
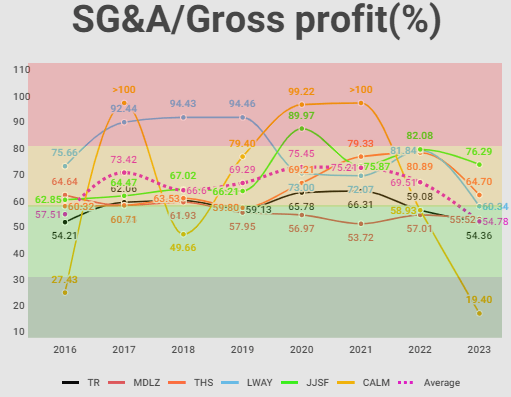
How much of its gross profit does Tootsie spend on SG&A (Author)
Tootsie maintains an average of 60% of its gross profit allocated to SG&A expenses. In my benchmark for finding stocks with some type of durable competitive advantage, I would consider this level as acceptable, but there is still a lot that management can improve. A positive point is that, as there are no sudden fluctuations in gross margin, SG&A expenses remained predictable and stable.
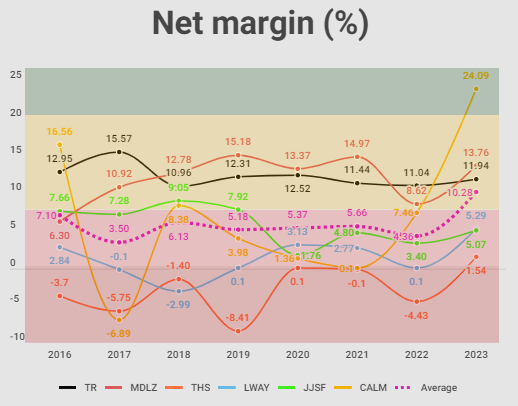
Tootsie's net margin compared to other companies analyzed (Author)
The net margin points to a tendency to stagnate at mediocre levels, Tootsie, through its margins, demonstrates certain maturity in its operations, since turnover has been decreasing for some time, but, on the other hand, we do not see mature development on the part of margins, showing mediocre results. We would like to see here, for example, a result constantly above 15%, demonstrating predictability and responsiveness in cost control, but what we saw is a result slightly above average. As the company is not in debt, my concern is certainly not with the continuity of activities, but with stagnation.
Following the orthodoxy of financial statement analysis using DuPont, through the profitability analysis model, the greater the turnover, the greater the possibility of reducing the net margin, and the greater the net margin, the greater the liberality in dealing with turnover. It turns out that Tootsie is maintaining a much lower turnover than the market average and maintains mediocre margins.
As the marginal increase in turnover causes visible distortions in the COGS, I would suggest Tootsie to work on improving margins, through production process efficiency, to keep margins ready for the future marginal increase in turnover. Working now on new low-cost SG&A techniques would be desirable, as the next step after improving margins would be to increase turnover through an increase in revenue.
Following the profitability analysis, we can compare the return to the shareholder, by verifying the return on equity using the return on equity indicator, and comparing it with other benchmarks.
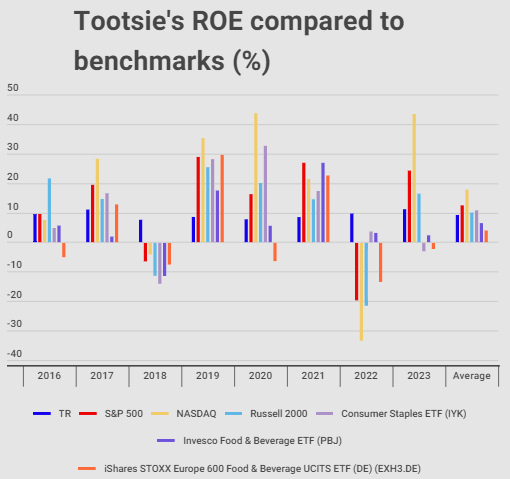
Comparing Tootsie's return on equity to other benchmarks (Author)
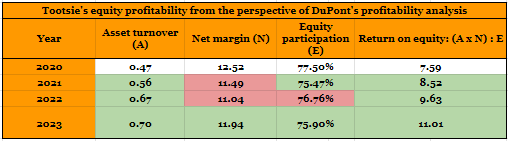
DuPont Profitability Analysis (Author)
Through DuPont's profitability analysis model, we can see what Tootsie is developing to achieve an upward shareholder return since 2020. Firstly there was an increase in turnover of 48.94%, which was achieved through a deterioration in margin, much less significant than raising this additional turnover, resulting in an upward return for shareholders. The composition of assets in comparison to liabilities remained stable. According to the adapted
DuPont model, the ideal would be financing through third-party capital to leverage operations, as this would reduce the proportion between equity and liabilities, increasing shareholder returns, but of course, the model infers that each and every source of financing should be weighed against the costs and returns of capital sources. They are different approaches, but I think Tootsie is succeeding with the conservative approach, which I consider clearly safer, especially if it is already showing increasing returns without the use of leverage.
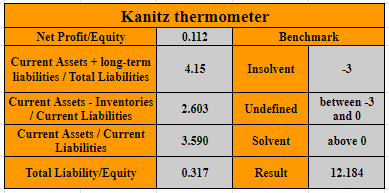
Kanitz thermometer for predicting bankruptcy (Author)
As a way of finishing the fundamental analysis, I checked the bankruptcy prediction model to analyze the strength of Tootsie's solvency and, I was not surprised when I found a high level of solvency and, consequently, an almost zero chance of bankruptcy.
As with my analysis of Lancaster (LANC), I see the risks very similar here. The biggest risk for shareholders who buy Tootsie shares at these levels is the pricing based on the implicit growth rate, which expects high growth of approximately 11%. According to growth tracking models and quantitative forecasts, my most optimistic growth rate was 10.62%, meaning everything is already properly priced.
Now, talking about the risks that Tootsie will be facing in the coming years, the main one is competition with giant companies, which, using third-party capital, since they have a very high asset turnover and are capable of generating a lot of revenue, use of third-party capital to boost shareholder returns. There are no structural or liquidity risks for Tootsie, meaning the chances of bankruptcy in the medium term are close to zero. Once again, due to the maturity of the company, I would feel more comfortable with an improvement in its margins, especially the net margin.
To calculate Tootsie's WACC, I used the weighted average of the cost of equity capital and the cost of debt capital, adjusted for taxes. WACC stands at 7.43%. This includes the cost of equity at 7.44%, calculated as Risk Free Rate + Beta x Market Risk Premium (ERP), and the cost of debt capital at 4.91%, reflecting the adjusted Tootsie's debt interest rate for tax benefits. The weight of debt in the capital structure is 0.65%.
To calculate growth, given that there is no clear consensus on Tootsie growth, I calculated a weighted average of some growth metrics observed in 2023 and the last five years, which are: Revenue Growth (YoY and 5-year average), EBITDA growth (YoY and 5-year average), Earnings per share growth (YoY and 5-year average), Operating Cash Flow growth (YoY and 5-year average), and ROE (Return on o Net Equity) (YoY and 5-year average). Therefore, I considered a growth of 10.62%.
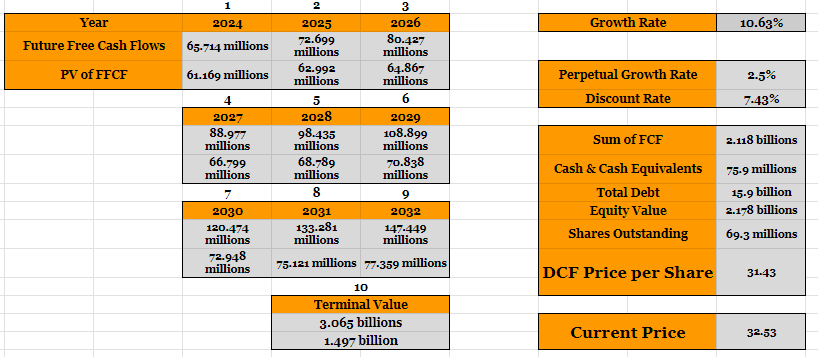
Discounted Cash Flow valuation model (Author)
This way, we can see that the current price is already incorporating approximately the growth rate that I calculated, therefore, I do not see a potential for upside or undervaluation since the growth rate is implicit in relation to pricing standards. Any growth lower than expected will be reflected in the share price, so I don't see room for buying at this point. I will confirm this view of mine with other evaluation methods that I will attach below.
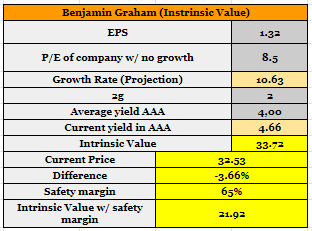
Benjamin Graham valuation model (Author)
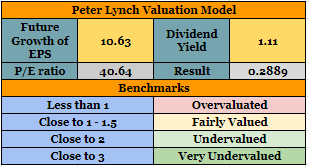
Peter Lynch valuation model (Author)
After all the breakdown of Tootsie Roll's current capital structure, liquidity and operational conditions, my recommendation based on current price levels is "Hold". The stock seems to be priced according to the growth rate expected by analysts (we can argue that perhaps this growth rate is still a little exaggerated), I do not expect a positive surprise for the year 2024 with the operating levels maintained by the company, which remains at mediocre levels.
The capital structure is safe, the company uses a much higher proportion of its own capital, and according to quantitative methods it is not at risk of bankruptcy. The company has its own working capital, which brings extra security to its operations.
My biggest concern is the company's inability to generate a decent turnover for its assets and, when there is an improvement in turnover, the company is unable to maintain a stable gross margin. This fact prevents me from believing in profit growth in the medium term.