Sjo/iStock via Getty Images
Sjo/iStock via Getty Images
Teekay Tankers (NYSE:TNK) offers a lot of value for its price. The company owns a concentrated portfolio of 25 Suezmax, 24 Aframax/LR2 tankers, and a 50% stake in one VLCC. The fleet concentration, in my opinion, has its advantages. DHT Holdings (DHT) is VLCC pure-play stock, Nordic American Tankers (NAT) is Suezmax pure-play, and TNK is a bet on growing mid-size crude tankers demand.
The first two months of 2024 have been turbulent. The Houthis remained a significant constraint in global supply chains, the Panama Canal drought is still persistent, and since last Friday, 14 vessels of the Russian tanker company Sovcom have been sanctioned.
TNK announced its results last week. In my opinion, the unchanged dividend mostly disheartened the market participants. Nevertheless, the company delivered stronger results than FY22. Besides that, TNK will be debt-free at the end of 1Q24.
TNK is still part of my portfolio. I believe its stock price will fare well in the rising TCE environment. The company trades at 89% P/NAV and has 11% LTV. Besides that, TNK is cheaper than other tanker companies with concentrated fleets such as DHT and NAT or tanker majors such as Frontline (FRO).
TNK's presentation shows the crude oil tanker market conditions in one slide: declining fleet growth, increasing oil demand, resulting in rising tonne-mile demand
TNK 4Q23 presentation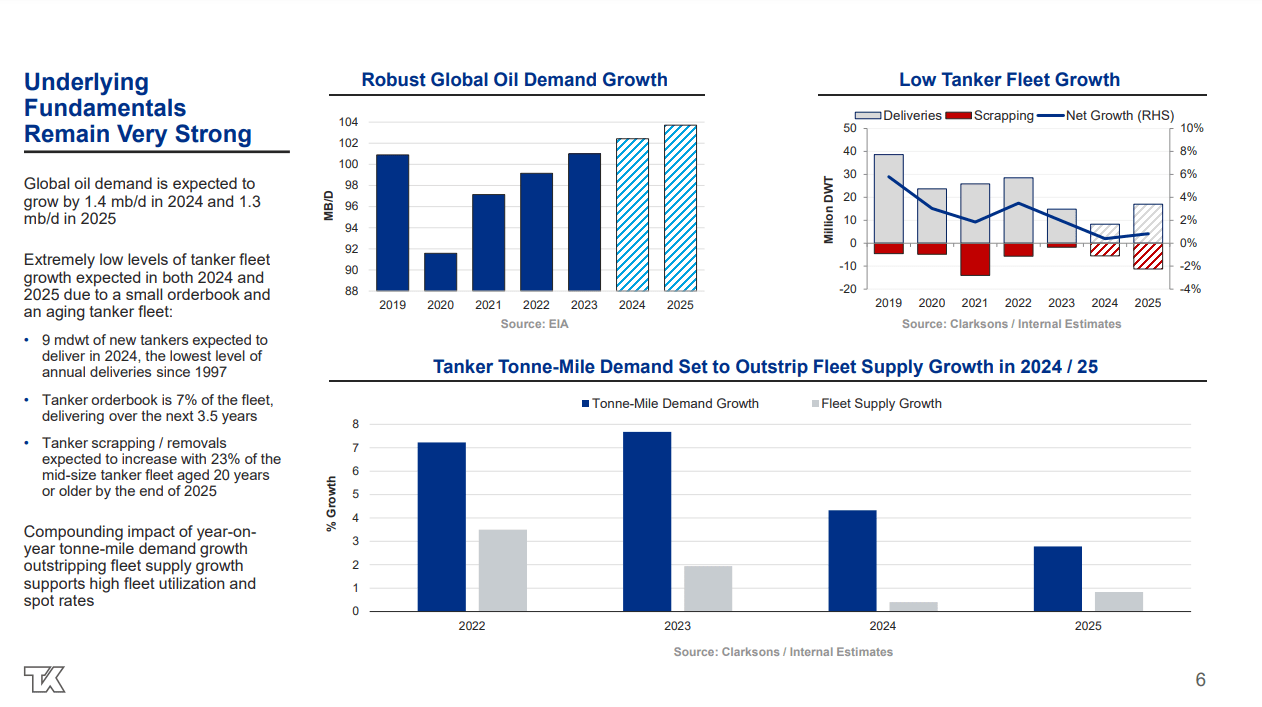
The top left chart illustrates global oil demand growth. Now, the world consumes around 101 mbd. It is expected to grow to 102 mbd in 2024 and 104 mbd in 2025. One million barrels per day seems like nothing. However, it has to be considered in the context of declining tanker fleet growth. Crude oil tankers, and especially VLCCs, have record low order books compared to the percentage of ships older than 15 years. The chart below summarizes the effects of squeezed vessel supply and increasing crude oil demand. The tonne-mile demand growth is expected to exceed significantly fleet supply growth.
TNK has 26 Suezmax vessels and 26 Aframax. Let's look deeper in detail. The charts below represent projected Aframax/Suezmax fleet growth for 2024, 2025, and 2026.
Banchero Costa Banchero Costa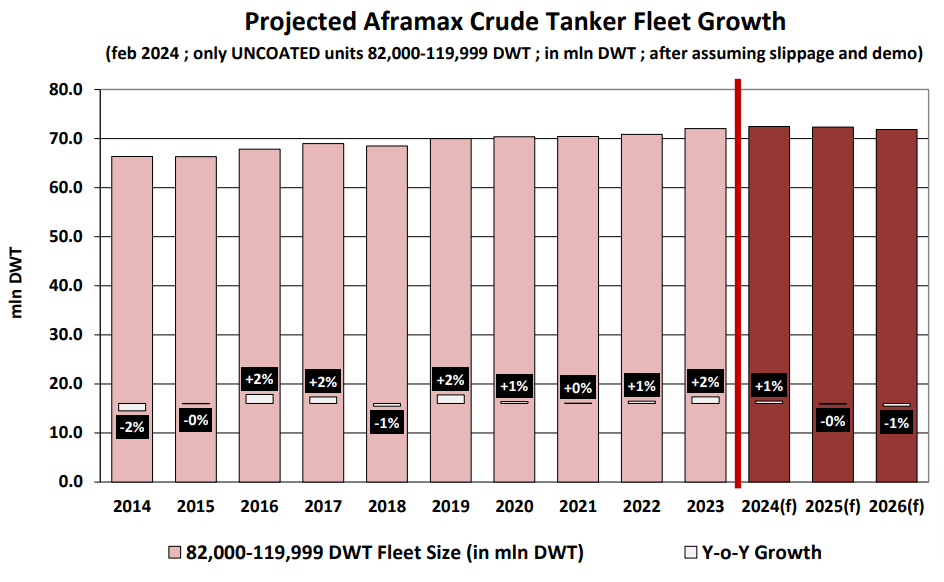
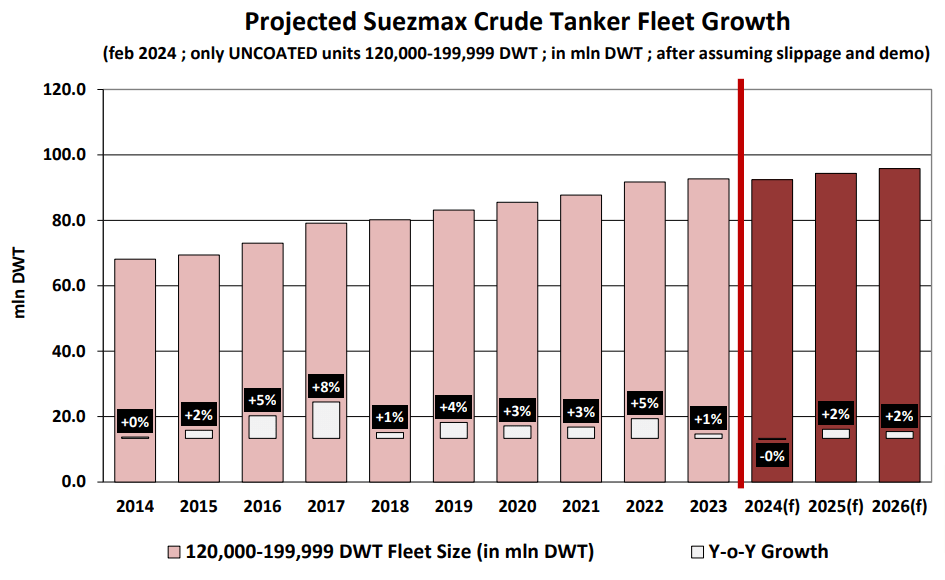
The growth rate remains in the low single-digits region for both types of vessels.
Tanker stocks have been on the rise since the war in Ukraine started. Despite the improving rates, the ship owners remembered their lessons from the last boom and bust cycle. So, they withheld purchasing many tankers. This means the supply will stay constrained for longer. Of course, once the cycle accelerates, the ship owners will queue to order new vessels. Eventually, the new ships will cause a tanker glut. Shipping cyclicality is the best illustration of the impact of the CAPEX cycle.
Where are we now? The chart below shows my assumption of where we are in the current tanker cycle.
Cello Square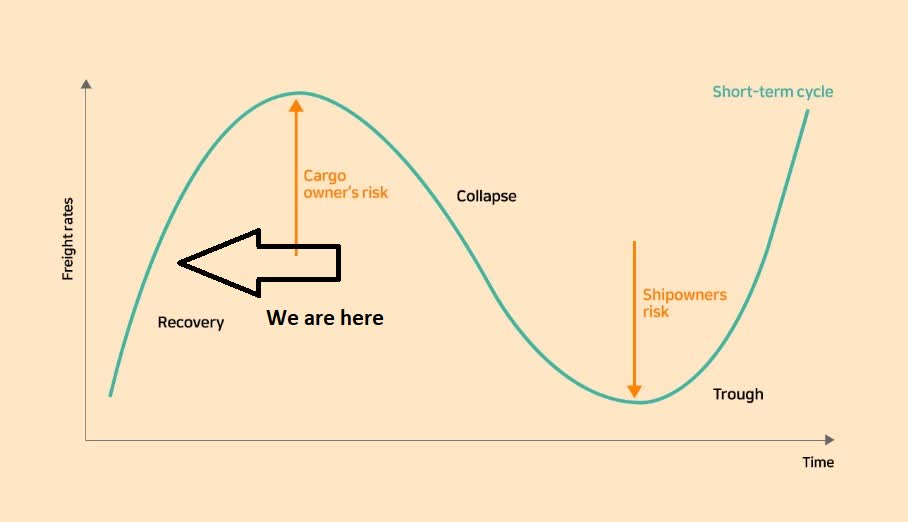
I believe we are in the middle of the expansion phase. So, the upside potential still exceeds the downside risk. And one reminder: no one can predict the peak and bottom of the cycles. At any time, the current expansion phase can end up as a false dawn.
As investors, we operate with multiple scenarios, and the pessimistic ones are always present. At the current stage of the tanker market, I classify the potential outcomes as follows: rising TCE rates as a probable scenario, stagnating rates as a plausible scenario, and declining rates as a possible scenario. So, I play the market expecting the best while preparing for the worst.
In 4Q23, TNK has made some changes in its fleet. The company reduced the number of Aframax tankers to 24 in 4Q23 by selling two 2004-built vessels for $46.5 million. The table below represents the current TNK fleet.
TNK 4Q23 report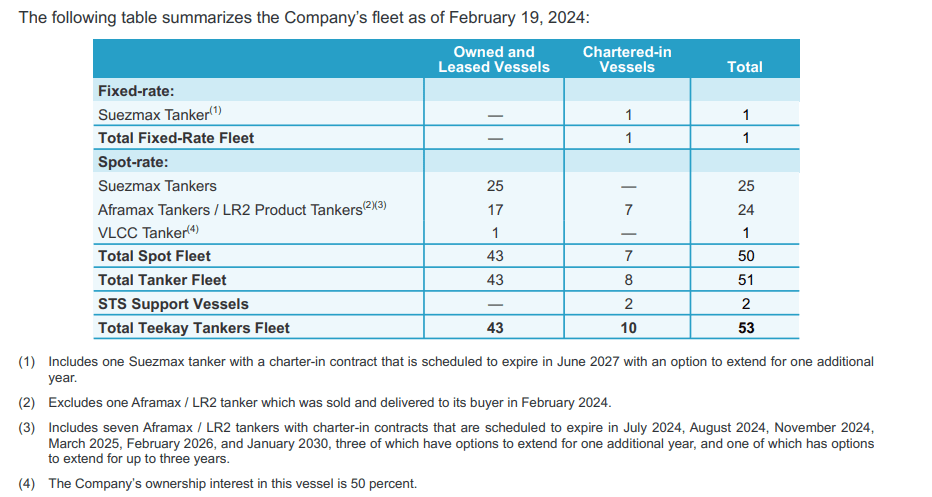
TNK fleet has an average age of 14.7 years, so divesting older vessels improves fleet quality. TNK can use the proceeds to update its fleet with newer ships equipped with scrubbers.
TNK employs its vessels under spot contracts. It is a risky decision, although with significant upside potential. As discussed, I believe we are in the middle of the expansion stage of the cycle, so having higher exposure to the spot rates is beneficial for TNK's profitability.
The company maintains a stable FCF breakeven at $16,000/day, well below Aframax/Suezmax day rates. The chart below shows 3Q23 and 1Q24 day rates.
TNK 4Q23 presentation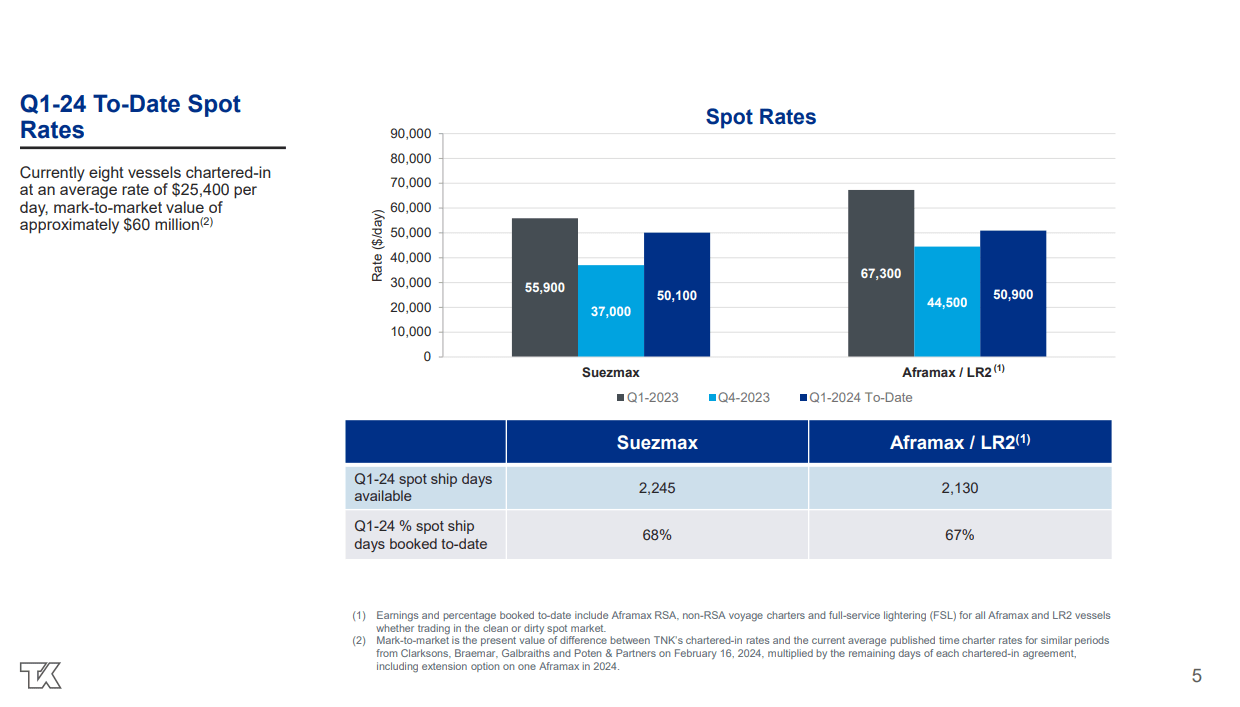
Aframax/LR2 day rates increased QoQ by $6,400/day, reaching $50,900/day in 1Q24 YTD. The Suezmax TCE grew at a steeper pace by 35% QoQ, reaching $50,100/day. However, YoY TCE rates declined across the fleet by 8.5% for Suezmax and 24% for Aframax/LR2.
The following table shows the TNK 4Q23 income statement.
TNK 4Q23 report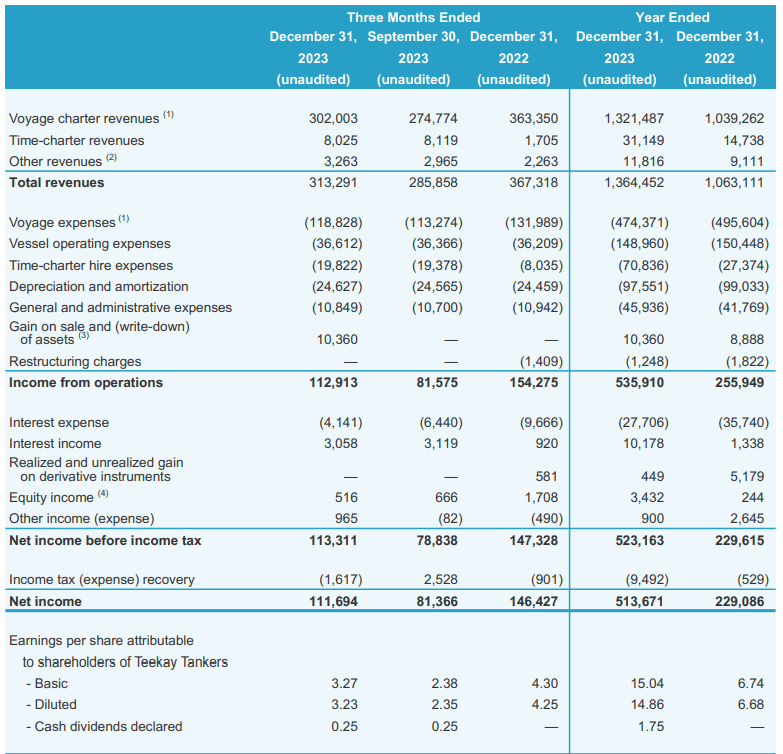
Voyage charter revenue grew by 10% QoQ, reaching $302 million. Voyage and operating expenses remained in stable QoQ. TNK's operating income in 4Q23 reached $112 million compared to $81.5 million in 3Q23. QoQ net income increased by $35 million, resulting in $3.23 diluted EPS.
4Q23 results disappointed compared to 4Q22. TNK's total revenue declined by $53 million YoY due to lower Aframax and Suezmax TCE rates. Operating and net income dropped by 27% and 23%, respectively.
In FY23, TNK delivered $1.36 billion in total revenue, 32% higher than FY22. Voyage and operating expenses remained relatively stable. FY23 TNK's operating income increased by 110% compared to FY22. The company's net income for 2023 is $513 million, while 2022 is $229 million. EPS increased QoQ to $3.23/share, although it dropped YoY by 44%. Looking at the big picture, FY23 diluted EPS more than doubled, reaching $14.86/share.
Despite the strong results, TNK kept the dividends unchanged at $0.25/share. TNK has a payout ratio below 10%. Paying dividends is not the only way to return value to the shareholders. One of the options for the companies is to pay down their debts. TNK will soon be debt zero company. The next option is share buybacks. Since 2022, TNK has repurchased 10.87 million common shares at $5.06 average price. In June 2023, TNK authorized a new share repurchase program of up to $25 million.
TNK has significantly improved its balance sheet in 2023. The chart below shows the company's debt repayment profile.
TNK 4Q23 presentation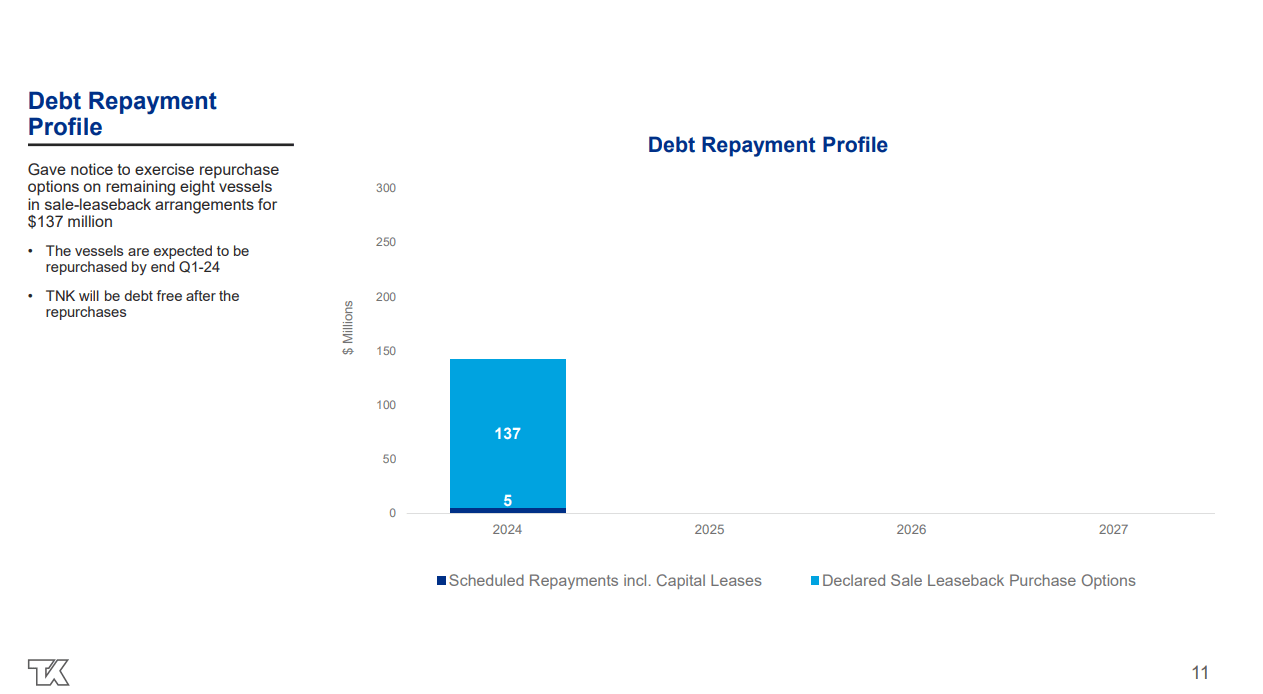
The remaining $137 million debt is part of a sale-leaseback agreement for eight vessels. The company plans to repurchase those vessels by the end of 1Q24. Once the transaction is complete, TNK will be debt-free. TNK has $365 million in cash positions, far exceeding the scheduled debt repayment. At the present stage of the cycle, having cash at hand and being debt-free gives an exceptional advantage. TNK has multiple options for using its spare firepower without needing external financing.
In my opinion, the best option is to renew its fleet, but under one consideration, to purchase already available 5-10Y old scrubber-equipped tankers instead of ordering new ships. Second-hand tankers are already available so that they can start earning cash immediately. Conversely, the delivery of a new ship takes more than 18 months and, in some cases, more than two years. Two years is too long in volatile and cyclical markets, such as shipping.
To estimate the value of TNK, I use P/NAV and relative valuation. Let's calculate the first company's net asset value. To figure out TNK's vessels' value, I picked data from the last Compass Maritime report.
Compass Maritime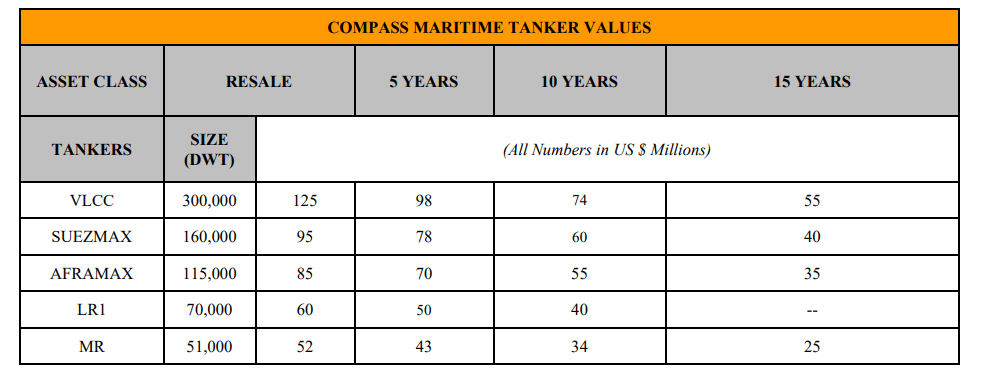
TNK fleet composition is as follows: 10xLR2 at 14.5 years average age, 14xAframax at 13.2 average age, 25xSuezmax at 14.8 average age, and 1xVLCC at 11 years average age. Two considerations: seven Aframax/LR2 vessels are chartered-in, and TNK has a 50% interest in the VLCC tanker. To estimate the value of every type of ship, I use a 5% annual depreciation rate.
The inputs for the NAV equation are as follows:
The inputs in the TNK NAV equation are:
Based on the above inputs, TNK's Net Asset value is $2,090 million.
TNK's market capitalization is $1,880 million, while its net asset value is $2,090 million. Hence, TNK trades at 89% P/NAV.
Compared to NAT, DHT, and FRO, TNK trades at lower multiples.
Seeking Alpha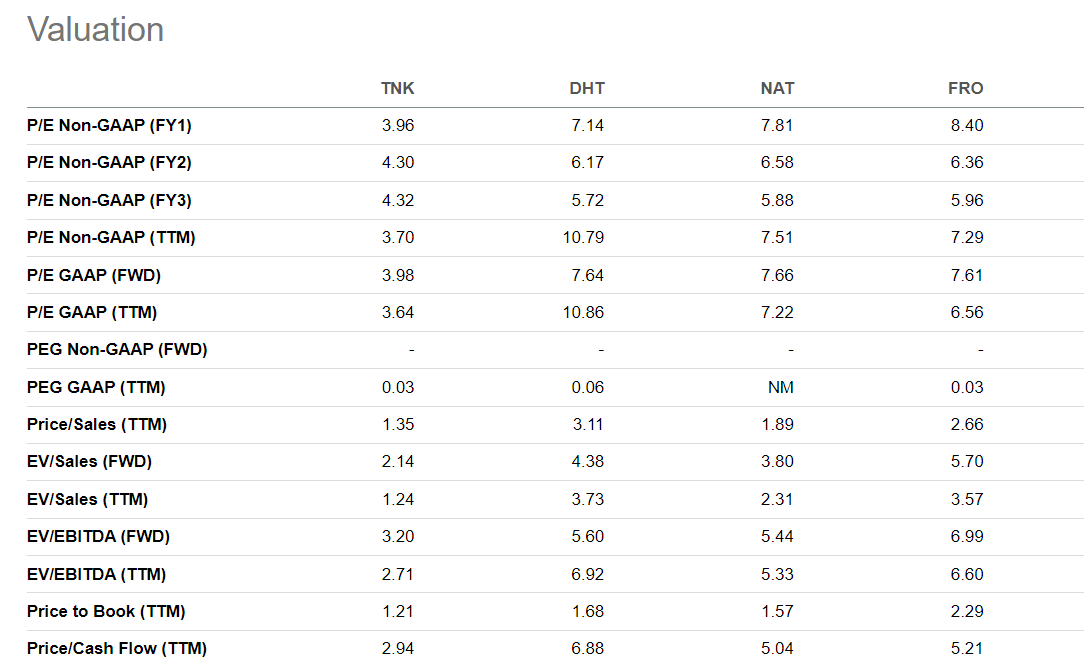
The company trades at 1.24 EV/Sales, 2.71 EV/EBITDA, and 1.21 Price/Book. NAT has a similar fleet, considering its age of 12.6 years and zero vessels equipped with scrubbers. NAT has a higher LTV at 22% compared to TNK's LTV at 11%. However, NAT trades at 2.31 EV/Sales, 5.33 EV/EBITA, and 1.57 Price/Book.
The market discounts TNK's aging fleet and lack of EGCS, although it is missing the company's clean balance sheet with soon-to-be zero outstanding debt. Having zero debt gives TNK optionality on how to play the cycle to order new ships, venture into other shipping segments, and expand its fleet with second-hand vessels.
TNK offers upside potential at a reasonable price. Of course, there are risks, too. The most pronounced is the aging fleet of TNK. However, that fact is not as bad as it seems at first glance when we consider that TNK will be debt-free soon.
As investors, we cannot ignore the impossible triad of shipping investing. We cannot get all three: new fleet, low LTV, and low P/NAV. To obtain two of those, we must sacrifice the remaining one. We can have a top-quality fleet and relatively low LTV at a steep price. Or we can pick low LTV and a considerable margin of safety, though we sacrifice the fleet quality. TNK falls in the second category. It offers 11.7% LTV at 89% P/NAV. Those benefits come at the cost of an aging fleet.
The primary issue with aging vessels is the increased operating expenses due to more frequent and more expensive maintenance. On top of that, unplanned breakdowns increased ship downtime. The outcome is squeezed profit margins.
In an inflationary environment, owing any tangible assets means a rising NAV. On the other hand, having zero debt means the company is not exposed to rising interest rates following inflationary pressures. TNK can acquire new vessels without external financing.
TNK's weak spot is the mediocre dividend yields. NAT, DHT, and FRO excel in that matter with attractive dividend yields. Despite that, I am happy to own TNK as a part of my portfolio. My verdict remains unchanged; I give TNK a buy rating.