
Wong Yu Liang/Moment via Getty Images
Wong Yu Liang/Moment via Getty Images
Interest rate volatility continues to hover well above levels from before the Fed began its rate-hiking campaign. Even with eyes on the first policy rate ease perhaps as early as Q2, the ICE BofA MOVE Index, which captures expected volatility across the Treasury curve, remains well above 100. That means investors should expect whippy yields daily, with every economic data point having a seemingly outsized impact on the highly liquid Treasury market.
With an apparent high and low in place for the 30-year yield and high volatility, the conditions appear to favor avoiding leveraged Treasury funds.
Thus, I have a sell rating on the Direxion Daily 20+ Year Treasury Bull 3X Shares ETF. While I previously outlined a short-dated long play on the ETF last year, I now see more balanced risks which could ultimately hurt this leveraged fund.
TradingView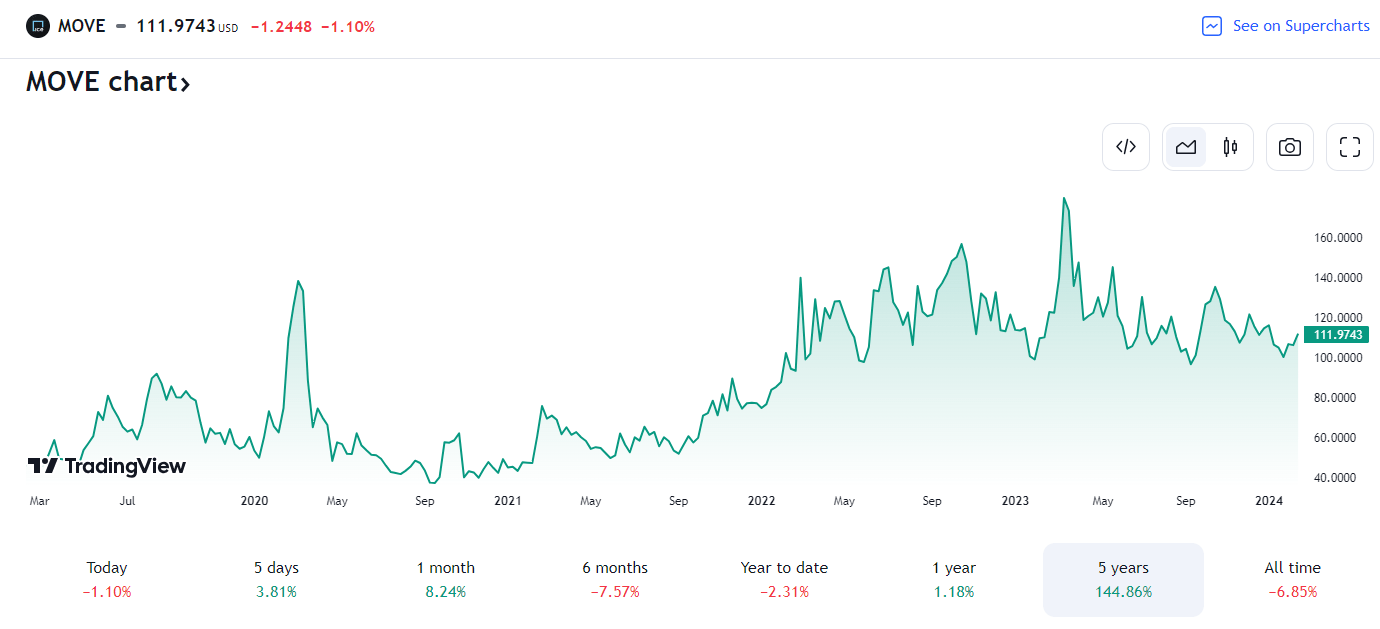
According to the issuer, TMF seeks daily investment results, before fees and expenses, of 300%, or 300% of the inverse (or opposite), of the performance of the ICE US Treasury 20+ Year Bond Index. There is no guarantee the funds will meet their stated investment objectives, per Direxion.
TMF is a large ETF with $4.6 billion in assets under management as of February 14, 2024. The fund has paid a trailing 12-month dividend yield of 2.8% and its annual expense ratio is high at 1.06%, and the ETF should not be held for more than a few days or weeks due to the risk of negative compounding returns which I will describe later. Share-price momentum has been poor recently amid fluctuating interest rates, and Seeking Alpha's ETF Grading system shows a poor F Risk rating. Still, liquidity is strong with TMF given average daily trading volume of almost 9 million shares, and its 30-day median bid/ask spread is narrow at just two basis points.
As I always like to preface with leveraged ETFs, they are generally riskier than traditional ETFs which do not employ leverage. It's key to understand how daily compounding returns work since it can be a major risk for investors holding a product like TMF beyond a day.
Here is an illustration of how negative compounding returns occur in a leveraged ETF: Suppose an index starts at 100, and the leveraged product also begins at 100. If the index rises by 10% to 110, the 3x long product increases to 130. However, if a subsequent 10% drop happens, the index falls to 99 (a 1% loss from the initial value). In contrast, the 3x long product declines to $89 (0.7 x 130), reflecting an 11% total decrease. Additional disclosures on leveraged products are provided at the end of the article.
My overall thesis is that high volatility on the long end of the yield curve will hurt TMF's share price over the coming weeks and months, compared to say, a 1x long extended-duration Treasury ETF. Let's run through the risks, both bullish and bearish, for long-term Treasuries today.
Perhaps the biggest upside risk to Treasury prices is if we see further evidence that inflation is on the mend. That would allow the Fed to cut interest rates sooner rather than later. What's more, any significant negative shock to economic growth could quickly flip the script and turn the long bond into a 'flight to safety' asset, resulting in higher bond prices and lower yields - which would be a boon for TMF. The January Retail Sales report was certainly a 'cool' data set with the YoY climb being the lowest since May 2020.
Trading Economics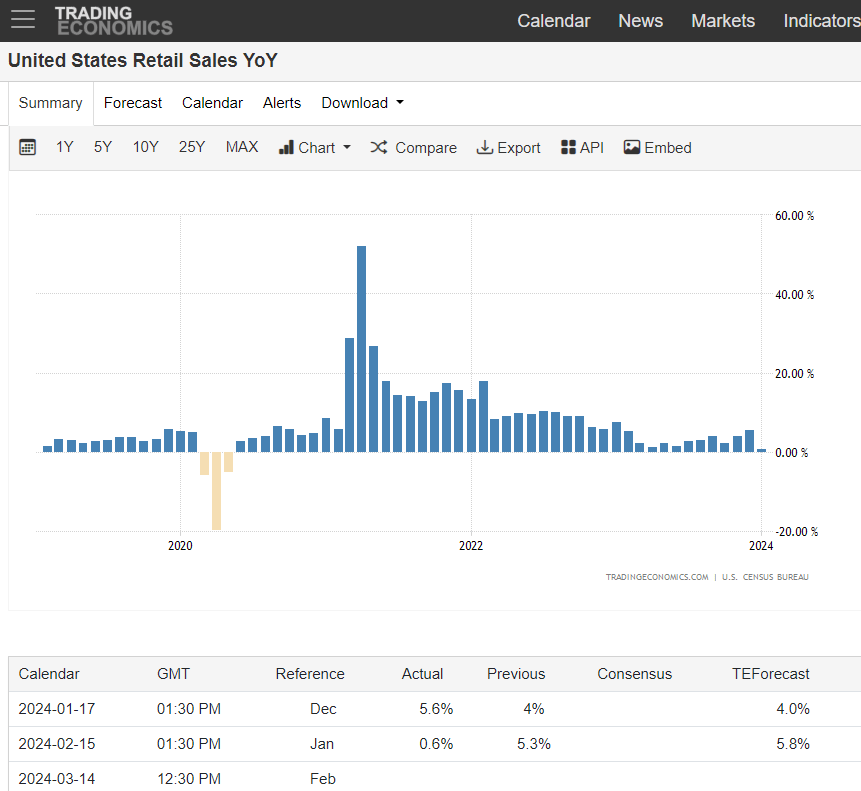
The bears have in their quiver the arrow of a hot January CPI report. The Headline number came in a tenth of a percentage point higher than forecasts, as did the Core rate. Yields, which had already moved up off lows hit earlier in February, spiked. That bond market selloff was bearish for TMF and rate-sensitive slices of the stock market.
Christian Fromhertz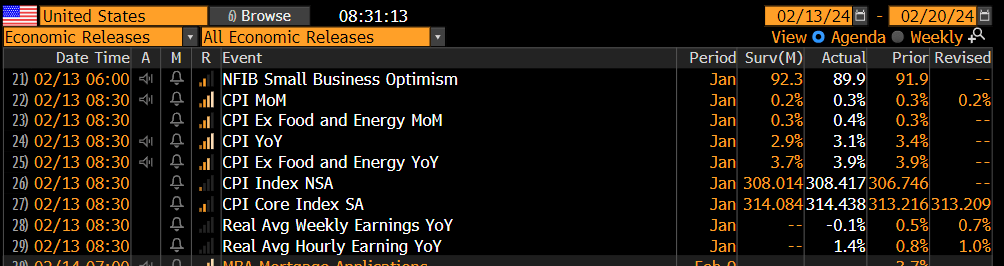
Further underscoring my thesis that TMF's share price may suffer from trendless price action and high volatility is the historical price moves on the iShares Long-Term Treasury ETF (TLT). Using Seeking Alpha's new Seasonality tool, we find that TLT (which is just a 1x version of long-bond exposure compared to the 3x daily exposure found with TMF), has historically moved down in February, up in March, back down in April before finally beginning to increase starting in May. If that trend plays out, TMF will be hurt by negative compounding returns due to volatility.
Seeking Alpha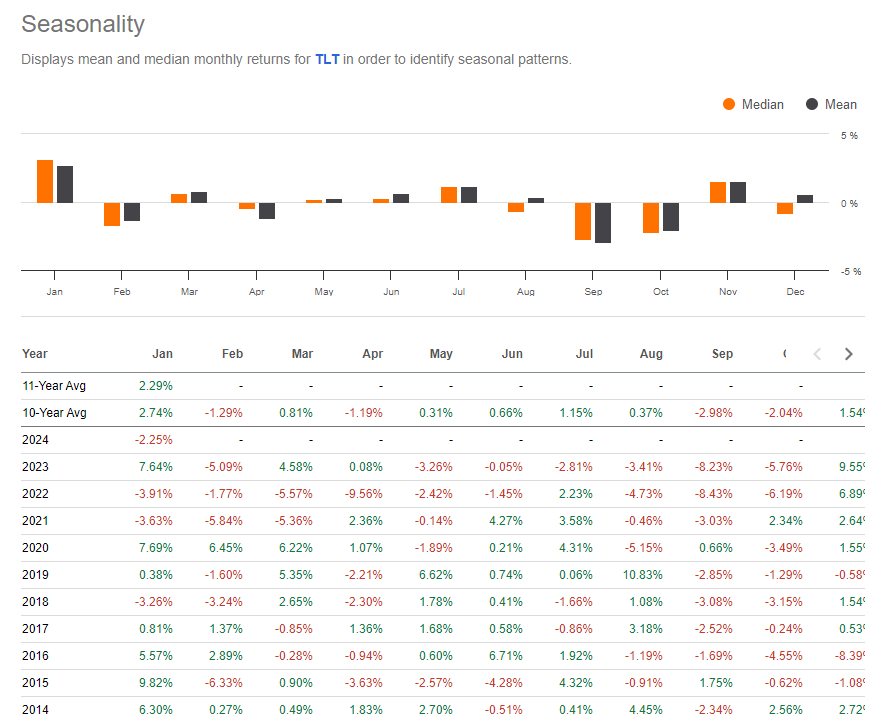
The problem for the long bond yield today is that a trading range may have emerged on the chart. Notice in the graph below that the 30-year Treasury rate hit a high of 5.15% in October last year but then found support at its recent low just under 3.95%. Today, the yield has bounced back to 4.45%. Take a look, though, at one bearish indicator: a death cross between the short-term 50-day moving average and the longer-term 200-day moving average. It's the first time in about two years in which the 50dma has been beneath the 200dma. That tells me that the bears are regaining control of the yield (which is of course bullish for price action on the long bond and TMF).
Bigger picture, however, I merely see the chart as neutral given the established highs and lows over the past several months. We could even see the 30-year rate inch up to about 4.7% - the brief pullback low last October before the final thrust higher. Moreover, look at the RSI momentum oscillator at the top of the chart - it's sort of in no man's land here around 60 having touched both technical overbought and oversold conditions since early Q4 last year.
Overall, I see mixed risks on the long bond's yield. That means ongoing volatility may hurt the price of TMF, leading me to issue a sell rating.
Stockcharts.com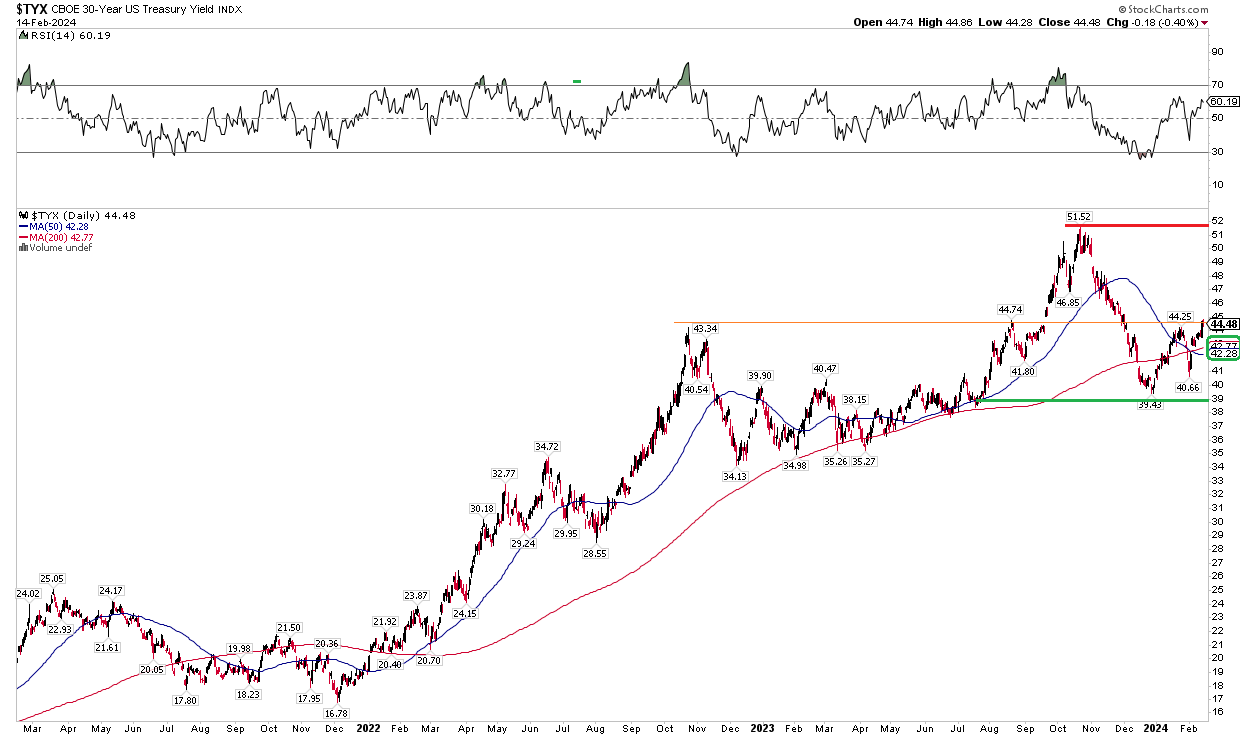
I am downgrading TMF from a buy to a hold, though TMF is not intended to be held for more than a handful of sessions or weeks due to the fund's leverage. For now, with high volatility ongoing in the rates market and a range-bound chart, selling TMF makes sense to take advantage of expected further up-and-down moves in the 30-year yield.
1) The Lowdown on Leveraged and Inverse Exchange-Traded Products (FINRA).
2) Leveraged and Inverse ETFs: Specialized Products with Extra Risks for Buy-and-Hold Investors (SEC).
3) FINRA's Reminder on sales practices for Leveraged and Inverse ETFs (FINRA)