
Larry Crain
Larry Crain
One of the more interesting companies that I've come across in recent years is LCI Industries (NYSE:LCII). For those not aware of the company, it is a producer and seller of components in the recreation, transportation, and housing markets. Although it does make its products available on the aftermarket, it mostly provides them to OEMs (original equipment manufacturers). A lot of the company's business involves the North American recreational vehicle market. And most of that involves RVs specifically, though it does also sell products associated with the boating market, buses, train space, and more. Over the years, the enterprise has grown to operate 120 manufacturing and distribution facilities spread throughout North America and parts of Europe. But unfortunately, the past couple of years have been rather difficult.
Once the pandemic struck, stimulus payments made out to people, combined with an increase in social distancing, resulted in a surge of demand for RVs. That surge was basically a couple of years' worth of front loading demand, and when combined with the negative impact of rising prices and higher interest rates, demand since has plunged rather significantly. The good news is that management has been doing well to reduce leverage during this time and the long-term picture for the enterprise is positive. Even the most recent fundamental data provided by industry practitioners suggests that the worst for the space is now over. But of course, investors should be paying attention to additional data that comes out as time goes on. The fact of the matter is that shares of LCI Industries look rather pricey relative to similar firms. And because of that, it makes a better ‘hold’ than a ‘buy’. But in the next few quarters, that picture could change.
The last article that I published about LCI Industries came out in early August of 2023. In that article, I acknowledged that the company was slated to release some rather dower financial results for the second quarter of its 2023 fiscal year. I recognized that inflationary pressures and high interest rates were the problem. But I was also drawn to the fact that, if we assumed a full recovery of the industry, the picture for shareholders could be quite positive. Because of pricing, however, combined with the timing of that recovery, I ultimately kept the company rated a ‘hold’ to reflect my view that the stock would be unlikely to outperform the broader market for the foreseeable future. But it seems I was too optimistic. While the S&P 500 is up 10.1% since then, shares of our prospect have seen downside of 17.7%.
Author - SEC EDGAR Data
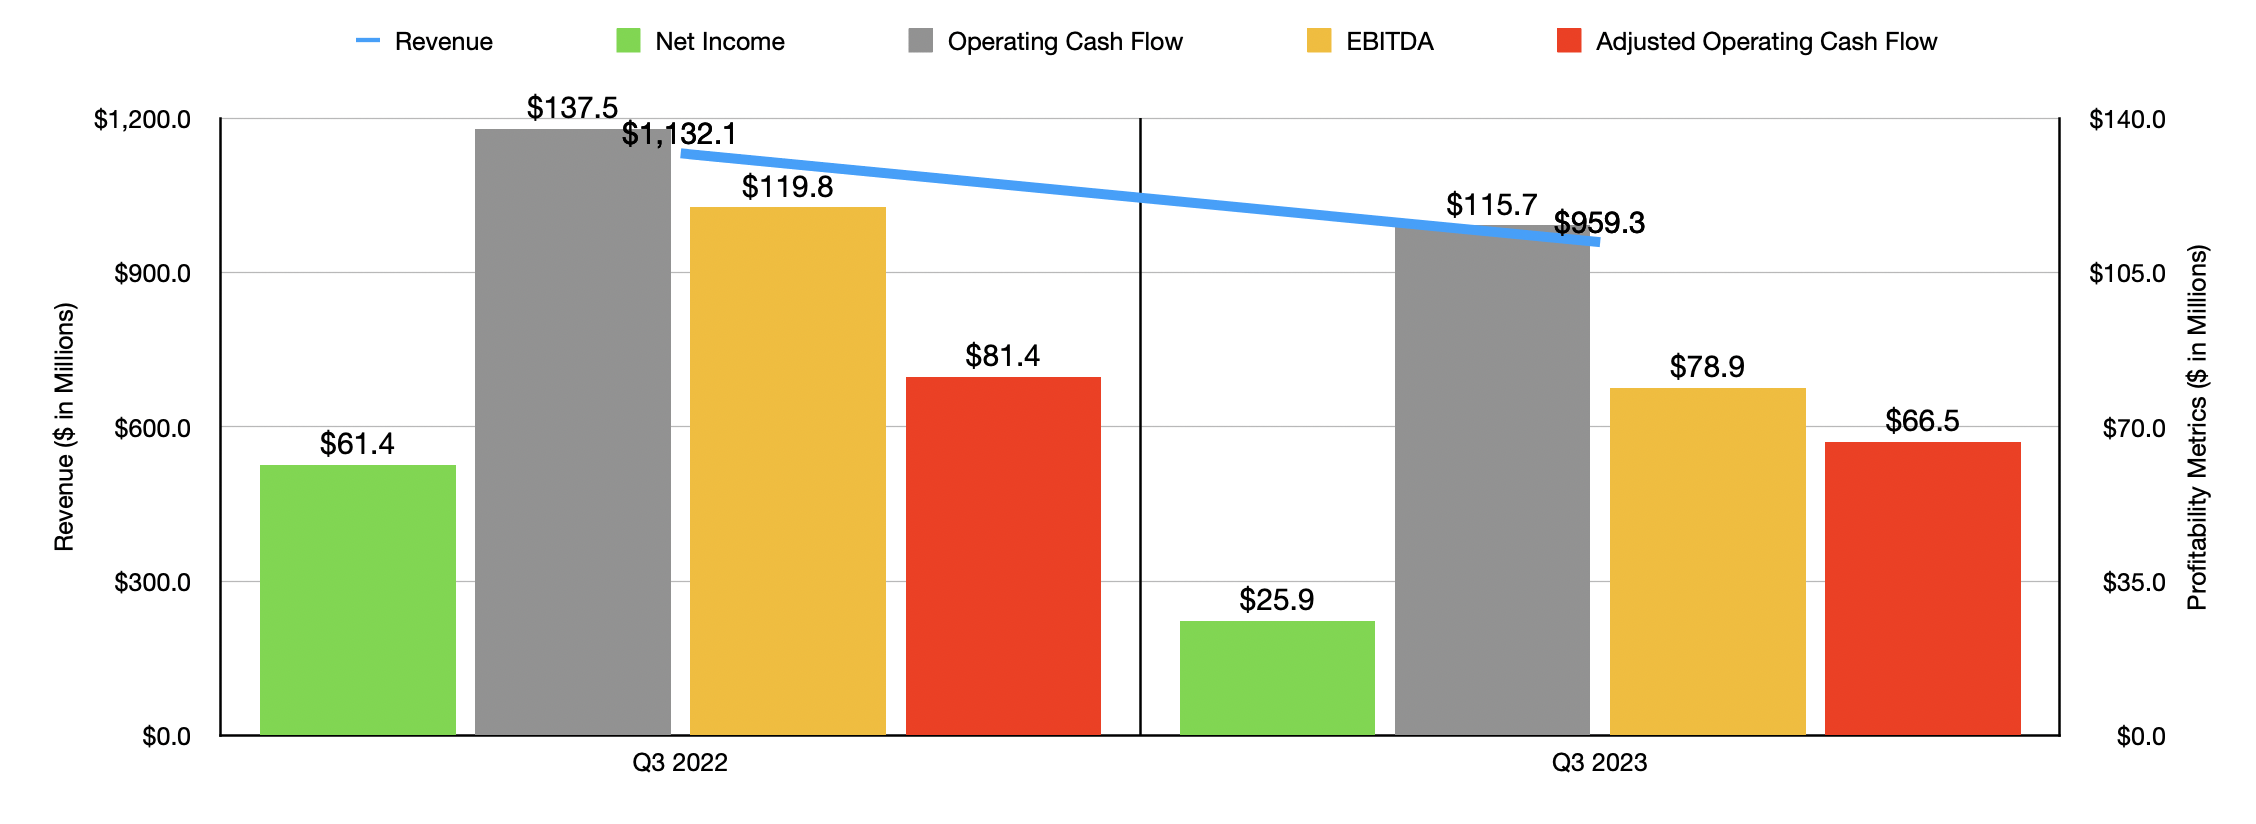
To understand exactly why things have gone south, we should cover the most recent data provided by management, which covers the third quarter of the 2023 fiscal year. During that quarter, revenue for the company totaled $959.3 million. That's 15.3% lower than the $1.13 billion generated one year earlier. There were some bright spots for the company. For instance, the Aftermarket segment for the firm saw revenue rise by 5.1% year over year as distribution channel inventories started to stabilize. But this was more than offset by a plunge in the OEM segment. Revenue there dropped precipitously from $912.4 million to $728.5 million. That's a decline of 20.2%. A 16.1% drop in travel trailer and 5th wheel wholesale units shipped for the industry, combined with a 32.7% drop in motor home units shipped, caused this pain.
Author - SEC EDGAR Data
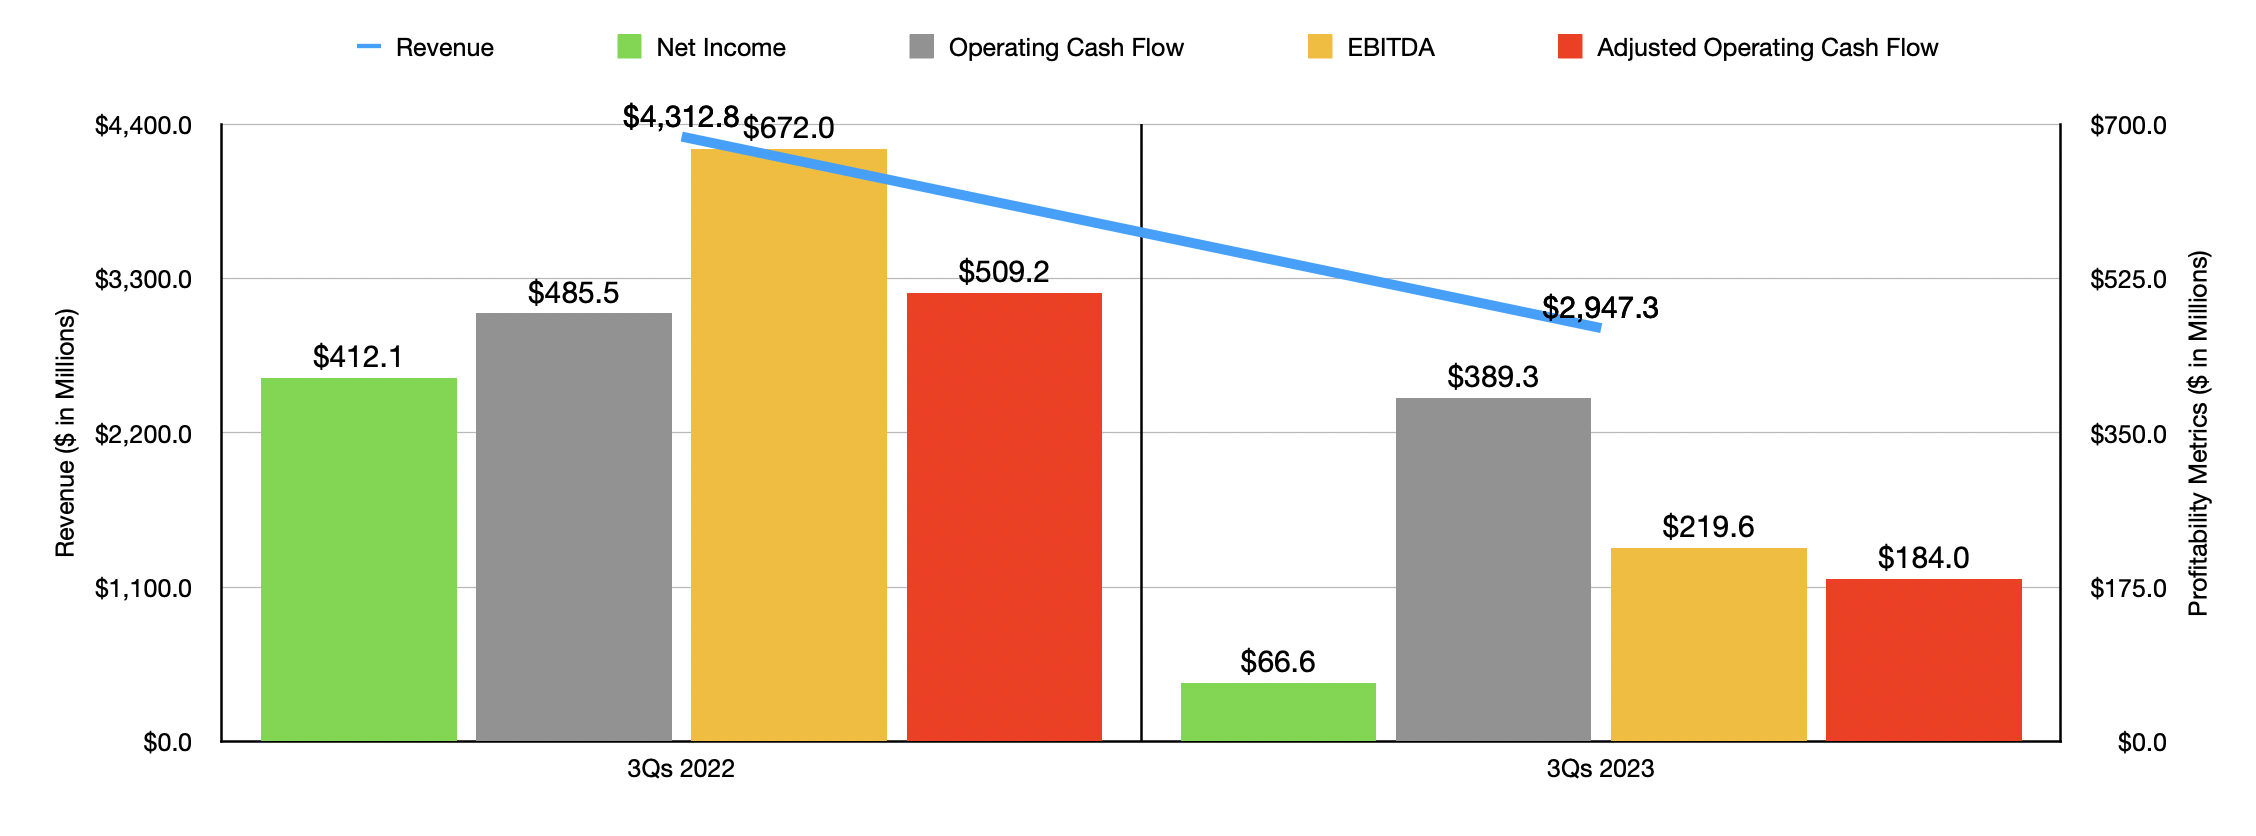
As you can imagine, profits for the company also took a hit. Net income went from $61.4 million to $25.9 million. Operating cash flow declined from $137.5 million to $115.7 million. If we adjust for changes in working capital, the drop would have been from $81.4 million to $66.5 million. And lastly, EBITDA for the company declined from $119.8 million to $78.9 million. Of course, the third quarter was not a one-time event. In the chart above, you can see results for the first nine months of 2023 relative to the same nine months of 2022. As you can see in that, there was weakness across the board.
Author - SEC EDGAR Data
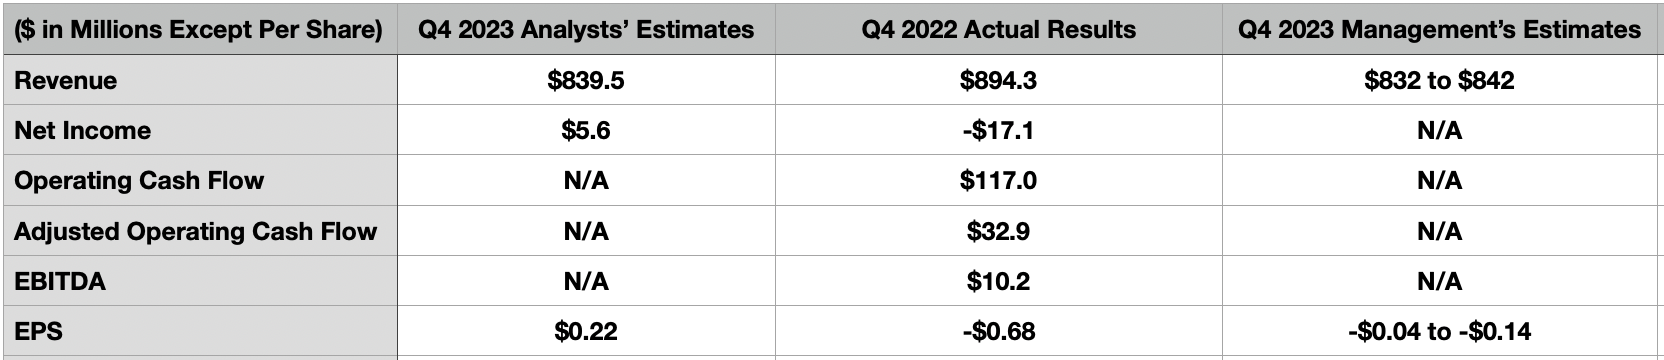
One positive for shareholders to consider is that management is slated to report financial results for the final quarter of the 2023 fiscal year. That data is expected to come out on February 13th. Management already released preliminary ranges for some of the important metrics. For instance, they said that revenue should be between $832 million and $842 million. This is down rather significantly from the $894.3 million reported one year earlier. And if you take the midpoint of guidance, it does come in lower than the $839.5 million that analysts forecasted. On the bottom line, management said that investors should anticipate a loss per share of between $0.04 and $0.14. That compares to a $0.68 per share loss reported one year earlier. However, it is materially worse than the $0.22 per share profit analysts were expecting. In the table above, for reference, you can see revenue, profits, profits per share, and certain cash flow metrics for what the company reported for the final quarter of 2022. I wouldn't be surprised to see these numbers come in worse than what they did during that quarter.
Author - SEC EDGAR Data
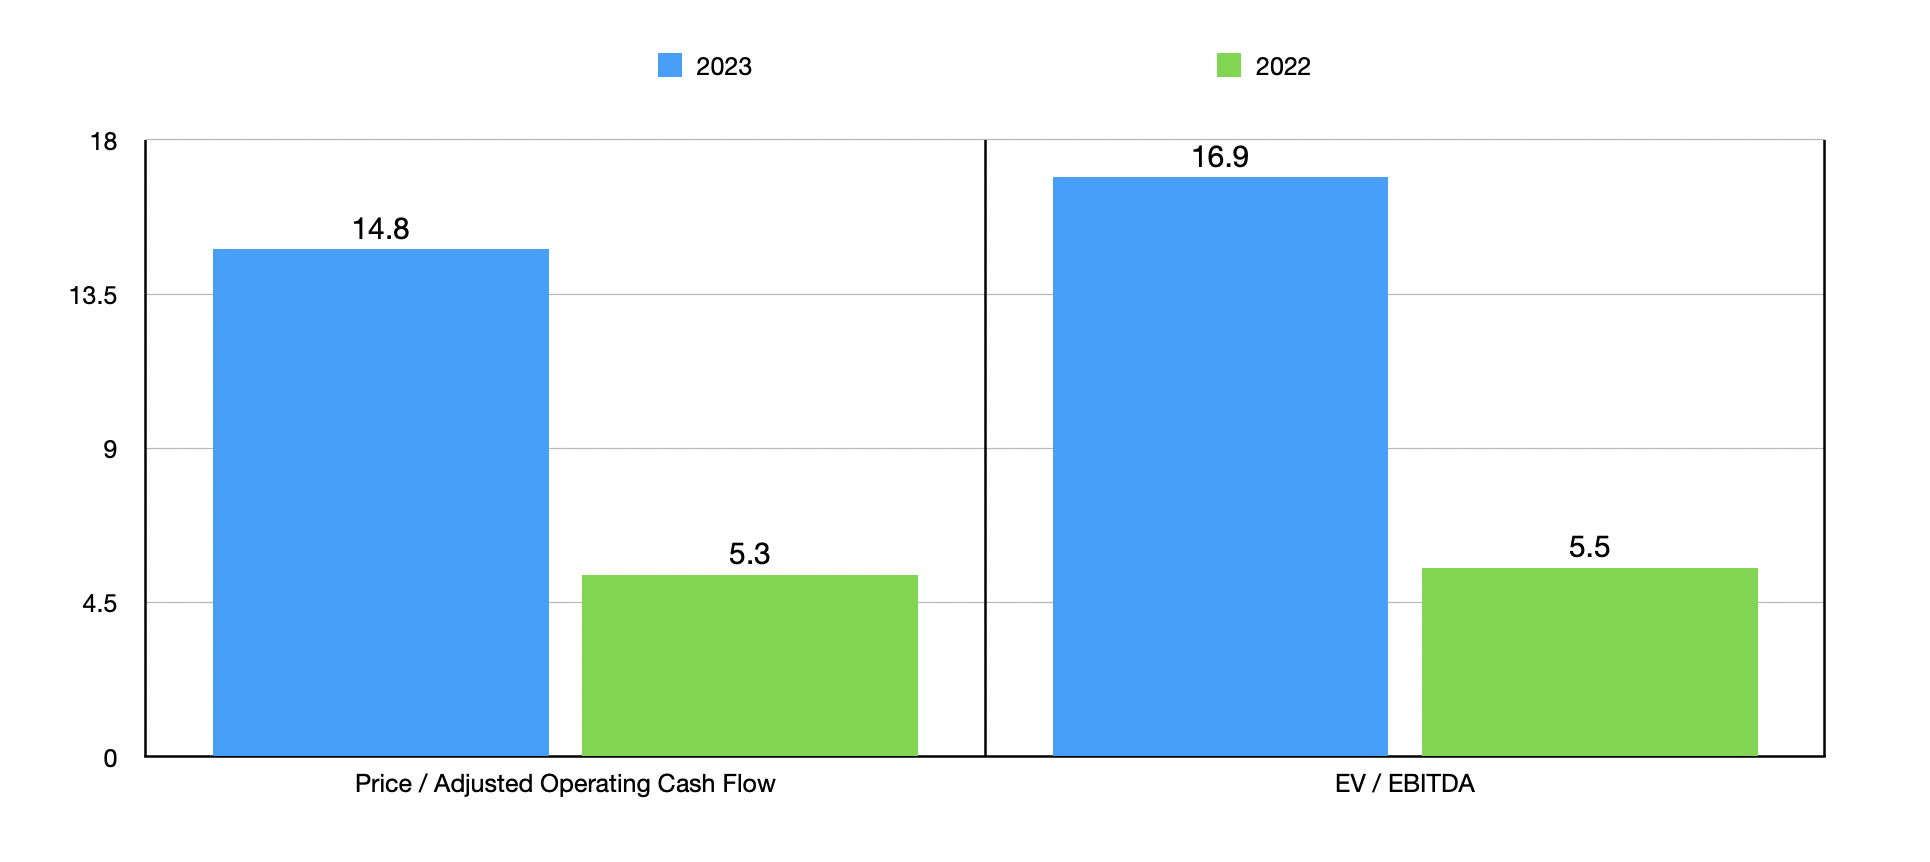
Given this expectation of continued pain, I can understand why investors would be cautious about the company. This is especially true when you look at how shares are priced. In the chart above, you can see a valuation for the company based on an assumed annualization of cash flows from the first nine months of 2023 relative to the same time one year earlier. The company went from looking very cheap using the 2022 data to looking more or less fairly valued when it comes to the 2023 fiscal year. In the table below, I compared the company to four similar firms. And when involves the price to cash flow approach or the EV to EBITDA approach, LCI Industries ends up being the most expensive of the group.
| Company | Price / Operating Cash Flow | EV / EBITDA |
| LCI Industries | 14.8 | 16.9 |
| Camping World (CWH) | 7.6 | 10.6 |
| THOR Industries (THO) | 6.5 | 9.2 |
| Winnebago Industries (WGO) | 9.6 | 7.8 |
| Patrick Industries (PATK) | 4.8 | 8.2 |
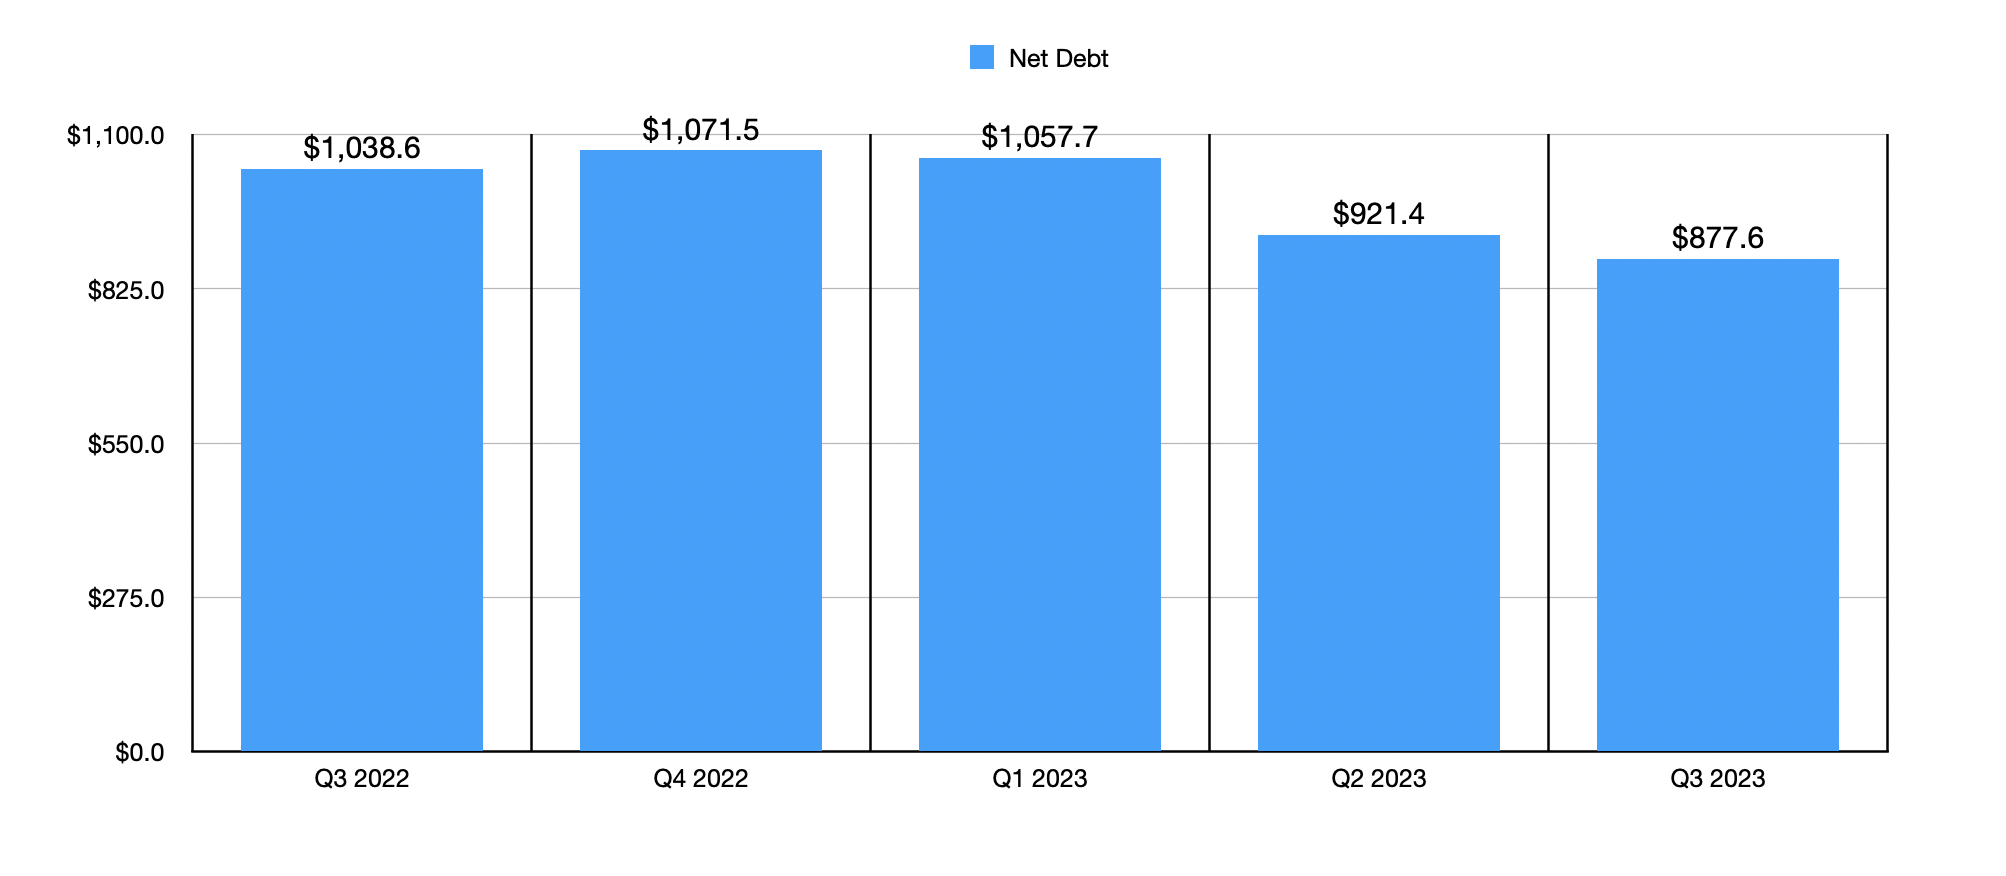
Despite these troubles, there are some positives to take into consideration. First, management has been using this time to reduce leverage. After seeing net debt rise from $1.04 billion in the third quarter of 2022 to $1.07 billion in the final quarter of that year, net debt has been declining consistently. By the third quarter of 2023, it had fallen to $877.6 million. That's an 18.1% reduction over the course of only nine months. Unless the company goes cash flow negative in the final quarter, which is possible but not terribly likely, I would imagine that net debt will trickle down slightly.
Author - SEC EDGAR Data
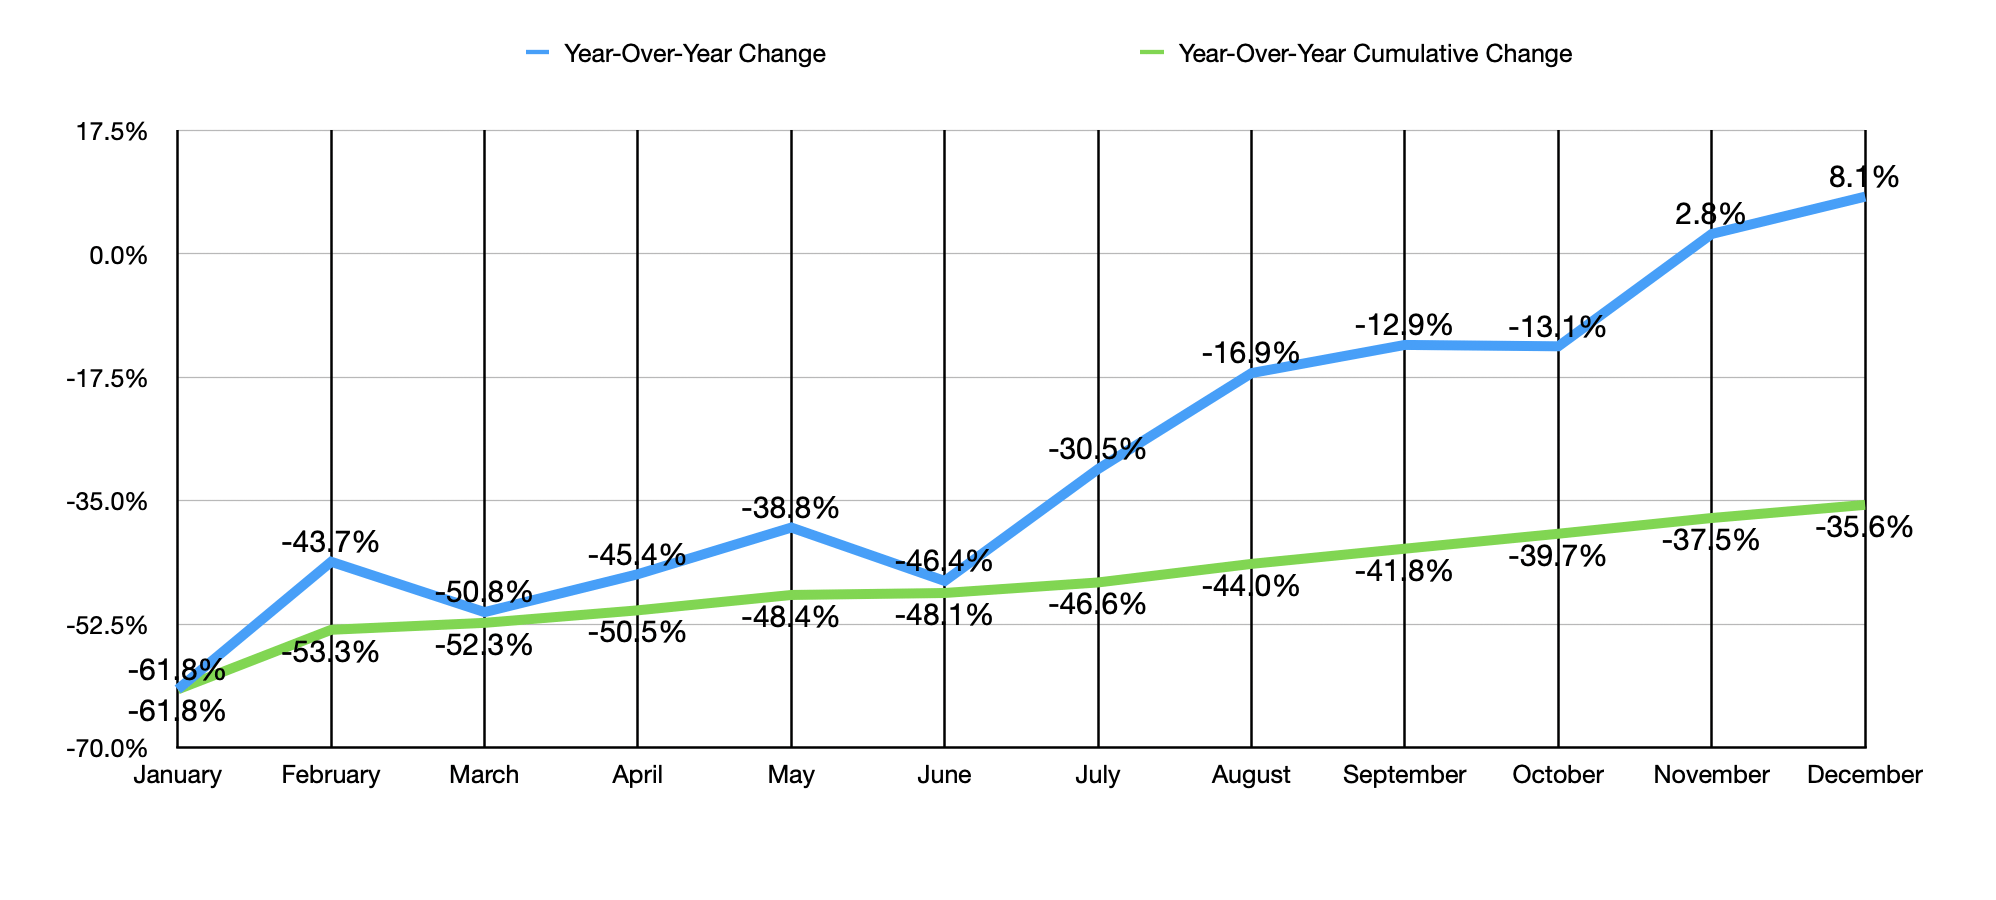
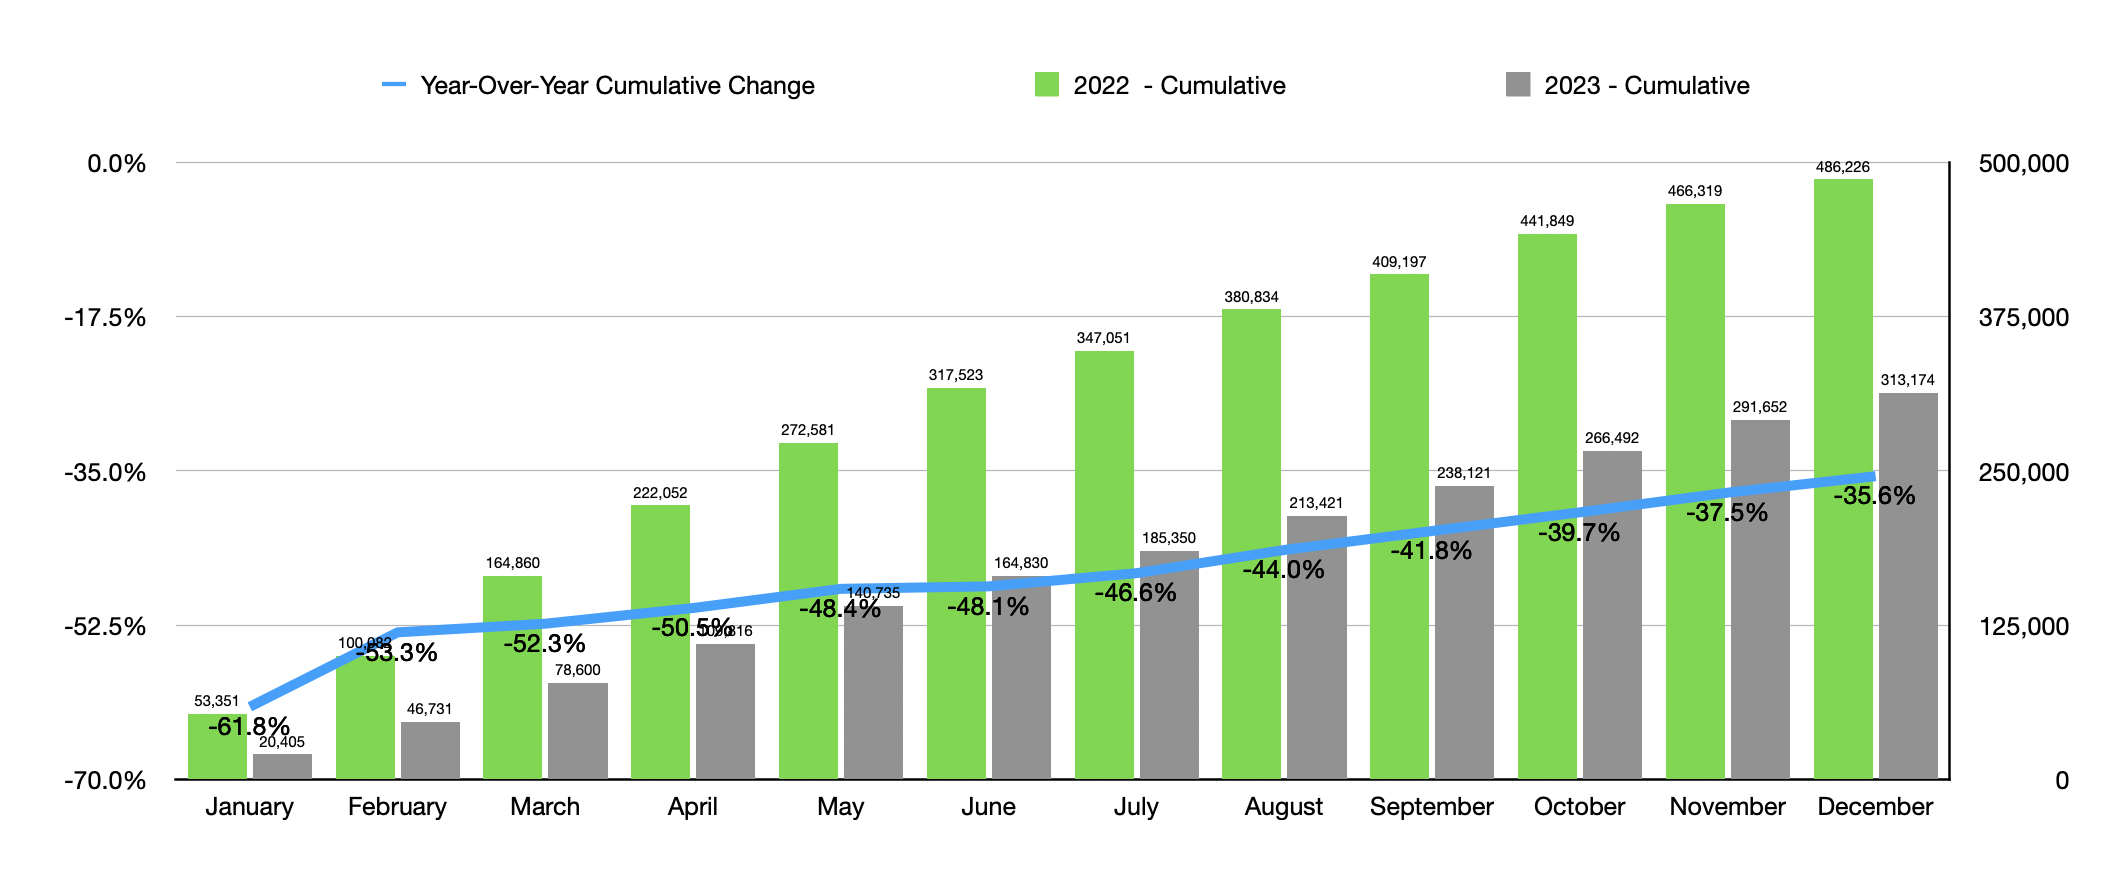
But outside of the company specific data, we are starting to see the RV industry come back to life. In the first chart below, you can see year over year changes, on a monthly basis, as well as a cumulative year over year change, for 2023. The blue line shows wholesale shipments of RVs in each month, with the last two months of the year showing site year over year growth. And as time went on, the cumulative data looks better every single month. In the second chart below, you can see something a little different. The blue line now shows the cumulative year over year change. But the bars show the actual cumulative wholesale shipments from one quarter to the next. As time progressed last year, the industry was showing small signs of recovering. And when it comes to this year, that trend is expected to continue. At the midpoint, the industry is forecasting wholesale shipments of 350,100 units. That would translate to a 13.8% rise over the 307,700 units originally anticipated for 2023. However, it's worth noting that the December data was particularly strong for the industry. It was strong enough, in fact, that 2023 results were pushed up to 313,174. It's not hard to imagine additional strength building this year, especially if we start to see some interest rate cuts occurring heading into summer.
Author - RV Industry Association Data
Author - RV Industry Association Data
Based on all the data provided, I must say that I am optimistic about the space and the long run. I'm encouraged by continued debt reduction and the fact that management has kept the company cash flow positive. I do think that shares are pricey relative to similar firms. But if the industry recovers like I think it will, that should be temporary. At some point, this kind of trend will lead me to upgrade the stock. But for now, I think it's still a bit early. So even though the industry is showing nice signs of recovery and the company is on decent footing, I think that a ‘hold’ rating makes sense at this time.