baona
baona
I love dividend-growing companies! Receiving dividend checks is one of the great joys of investing life. Not only that, but companies that consistently increase their payouts perform significantly better than those that don't. As someone who closely monitors these companies, I'm happy to share valuable insights on upcoming dividend increases. With these lists, you can confidently expect to see the top stocks expected to raise their dividends in the upcoming week. I use this analysis for my portfolio construction and actionable items as they come up.
This week features a dividend king: Becton, Dickinson and Company. UBSI and ADP are also rapidly approaching king status, with streaks of 49 years and 48 years, respectively.
As we plow into December, these are the last opportunities for companies to announce their yearly increase.
The information presented here is a result of merging two sources of data - the "U.S. Dividend Champions" spreadsheet from this website and upcoming dividend data from NASDAQ. The process involves combining data on companies with a consistent dividend growth history with their future dividend payments. It's important to understand that all companies included in this list have consistently grown in dividends for at least five years.
Companies must have higher total dividends paid out each year to be included in this list. Hence, a company may not increase its dividend every calendar year, but the total annual dividend can still grow.
The ex-dividend date is when you must purchase shares to be eligible for the upcoming dividend or distribution. To qualify, you must have bought the shares by the end of the preceding business day. For instance, if the ex-dividend date is Tuesday, you must have acquired the shares by the market close on Monday. It's important to note that if the ex-dividend date is a Monday (or a Tuesday following a holiday on Monday), you must have bought the shares by the previous Friday.
Here are the definitions of the streak categories, as I'll use them throughout the piece.
| Category | Count |
| King | 1 |
| Champion | 3 |
| Contender | 4 |
| Challenger | 1 |
Data has been sorted by the ex-dividend day (ascending) and then by the streak (descending):
| Name | Ticker | Streak | Forward Yield | Ex-Div Date | Increase Percent | Streak Category |
| Cass Information Systems, Inc. | (CASS) | 22 | 2.93 | 4-Dec-23 | 3.45% | Contender |
| UniFirst Corporation | (UNF) | 6 | 0.77 | 6-Dec-23 | 6.45% | Challenger |
| Becton, Dickinson and Company | (BDX) | 51 | 1.61 | 7-Dec-23 | 4.40% | King |
| United Bankshares, Inc. | (UBSI) | 49 | 4.43 | 7-Dec-23 | 2.78% | Champion |
| Automatic Data Processing, Inc. | (ADP) | 48 | 2.44 | 7-Dec-23 | 12.00% | Champion |
| WesBanco, Inc. | (WSBC) | 13 | 5.34 | 7-Dec-23 | 2.86% | Contender |
| United Bancorp, Inc. | (UBCP) | 10 | 6.18 | 7-Dec-23 | 1.19% | Contender |
| UMB Financial Corporation | (UMBF) | 31 | 2.17 | 8-Dec-23 | 2.63% | Champion |
| Spire Inc. | (SR) | 20 | 4.96 | 8-Dec-23 | 4.86% | Contender |
Streak: Years of dividend growth history are sourced from the U.S. Dividend Champions spreadsheet.
Forward Yield: The new payout rate is divided by the current share price.
Ex-Dividend Date: This is the date you need to own the stock.
Increase Percent: The percent increase.
Streak Category: This is the company's overall dividend history classification.
Here's a table mapping the new rates versus the old rates. It also reiterates the percentage increase. This table is sorted similarly to the first (ex-dividend day ascending, dividend streak descending).
| Ticker | Old Rate | New Rate | Increase Percent |
| CASS | 0.29 | 0.3 | 3.45% |
| UNF | 0.31 | 0.33 | 6.45% |
| BDX | 0.91 | 0.95 | 4.40% |
| UBSI | 0.36 | 0.37 | 2.78% |
| ADP | 1.25 | 1.4 | 12.00% |
| WSBC | 0.35 | 0.36 | 2.86% |
| UBCP | 0.168 | 0.17 | 1.19% |
| UMBF | 0.38 | 0.39 | 2.63% |
| SR | 0.72 | 0.755 | 4.86% |
Some different metrics related to these companies include yearly pricing action and the P/E ratio. The table is sorted the same way as the table above. A value investor may find stock ideas with those companies near their 52-week lows, as they could provide more margin of safety and inflated yield.
Compared to recent lists, most of these companies are substantially off their 52-week highs.
| Ticker | Current Price | 52-Week Low | 52-Week High | P/E Ratio | % Off Low | % Off High |
| CASS | 41.01 | 34.01 | 49.65 | 24.93 | 21% Off Low | 17% Off High |
| UNF | 170.45 | 150.23 | 204.54 | 26.35 | 13% Off Low | 17% Off High |
| BDX | 235.72 | 227.01 | 286.34 | 87.06 | 4% Off Low | 18% Off High |
| UBSI | 33.39 | 25.35 | 40.39 | 13.66 | 32% Off Low | 17% Off High |
| ADP | 229.16 | 197.16 | 267.54 | 30.3 | 16% Off Low | 14% Off High |
| WSBC | 26.97 | 18.83 | 37.77 | 18.57 | 43% Off Low | 29% Off High |
| UBCP | 11 | 9.7 | 15.15 | 9.96 | 13% Off Low | 27% Off High |
| UMBF | 71.98 | 49.48 | 90.09 | 17.04 | 45% Off Low | 20% Off High |
| SR | 60.93 | 53.77 | 73.33 | 44.9 | 13% Off Low | 17% Off High |
I've arranged the table in descending order for investors to prioritize the current yield. As a bonus, the table also features some historical dividend growth rates. Moreover, I have incorporated the "Chowder Rule," which is the sum of the current yield and the five-year dividend growth rate.
| Ticker | Yield | 1 Yr DG | 3 Yr DG | 5 Yr DG | 10 Yr DG | Chowder Rule |
| UBCP | 6.18 | 6.5 | 4.9 | 5.1 | 8.9 | 11.2 |
| WSBC | 5.34 | 3.7 | 3.3 | 4.4 | 6.3 | 9.8 |
| SR | 4.96 | 5.1 | 5 | 5.1 | 5.4 | 10 |
| UBSI | 4.43 | 0 | 1 | 1.2 | 1.5 | 5.7 |
| CASS | 2.93 | 3.6 | 2.4 | 6.8 | 7.8 | 9.7 |
| ADP | 2.44 | 20.2 | 11.2 | 13.6 | 11.1 | 16.1 |
| UMBF | 2.17 | 2.7 | 7 | 5.8 | 5.9 | 8 |
| BDX | 1.61 | 4.6 | 4.8 | 4 | 6.3 | 5.6 |
| UNF | 0.77 | 3.3 | 7.4 | 32.8 | 23.5 | 33.6 |
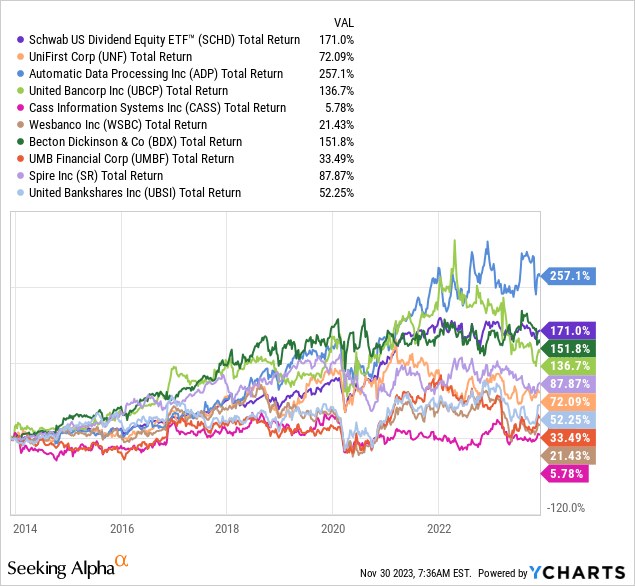
My investment strategy involves finding stocks combining increasing dividends and consistently outperforming the market. I use the Schwab U.S. Dividend Equity ETF (SCHD) as my dividend growth benchmark. This ETF has a remarkable track record of exceptional performance, a higher yield than the S&P 500, and a proven record of growing dividends. Investing in the ETF is better if a stock cannot beat the benchmark. I've added companies to my personal investment portfolio based on this analysis. I also routinely use this analysis to choose timely additional purchases.
Here's the total return chart of SCHD versus everyone on the list. For reference, SCHD has returned about 171% over the decade. ADP, a company I hold, was the only outperformer of the entire group over the decade.
UBCP and BDX had brief periods of outperformance, but otherwise lagged SCHD. The rest of the competitors were not even close and an investor would have been much better served holding an index.
Please do your due diligence before investing, and thanks for reading.
Editor's Note: This article discusses one or more securities that do not trade on a major U.S. exchange. Please be aware of the risks associated with these stocks.