
jetcityimage
jetcityimage
In my article published September 29, 2021, I wrote,
At current share price SpartanNash Company (NASDAQ:SPTN) offers an attractive 3.79% dividend yield. The current P/E ratio of 9.29 is below its historical levels of around 10.0 to 10.5. Unfortunately, SA analysts' EPS estimates indicate a decline in EPS through end of 2023, so any change in P/E ratio is more likely to be a decrease than an increase. With a prospect for declining EPS and declining P/E ratio causing further share price declines, total returns through end of 2023 could be negative, despite the dividend yield. I believe there will likely be opportunities in the fourth quarter for lower stock prices across the board, including SpartanNash, as I believe a market correction is overdue. At a lower share price the dividend yield should be higher and the risk of share price decline lower, at which time SpartanNash might come into buy range.
At market close on February 23, 2024, the SpartanNash share price was down 5.85% on the price at date of the abovementioned article, and the dividend yield had increased from 3.79% to 4.11%. Per Seeking Alpha Premium, total return over this period was 1.37% due to the dividend receipts exceeding the fall in the share price.
I set out to find if the lower share price and the higher dividend yield would now justify an upgrade to a Buy rating. Unfortunately, Table A below reveals some discouraging trends.
Table A
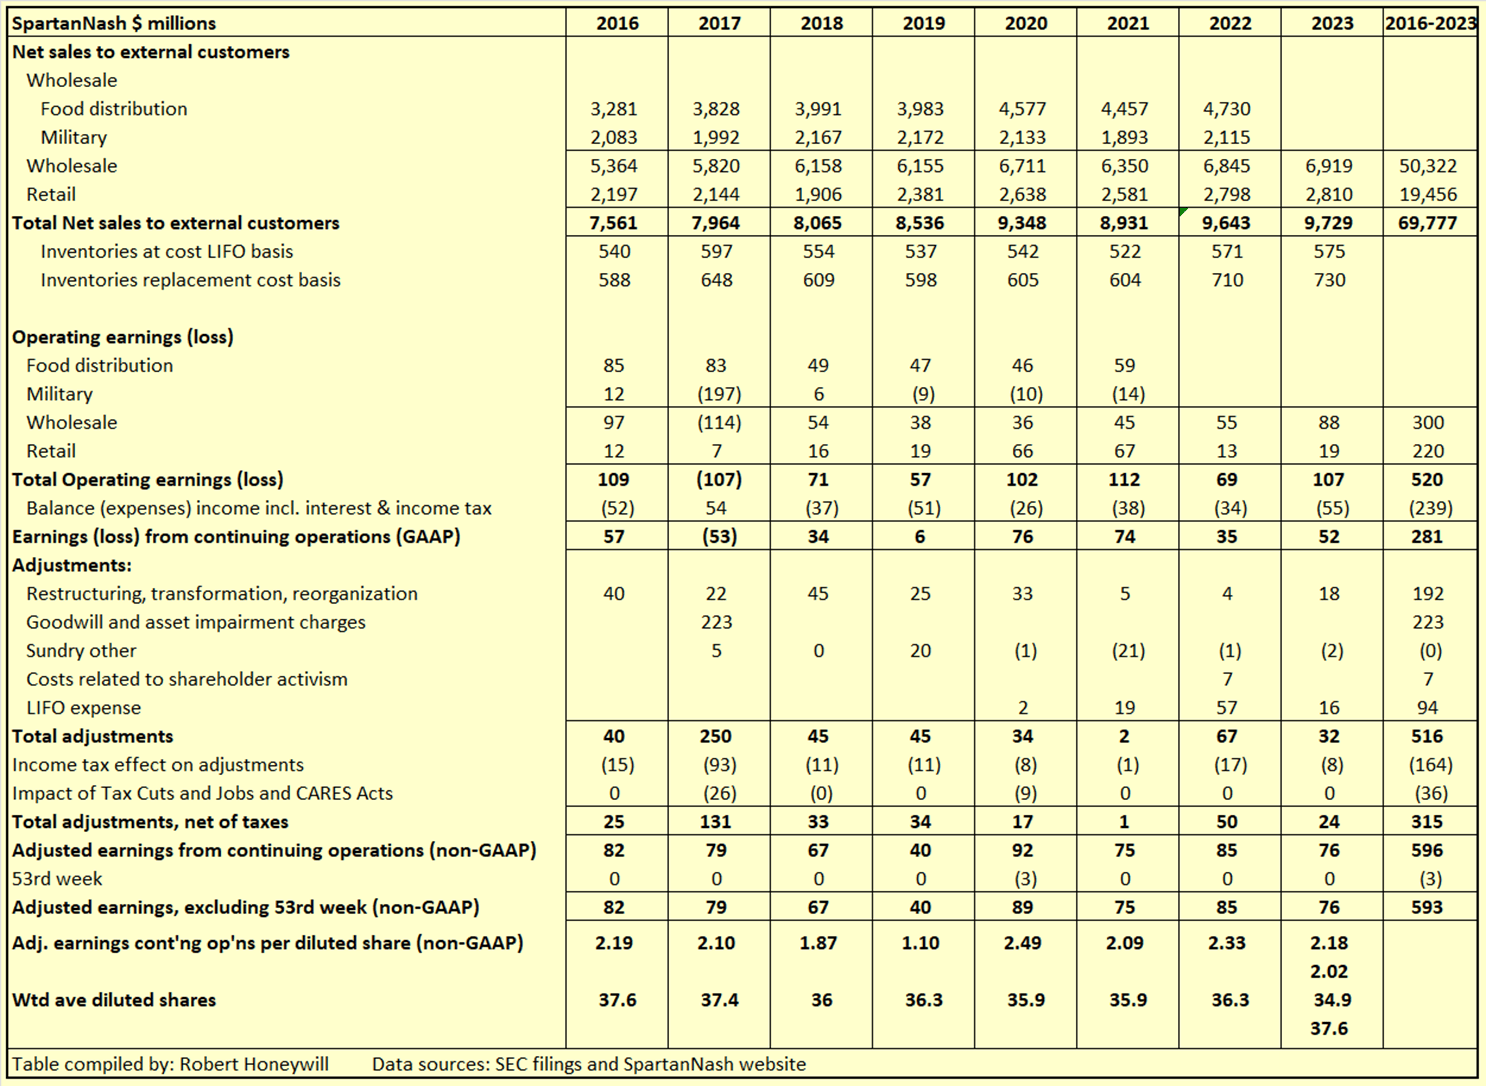
SEC filings and SpartanNash website
Comments on Table A -
Based on the foregoing review, and my detailed analysis below, I am inclined to downgrade SpartanNash from Hold to Sell. On the other hand, if the management enthusiasm displayed in the Q4-2023 earnings call and presentation can be translated into real growth in sales and earnings, that would likely result in an increase in the P/E ratio which together with higher EPS could drive good share price gains above the current depressed share price. Add to that the over 4% dividend yield, and a continuing Hold recommendation, with a wait and see approach is likely the most appropriate course of action.
My usual detailed structured financial analysis follows below.
What I'm primarily looking for here are instances of market mispricing of stocks due to distortions to many of the usual statistics used for screening stocks for buy/hold/sell decisions.
I believe the answer is to compare projections, based on analysts' estimates out to the end of 2024 or later, to past performance. Summarized in Tables 1 and 2 below are the results of compiling and analyzing the data on this basis.
Table 1 - Detailed Financial History And Projections
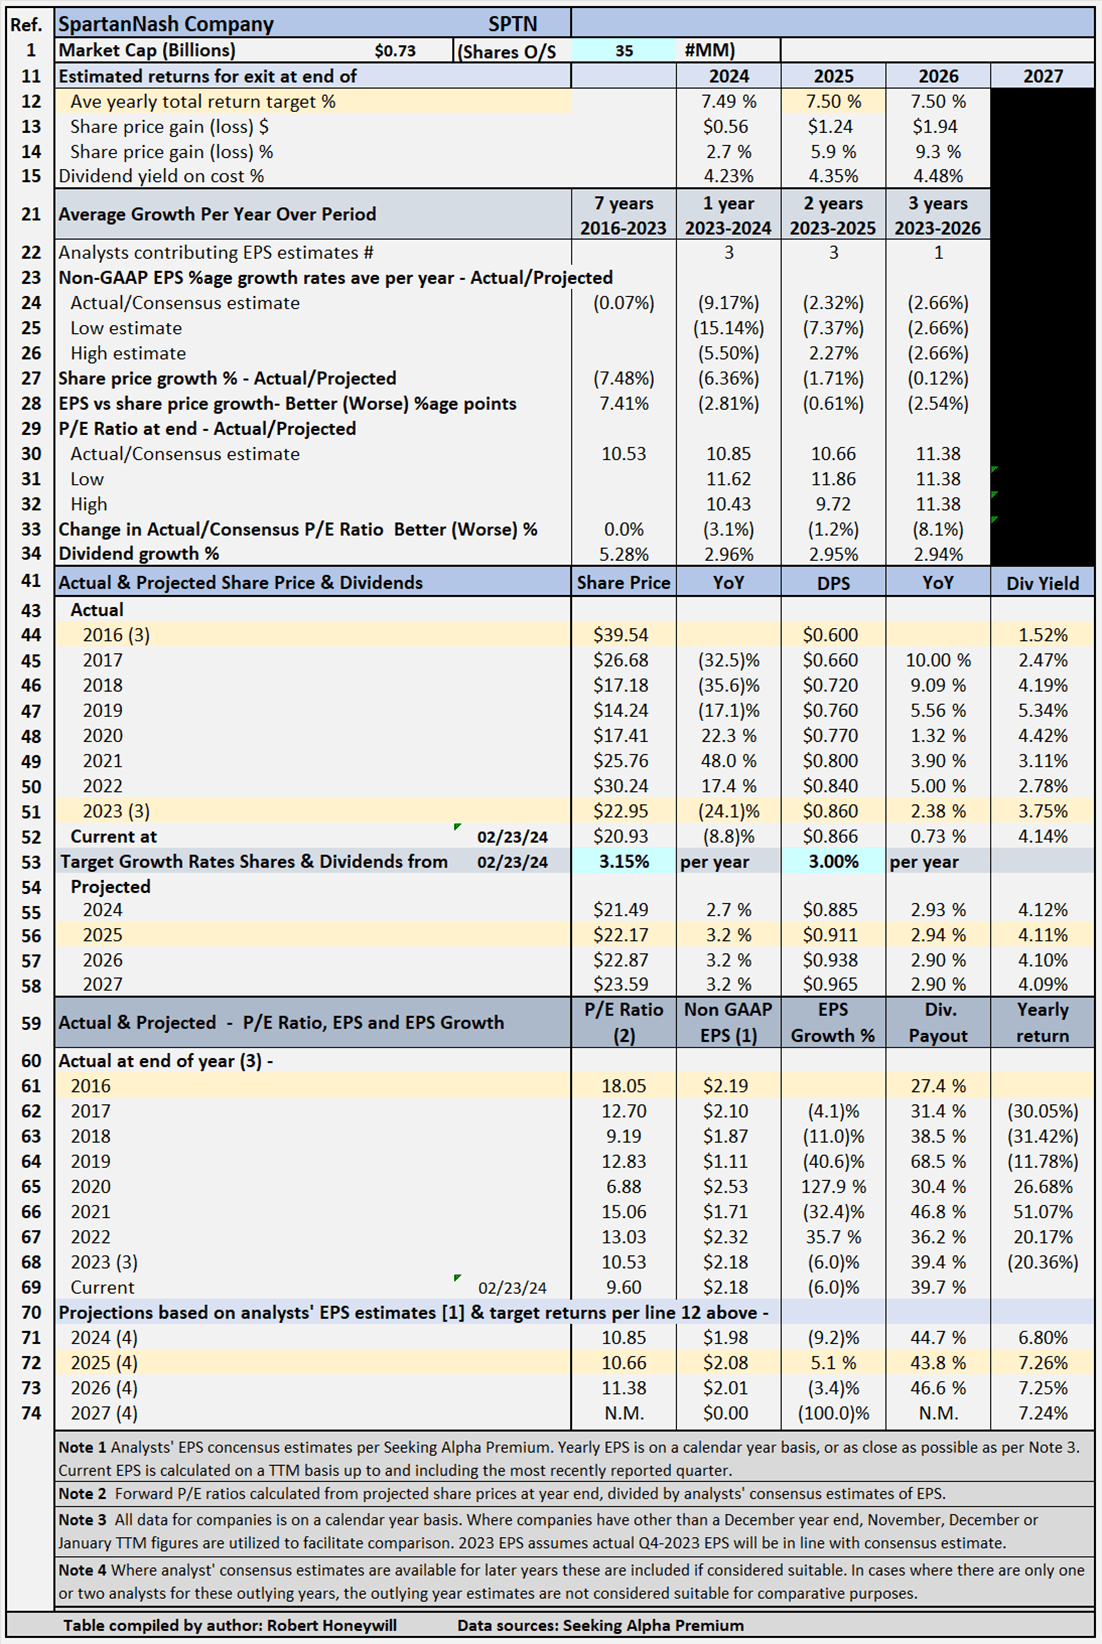
Seeking Alpha Premium
Comments on Table 1 -
Performance over past 7 years - Table 1 shows SpartanNash non-GAAP EPS has barely changed over the past seven years, from $2.19 for 2016 to $2.18 for 2023. Over the same period, SpartanNash's stock price declined by an average (7.48)% per year, from $39.54 at the end of 2016 to $22.95 at the end of 2023. This is primarily due to a decrease in the P/E multiple from 18.05 at the end of 2016 to 10.53 at the end of 2023. Despite the lack of EPS growth, dividend per share has grown by an average yearly rate of 5.28% from $0.60 at the end of 2016 to $0.86 at the end of 2023. This dividend growth rate of 5.28% per year, despite the absence of EPS growth, has resulted in an increase in the dividend payout ratio from 27.4% for 2016 to a still modest 39.4% at the end of 2023. The decline in the share price over the past seven years has been the primary reason for the dividend yield increasing by around 2.5 times, from 1.52% at the end of 2016 to 3.75% at end of 2023. Further decline in the share price through February 23, 2024 has resulted in the dividend yield further increasing to 4.11%.
Modeling for targeted rates of return - Table 1 documents historical data from 2016 to 2019, including share prices, P/E ratios, EPS and DPS, and EPS and DPS growth rates. The table also includes estimates out to 2026 for share prices, P/E ratios, EPS and DPS, and EPS and DPS growth rates (note - while estimates are shown for analysts' EPS estimates out to 2024, 2025 and 2026 where available, estimates do tend to become less reliable, the further out the estimates go. These estimates are only considered sufficiently reliable if there are at least three analysts' contributing estimates for the year in question). Table 1 allows modeling for target total rates of return. In the case shown above, the target set for total rate of return is 7.5% per year through the end of 2025 (see line 12), based on buying at the February 23, 2024 closing share price level. As noted above, estimates become less reliable in the later years. I have decided to input a target return based on 2025 year, which has EPS estimates from three analysts. The table shows to achieve the 7.5% return, the required average yearly share price growth rate from February 23, 2024 through December 31, 2025, is 3.15% (line 53). Dividends and dividend growth account for the balance of the target 7.5% total return.
Table 2 below provides additional scenarios projecting potential returns based on select historical P/E ratios and analysts' consensus, low, and high EPS estimates per Seeking Alpha Premium through end of 2025.
Table 2 - Summary of relevant projections SpartanNash
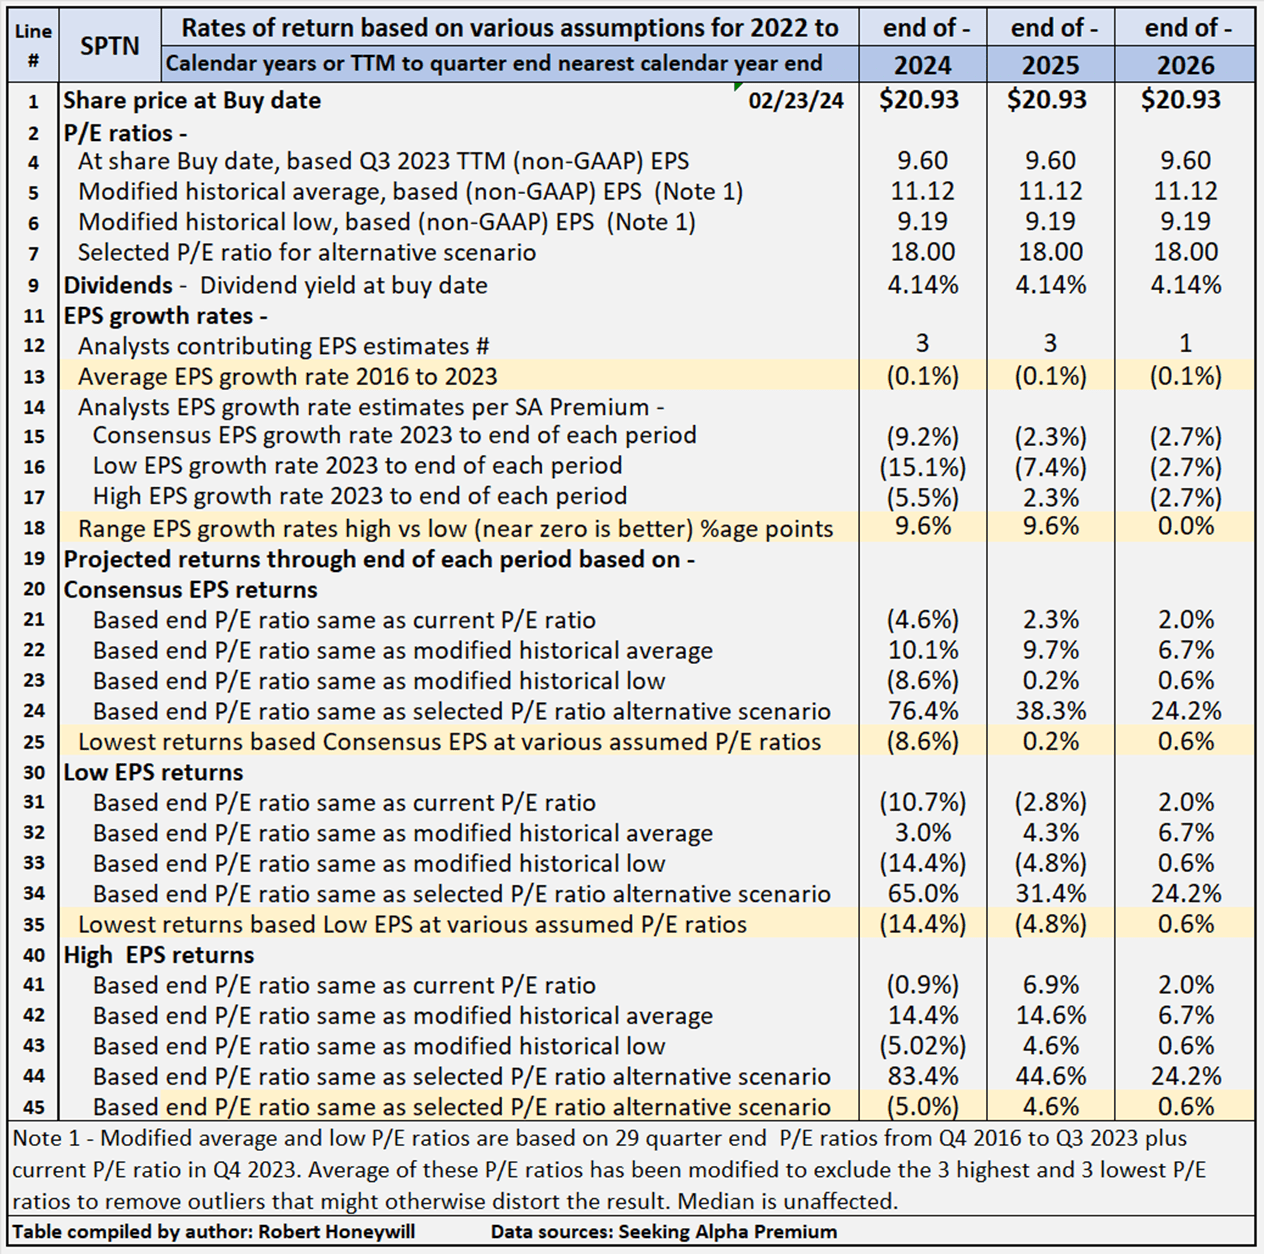
Seeking Alpha Premium
Table 2 provides comparative data for buying at closing share price on February 23, 2024 and holding through the end of year 2024 to 2026 (where estimates are available). There is a total of twelve valuation scenarios for each year, comprised of three EPS estimates (SA Premium analysts' consensus, low and high) across four different P/E ratio estimates, based on historical data, plus a fourth P/E ratio selected to provide an alternative scenario. SpartanNash's P/E ratio is presently 9.60, which is well below the historical average P/E ratio of 11.12. Table 2 shows potential returns from an investment in shares of the company across the range of P/E ratios This analysis, from hereon, assumes an investor buying SpartanNash shares today would be prepared to hold through 2025, if necessary, to achieve their return objectives. Comments on contents of Table 2, for the period to 2025 column follow.
All EPS estimates are based on analysts' consensus, low and high estimates per SA Premium. This is designed to provide a range of valuation estimates ranging from low to most likely, to high based on analysts' assessments. I could generate my own estimates, but these would likely fall within the same range and would not add to the value of the exercise. This is particularly so in respect of well-established businesses such as SpartanNash. I believe the "low" estimates should be considered important. It's prudent to manage risk by knowing the potential worst-case scenarios from whatever cause.
Line 18 shows the range between high and low EPS estimates. The wider the range, the greater disagreement there is between the most optimistic and the most pessimistic analysts, which tends to suggest greater uncertainty in the estimates. There are 3 analysts covering SpartanNash through end of 2025. In my experience, a range of 9.6 percentage points difference in EPS growth estimates among analysts is high, suggesting a considerable degree of uncertainty, and thus increased unreliability.
Lines 25, 35 and 45 show, at a range of historical P/E ratio levels, SpartanNash is conservatively indicated to return between negative (4.8)% and positive 4.6% average per year through the end of 2025. The negative (4.8)% return is based on analysts' low EPS estimates and the 4.6% on their high EPS estimates, with a 0.2% return based on consensus estimates. Those are the lowest of the returns under the consensus, low and high EPS scenarios and are based on the P/E ratio remaining at the current level. At the high end of the projected returns for SpartanNash, the indicative returns range from 31.4% to 44.6%, with consensus 38.3%. These returns would require the P/E ratio to increase from the present 9.60 to the ~18.05 at end of 2016. Coincidentally, SpartanNash's sector median P/E non-GAAP [FWD] ratio is 18.02 per SA Premium. However, sector median percentage growth rates for Revenue, EBITDA, and EPS are in the mid to high single digits. Unless SpartanNash can show growth in these areas, an 18.0 P/E ratio looks like an impossible dream. If the P/E ratio were to increase to the historical average of 11.12 by end of 2025, indicative returns would be in the range of 4.3% to 14.6%, with consensus 9.7%. The difference between best and worst cases is an indication of the degree of certainty in analysts' estimates.
Table 3.1 SpartanNash Balance Sheet - Summary Format
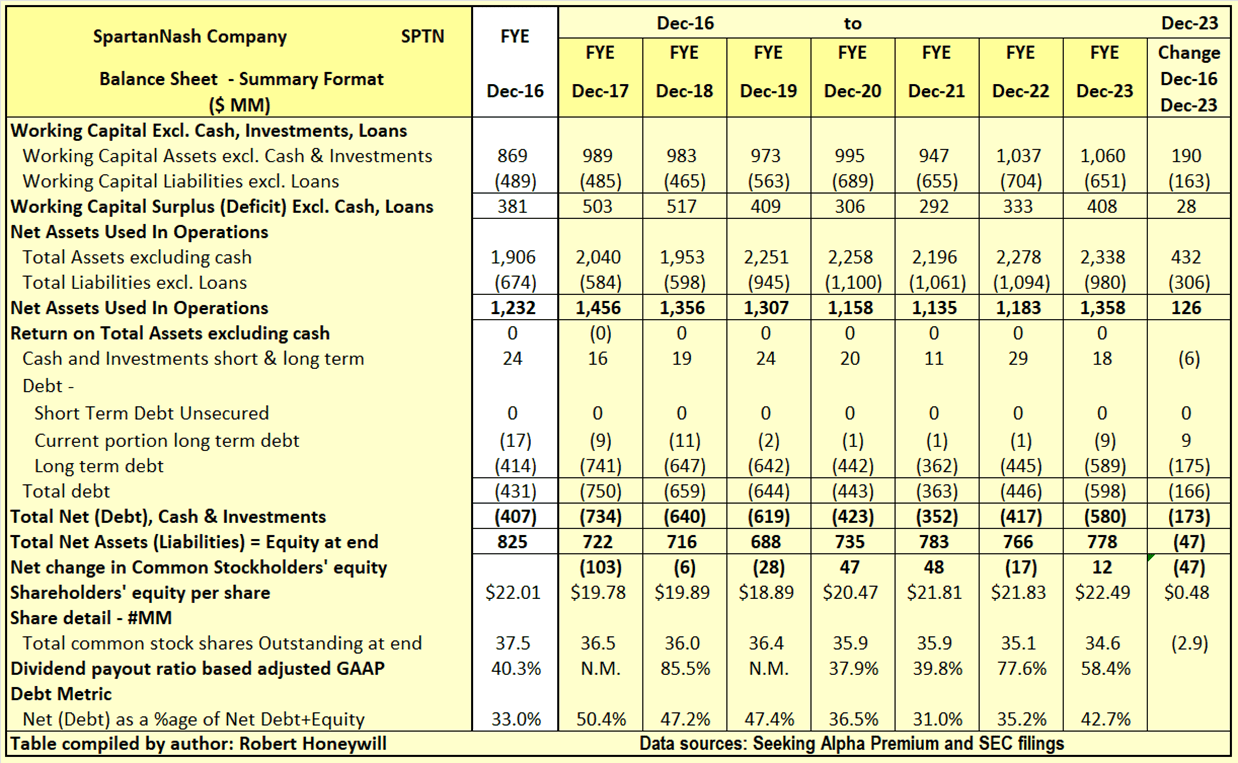
Seeking Alpha Premium & SEC filings
Over the seven years from year end 2016 to the end of 2023, SpartanNash's shareholders' equity has decreased by $47 million. This reduction is reflected as an increase in debt net of cash of $173 million offset by an increase of $126 million in net assets used in operations. Outstanding shares decreased by 2.9 million from 37.5 million to 34.6 million, over the period, due to share repurchases partially offset by shares issued for stock compensation. Net debt as a percentage of net debt plus equity increased from 33.0% at the end of 2016 to 42.7% at the end of 2023. The $47 million decrease in shareholders' equity over the last seven years is analyzed in Table 3.2 below.
Table 3.2 SpartanNash Balance Sheet - Equity Section
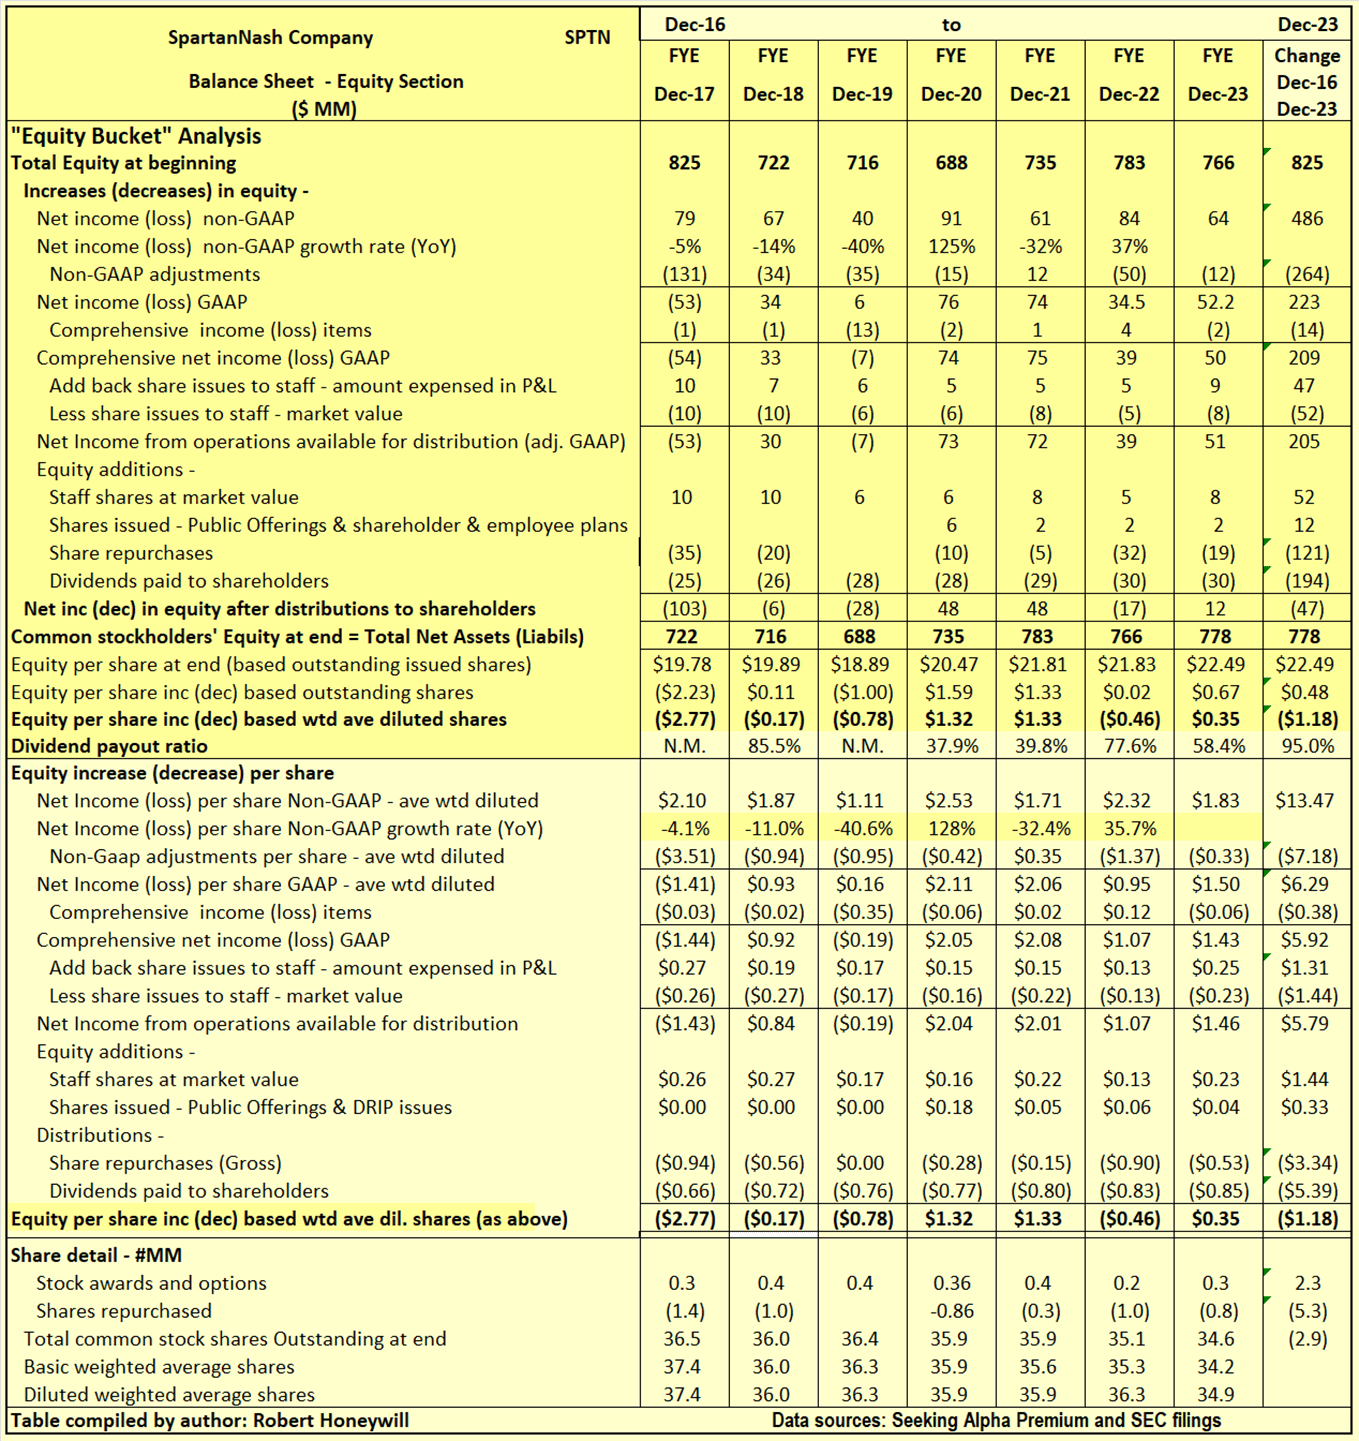
Seeking Alpha Premium & SEC filings
I often find companies report earnings that should flow into and increase shareholders' equity. But often the increase in shareholders' equity does not materialize. Also, there can be distributions out of equity that do not benefit shareholders. Hence, the term "leaky equity bucket." This is happening with SpartanNash.
Explanatory comments on Table 3.2 for the period end FY-2016 to end FY-2023.
Table 1 further above shows, in order for SpartanNash to provide total returns of 7.5% through end of 2025, not only must analysts' consensus EPS estimates be met, but the P/E ratio must increase from the current 9.60 to 10.66. A P/E ratio of 10.66 is below historical average P/E multiple levels of around 11.12 (see Table 2). However, given SA analysts' consensus EPS estimates are for EPS to further decline through end of 2025, an increase in P/E ratio appears unlikely. The major issue for SpartanNash is a lack of growth, and no certainty of future growth. At the same time, the over 4% dividend yield and management's confidence in achieving future growth, indicate a Hold with a wait and see approach is likely appropriate.