
Tom Merton/OJO Images via Getty Images
Tom Merton/OJO Images via Getty Images
The Vanguard S&P Mid-Cap 400 Index Fund ETF (NYSEARCA:IVOO), is a passively managed exchange-traded fund, and closely tracks the performance of the S&P MidCap 400 Index, which is comprised of 400 medium-sized firms in the U.S. The fund is most heavily invested in the industrials, consumer cyclical and financial services sectors.
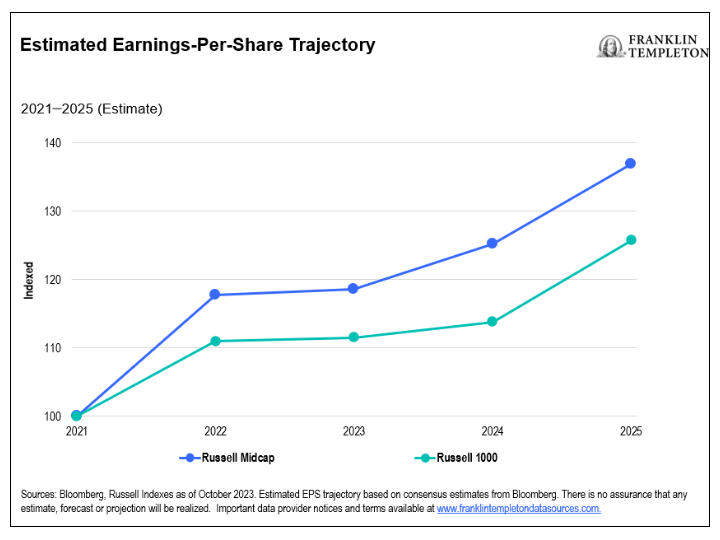
Many advantages exist when investing in mid-cap funds, including stronger returns compared to large and small cap, and comparable risk-adjusted performance versus large cap. Mid-cap funds' outlook for estimated earnings per share over the next couple of years is favorable compared to large cap.
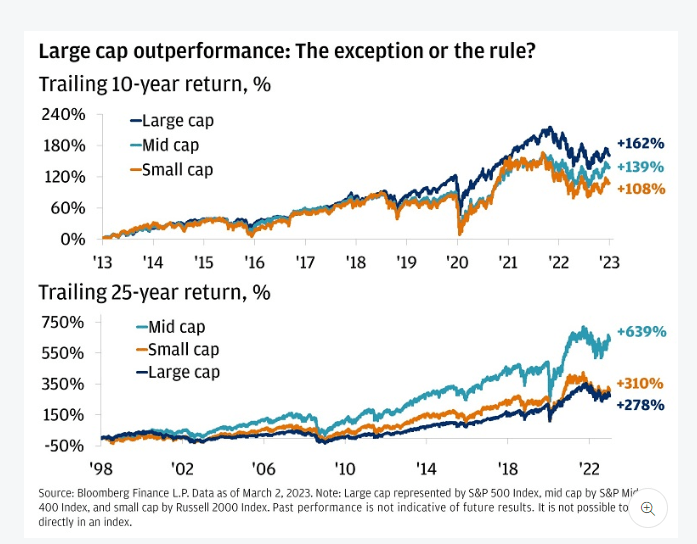
Although large-cap has outperformed over the last 10-years, we see the merit in having strong allocations to mid-cap, as over longer time periods it has outperformed large and small cap, as seen in the chart below.
JPMorgan
We also see that the difference is mid-cap outperformance over the longer time period is much more significant than the large cap outperformance over the shorter time period. Mid-cap has over doubled the total return of large cap over the last 25 years with a delta of 329%, while over the last 10 years, large cap outperformed by only 23%.
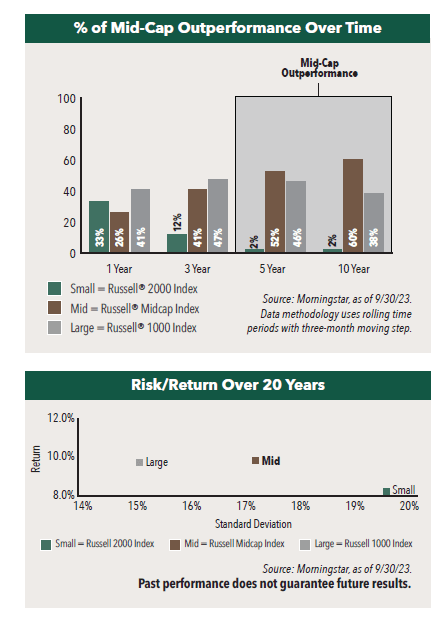
Analysis also shows that mid-cap outperforms in a larger percentage of rolling time periods the further out we look. When it comes to rolling 1- and 3-year periods over the last 20 years, we see from the table below that large cap has outperformed the highest percentage of the time. However, when moving further out, mid-cap starts to overtake large cap, especially at the 10-year mark where mid-cap outperforms 60% of the time.
Hennessy Funds
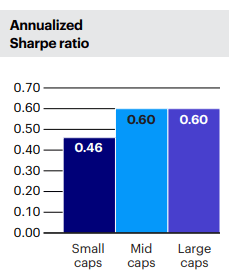
The table below shows how mid and large cap stocks have vastly outperformed small cap in terms of Sharpe ratio (risk-adjusted return).
Invesco
Lastly, estimated earnings per share of mid-cap firms are expected to rise by about 10% more than large caps by 2025.
Franklin Templeton
Below are the top 10 holdings for IVOO and their respective weights.
Ticker | Holdings | Weight (%) |
SMCI | Super Micro Computer Inc. | 0.98% |
DECK | Deckers Outdoor Corp. | 0.78% |
RS | Reliance Steel & Aluminum Co. | 0.66% |
CSL | Carlisle Cos. Inc. | 0.61% |
GDDY | GoDaddy Inc. Class A | 0.60% |
MANH | Manhattan Associates Inc. | 0.60% |
GGG | Graco Inc. | 0.58% |
VST | Vistra Energy Corp. | 0.55% |
RPM | RPM International Inc. | 0.55% |
NBIX | Neurocrine Biosciences Inc. | 0.55% |
Because the weights of all the holdings are very low, we will not go into much detail about the individual names, as the investment thesis is much more predicated on the allocation to mid-cap overall. Super Micro Computer, Inc. (SMCI), builds high performance, energy saving, and environmentally green computer servers, selling into various markets from data centers, edge computing and artificial intelligence. The firm currently has a C valuation grade according to SA data. Deckers Outdoor Corp. (DECK) is a designer footwear company, including many well-known brands in its portfolio, such as UGG, Teva and Hoka. The firm holds a D- valuation rating from Seeking Alpha.
Symbol | IVOO | SPMD | BKMC |
Name | Vanguard S&P Mid-Cap 400 ETF | SPDR® Portfolio S&P 400 Mid Cap ETF | BNY Mellon US Mid Cap Core Equity ETF |
Inception Date | 9/7/2010 | 11/8/2005 | 4/7/2020 |
Total Assets Under Management | $3,202,696,215 | $9,090,196,672 | $454,056,569 |
30-Day Average Daily Volume | 66,291 | 1,540,877 | 8,367 |
Number of Holdings | 404 | 403 | 405 |
Weighted Average Market Cap | $7,458 | $7,580 | $9,319 |
Weighted Average PE Ratio | 15.9 | 16.1 | 17 |
Forecasted 5-Year Earnings Growth | 10.30% | 10.30% | 10.50% |
Forecasted PE Ratio | 15 | 15.2 | 15.9 |
Forecasted Dividend Yield | 1.90% | 1.80% | 1.70% |
Dividend Frequency | Quarterly | Quarterly | Quarterly |
Medium-Cap Exposure | 36.10% | 37.00% | 55.50% |
Small-Cap Exposure | 63.60% | 62.60% | 43.60% |
The table above compares IVOO to one competitor with a much larger amount of assets, the SPDR Portfolio S&P 400 Mid Cap ETF (SPMD) and one with much fewer assets, the BNY Mellon US Mid Cap Core Equity ETF (BKMC). Overall, on these metrics, the funds appear very similar. One noticeable difference is that BKMC has a somewhat higher average weighted market cap, and as a result, it is the only one of these funds that actually has most of its assets invested into mid-cap. This is not a concern for us, as these fluctuations away from the index mandate are often due to temporary changes in firm value in between rebalancing dates. All the funds are expected to experience multiple contraction this year, and all have extremely similar forecasted dividend yields. We prefer IVOO and SPMD over BKMC, due to their higher liquidity and much longer track records.
One risk of investing in mid-cap businesses, which could be an advantage or disadvantage depending on corporate management skill, is that mid-sized firms tend to be more heavily reliant upon one particular revenue stream or business segment compared to larger firms. The disadvantage of this is that if that revenue stream becomes impaired, a firm will be much more adversely impacted compared to a firm that has other segments to support it during times of weakness. However, this can be an advantage as having one very important segment allows a business to stick to its core competencies, which will often be able to generate strong returns on investment. Larger companies can sometimes have their valuations hurt by over-diversification of business segments that do not have synergies.
We like investing in mid-cap over the long term due to the historical results, and we see tailwinds for the market cap segment over the next couple years. IVOO and SPMD are both options for us to invest in mid-cap, and we rate them a buy.