
DNY59
DNY59
This article series aims at evaluating ETFs (exchange-traded funds) regarding past performance and portfolio metrics. Reviews with updated data are posted when necessary.
Invesco S&P 500 Low Volatility ETF (NYSEARCA:SPLV) started investing operations on 05/05/2011 and tracks the S&P 500 Low Volatility Index. It has a portfolio of 100 stocks, a trailing 12-month yield of 2.40% and a total expense ratio of 0.25%. Distributions are paid monthly.
As described in the prospectus by Invesco:
The realized volatility of every stock in the S&P 500® Index is measured using available price return data for the trailing one year of trading days to determine the constituents that comprise the Underlying Index. The Underlying Index weights the 100 constituent securities based upon the inverse of each security's volatility, with the least volatile securities receiving the greatest weights in the Underlying Index.
The index is rebalanced quarterly, and the portfolio turnover rate was 55% in the most recent fiscal year.
The main competitor of SPLV, iShares MSCI USA Min Vol Factor ETF (USMV), reviewed in January, adopts a completely different approach to volatility. It starts from a larger universe, the MSCI USA Index, and constructs an optimized portfolio with "the lowest absolute volatility for a given set of constraints," based on a stock covariance matrix.
SPLV picks in the least volatile stocks, whereas USMV builds a mathematically optimized low-volatility portfolio. As we will see in the next section, this difference has material consequences on the sector breakdown and holdings. Indeed, USMV may hold volatile stocks. For now, let's have a look at a table comparing the two funds' characteristics:
SPLV | USMV | |
Inception | 5/5/2011 | 10/18/2011 |
Expense Ratio | 0.25% | 0.15% |
AUM | $8.05B | $24.79B |
Avg Daily Volume | $130.98M | $255.01M |
Number of Holdings | 102 | 170 |
Assets in Top 10 | 12.6% | 16.9% |
Turnover | 55% | 23% |
Yield TTM | 2.41% | 1.73% |
Dividend Frequency | Monthly | Quarterly |
Div. Growth 5 Yr (annualized) | 7.97% | 5.02% |
Both funds have been listed in 2011. Despite featuring a more sophisticated strategy, USMV has a lower fee and a lower turnover. It also has more assets under management and higher trading volumes. SPLV looks better regarding dividend characteristics: yield, growth and frequency. However, these funds are not primarily designed for dividend investors.
SPLV has a tilt to mid-cap companies, while USMV is heavier in mega-caps.
Size segments (Chart: author; data: Fidelity)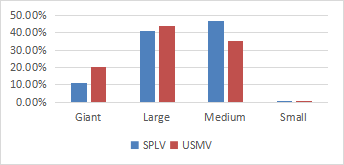
The heaviest sector in the SPLV portfolio is consumer staples (22.2%), followed by financials (17.3%), industrials (14.2%), utilities (12.9%) and healthcare (11.5%). Other sectors are below 8%. Compared to USMV and the S&P 500 index (SP500), SPLV mostly overweights consumer staples and utilities, two defensive sectors, and industrials as well. It massively underweights technology and communication.
Sector breakdown (Chart: author; data: Invesco, iShares, SSGA)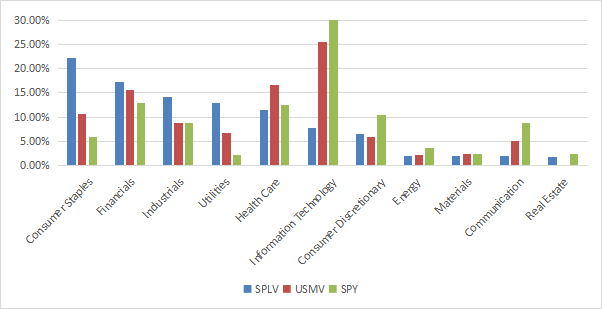
The next table lists the top 10 holdings of SPLV and USMV with their weights in % of asset value and their betas (a relative measure of volatility). Both funds are well-diversified and risks related to individual companies are low. Nevertheless, USMV is more concentrated than its peers in the top 10 (16.9% vs. 12.6%). As expected, regarding the strategy description, the average beta of the top 10 is higher in USMV (0.8 vs. 0.68). The largest position of USMV is quite volatile (Broadcom Inc).
SPLV Top 10 | Ticker | Weight | Beta | USMV Top 10 | Ticker | Weight | Beta |
The Coca-Cola Co. | 1.37 | 0.67 | Broadcom Inc. | 2.32 | 1.26 | ||
McDonald's Corp. | 1.35 | 0.77 | International Business Machines | 1.74 | 0.84 | ||
Berkshire Hathaway. | 1.34 | 0.81 | Merck & Co. | 1.68 | 0.47 | ||
Republic Services | 1.28 | 0.71 | Waste Management | 1.68 | 0.57 | ||
Waste Management | 1.26 | 0.57 | Waste Connections | 1.64 | 0.61 | ||
Colgate-Palmolive | 1.22 | 0.44 | Republic Services | 1.61 | 0.71 | ||
Walmart | 1.21 | 0.34 | Amphenol | 1.59 | 1.05 | ||
Visa | 1.21 | 1.05 | Accenture PLC | 1.56 | 1.06 | ||
Yum! Brands | 1.18 | 0.92 | Berkshire Hathaway | BRK.B | 1.55 | 0.81 | |
Procter & Gamble | 1.18 | 0.52 | T-Mobile US | 1.53 | 0.64 |
As reported below, the valuation ratios of the two low-volatility ETFs are not much different, and USMV looks a bit better in growth. They are cheaper than the large-cap benchmark S&P 500 and show a lower aggregate growth. These numbers point to some overlap of the low-vol style with the value style.
SPLV | USMV | SPY | |
P/E TTM | 21.73 | 21.89 | 24.15 |
Price/Book | 3 | 3.74 | 4.21 |
Price/Sales | 1.68 | 1.97 | 2.73 |
Price/Cash Flow | 12.92 | 13.77 | 16.52 |
Earnings growth | 4.88% | 8.79% | 15.92% |
Data: Fidelity.
Since 11/1/2011, SPLV and USMV have lagged the large-cap benchmark in total return, but as expected, they show a lower volatility. USMV has outperformed SPLV by about 1.2% in annualized return, which results in a risk-adjusted performance superior to the S&P 500 (measured by Sharpe ratio in the next table).
Total Return | Annual Return | Drawdown | Sharpe ratio | Volatility | |
SPLV | 248.85% | 10.65% | -36.26% | 0.8 | 11.83% |
USMV | 299.81% | 11.88% | -33.10% | 0.94 | 11.55% |
SPY | 427.99% | 14.43% | -33.72% | 0.92 | 14.36% |
Calculation with Portfolio123.
The next chart compares the total returns of SPLV, USMV, and three low-volatility ETFs:
The chart starts on 9/19/2016 to match all inception dates. SPLV is the worst performer and FDLO is leading the pack. All these low-vol funds have underperformed SPY.
SPLV vs competitors since 9/19/2016 (Seeking Alpha)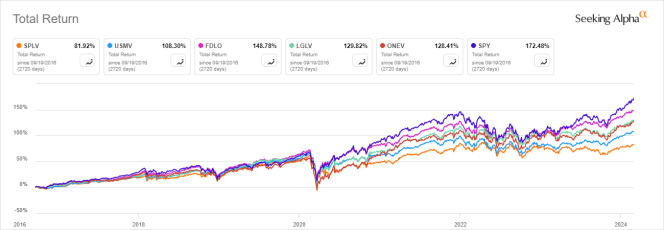
SPLV has also been lagging over the last 12 months:
SPLV vs competitors, 12-month return (Seeking Alpha)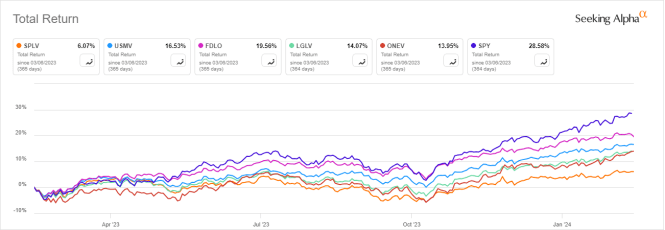
Invesco S&P 500 Low Volatility ETF invests in the 100 stocks of the S&P 500 with a lower price volatility. iShares MSCI USA Min Vol Factor ETF constructs a low-volatility portfolio with an optimized covariance matrix. USMV sophisticated methodology results in more volatile holdings and a heavyweight in technology, which is counter-intuitive for a low-vol fund. However, it shows better metrics than SPLV regarding return, volatility and drawdown since 2011. It even beats SPY in risk-adjusted return. Additionally, Invesco S&P 500® Low Volatility ETF has lagged other low-vol ETFs for several years, which makes it really unattractive.