Spectrum Brands (SPB) Q1 Earnings Top Estimates, Sales Down
Spectrum Brands Holdings Inc. SPB reported first-quarter fiscal 2024 results, wherein the top and bottom lines surpassed the Zacks Consensus Estimate. Results gained from cost improvements, the exit of non-core unproductive categories, reduced inventory and improved fill rates across all businesses.
Shares of this Zacks Rank #2 (Buy) company have gained 10.7% in the past three months compared with the industry's 4.6% rise.
Q1 Highlights
SPB reported adjusted earnings of 78 cents per share, which surpassed the Zacks Consensus Estimate of 31 cents. The figure also came favorably with the year-ago quarterly loss of 32 cents a share. This upside is mainly attributable to higher adjusted EBITDA and reduced interest expenses.
Spectrum Brands' net sales fell 3% year over year to $692.2 million but surpassed the consensus estimate of $674 million. The decline was due to an organic net sales drop of 4.6%. Also, lower sales of small kitchen appliances in North America, fewer volumes in certain Pet channels and the effect of SKU rationalizations contributed to decline. However, favorable foreign currency impacts of $11.7 million acted as a tailwind.
Spectrum Brands Holdings Inc. Price, Consensus and EPS Surprise
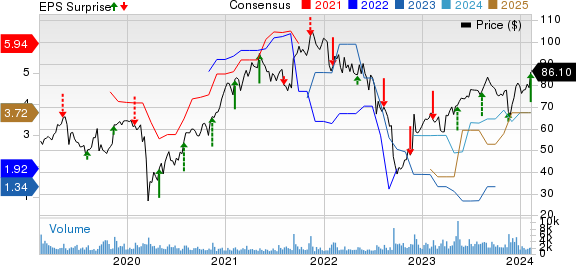
Spectrum Brands Holdings Inc. price-consensus-eps-surprise-chart | Spectrum Brands Holdings Inc. Quote
The gross profit increased 21.3% year over year to $244.9 million, driven by improved pricing and cost improvements, which partly offset currency headwinds and lower volumes. Meanwhile, the gross margin expanded 710 bps year over year to 35.4%.
SG&A expenses inched down 1% to $219.9 million. The company’s operating income was $25 million due to lower spending on restructuring, optimization and strategic transaction activities, fixed-cost containment efforts and reduced factoring charges, offset by higher investments in advertising and marketing. It reported an operating loss of $20.2 million in the year-ago quarter.
Adjusted EBITDA advanced 111.8% year over year to $84.3 million in the fiscal first quarter. The adjusted EBITDA margin expanded 660 bps year over year to 12.2%, driven by better gross margins and interest income, as well as lower operating and interest expenses.
Segmental Performance
Sales in the Home & Personal Care segment decreased 5.8% year over year to $343.3 million due to a category decline from lower demand, particularly in small kitchen appliances and lower sales in North America stemming from soft consumer demand and the exit of certain small Kitchen Appliance SKUs. On the flip side, higher sales in the International markets across Personal Care and small Kitchen Appliances categories somewhat offset the decline. Excluding the $6.7 million impact of favorable currency rates, organic net sales for the segment fell 7.6%.
The segment's adjusted EBITDA soared 102.3% year over year to $26.7 million. Meanwhile, the adjusted EBITDA margin contracted 420 bps year over year to 7.8% due to lower-cost inventory, inventory-associated expenses and cost-improvement efforts.
The Global Pet Care segment's sales moved down 0.2% year over year to $276.9 million, driven by persistent softness in the global aquatics category and the decision to exit multiple non-strategic categories and SKUs, offset by an increase in the companion animals category. North American sales fell on weak demand in aquatics and the SKU exits. Sales in EMEA grew on growth in the Companion Animal category resulting from higher dog and cat food sales. Excluding the $5-million impact of favorable foreign currency, organic sales fell 2%.
The segment's adjusted EBITDA grew 41.7% year over year to $52.7 per share, while the adjusted EBITDA margin expanded 560 bps year over year to 19%, driven by lower cost inventory year over year, positive product and channel mix and savings from cost-reduction efforts.
The Home & Garden segment's sales rose 0.8% year over year to $72 million, mainly backed by increased sales in the Controls business. Sales in the Cleaning category fell, as consumer demand for a few product lines within this category was soft.
The segment's adjusted EBITDA loss of $0.7 million improved from a loss of $2.4 million in the year-ago quarter, driven by increased sales, manufacturing efficiencies and lower operational costs, offset by elevated investments in innovation and advertising.