
Phiromya Intawongpan
Phiromya Intawongpan
In my previous Chart Book, I discussed how we were entering a window of weakness following the mid-September quarterly options expiration. The last two or so weeks in September and the first week of October generally represent a window whereby the structurally positive flows of Vanna and Charm that are typically present during normal market conditions (a dynamic exacerbated this year due to the suppression of volatility via record structured product issuance) go on holiday for a longer than usual period of time. Thus, this period sees the opening of a window whereby bearish fundamental and macro flows are able to push markets to where they should rightly be.
Thus far, this window of weakness has played out to a tee. The question now becomes whether we have seen enough of a correction to presage another leg higher into year end or whether this is the resumption of the bear market the macro and fundamental outlook for equities suggests is warranted.
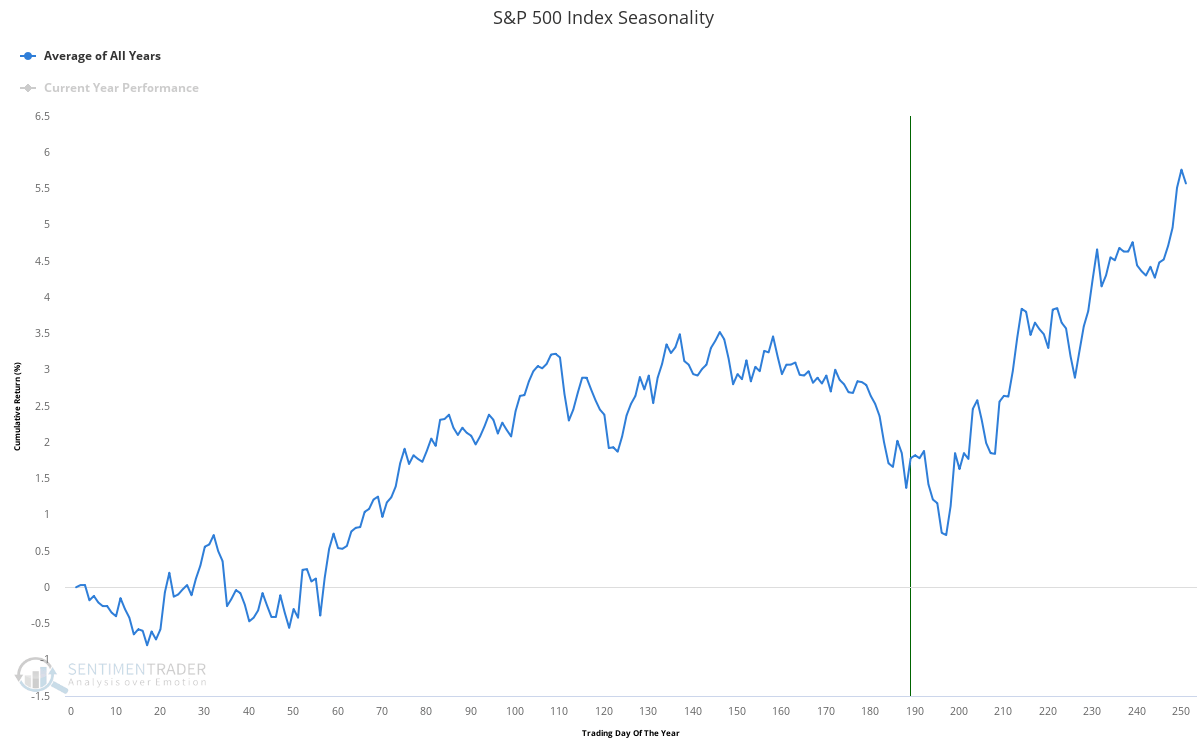
While I am not necessarily convinced we are going to see a blow-off top into year-end, I do believe it remains the more likely scenario than a full-blown market crash in the short-term. This bias is based around the implications of seasonality, which is years such as 2023 have significant structural reasons why it matters for markets, including:
There remains a decent supply of skew and volatility, meaning bullish Vanna and Charm flows will be powerful during the final months of the year.
These flows should enter the market during the November to December period whereby there is the highest number of public holidays for the year, meaning there is less time in which markets are open (roughly 65% of the volume-weighted time compared to other months). Thus, more of the equity flows have the potential to be dominated by positive Vanna and Charm flows.
Performance chasing by hedge fund and equity managers who have lagged the index all year, and see this correction as a buying opportunity to pick up some alpha as we close out the year.
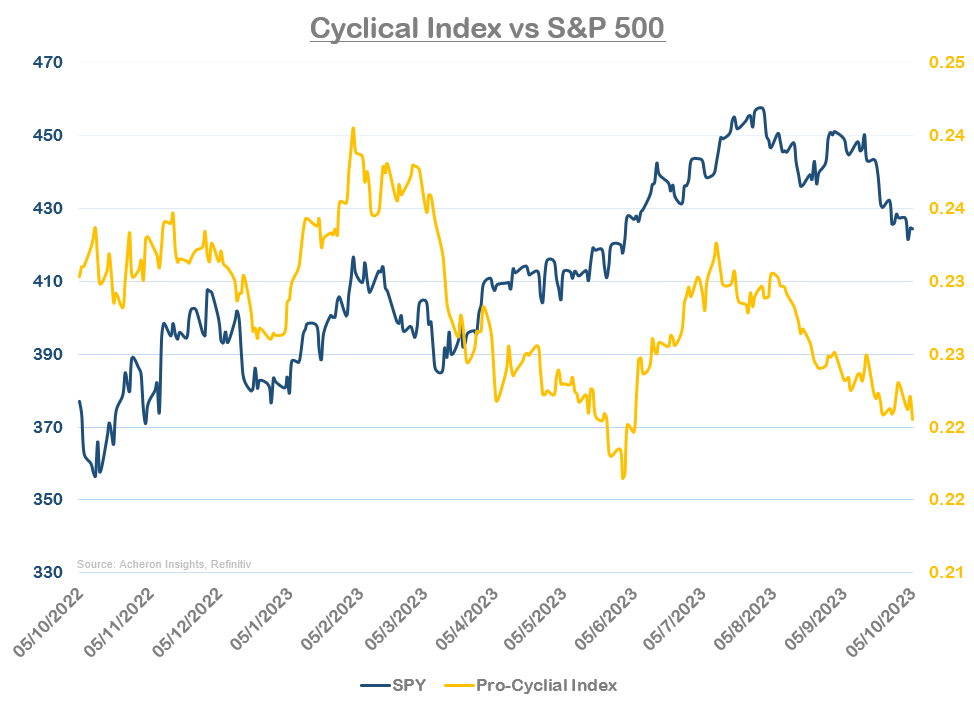
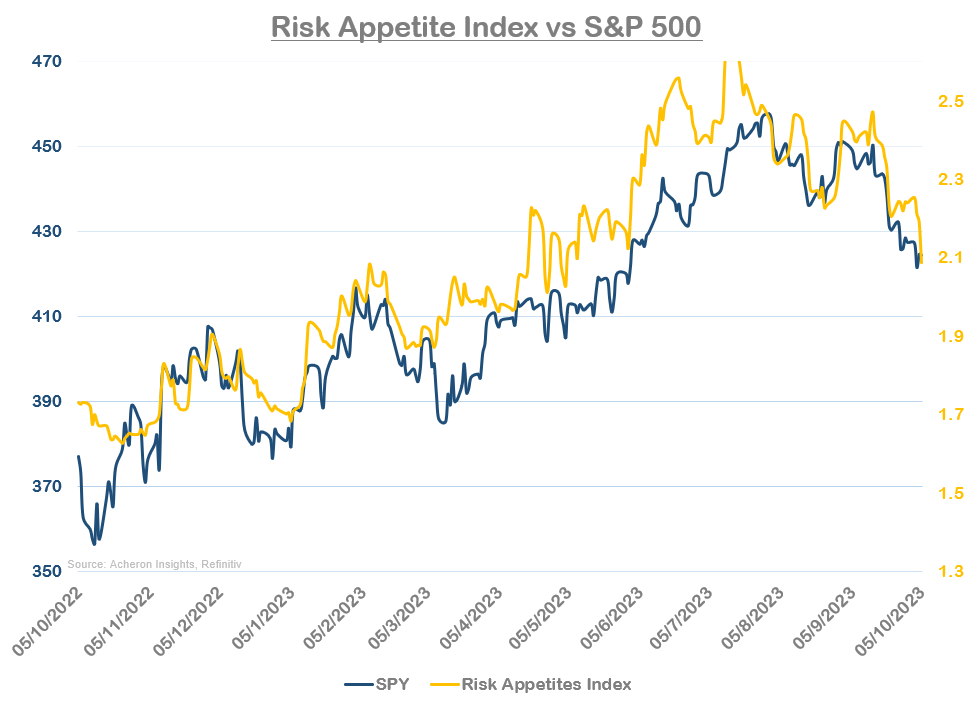
Looking at market internals, we currently aren’t being given any material bullish or bearish signals. My Cyclical Index has corrected in-line with the market after disconfirming much of the post-April rally, while my Risk Appetites Index has also moved lower in-line with the market. Preferably, I would like to see some kind of positive divergences before proclaiming any year-end rally is guaranteed.
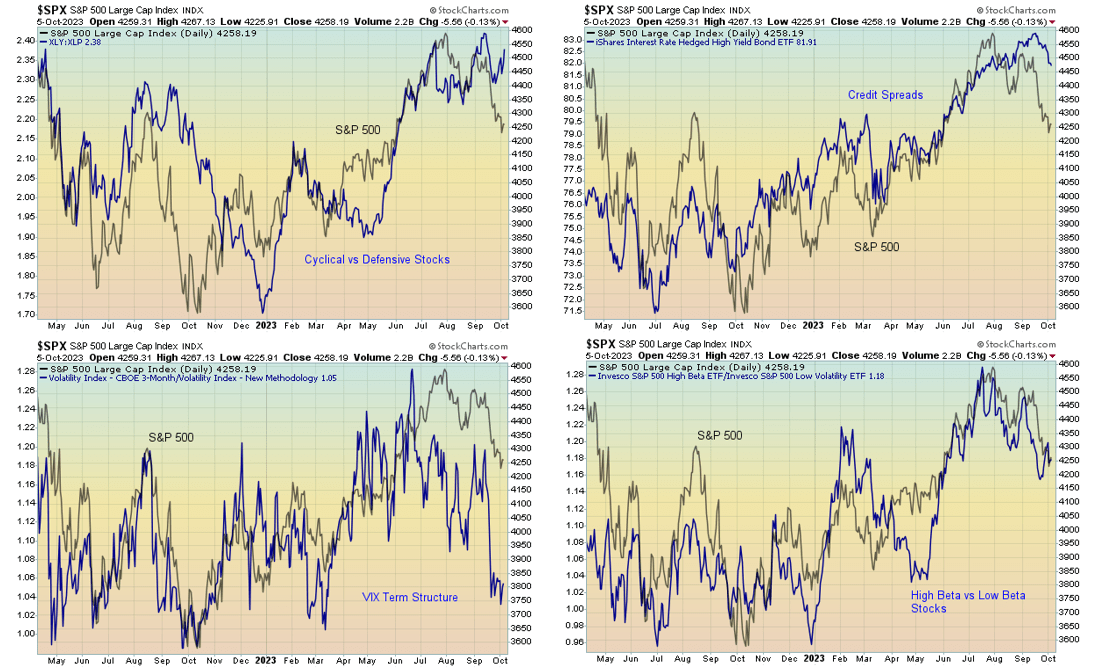
Delving deeper into some of the individual market internals indicators themselves, we can see the cyclicals vs defensives ratio is particularly supportive of this being a tradable low, with credit spreads also sending a similar message.
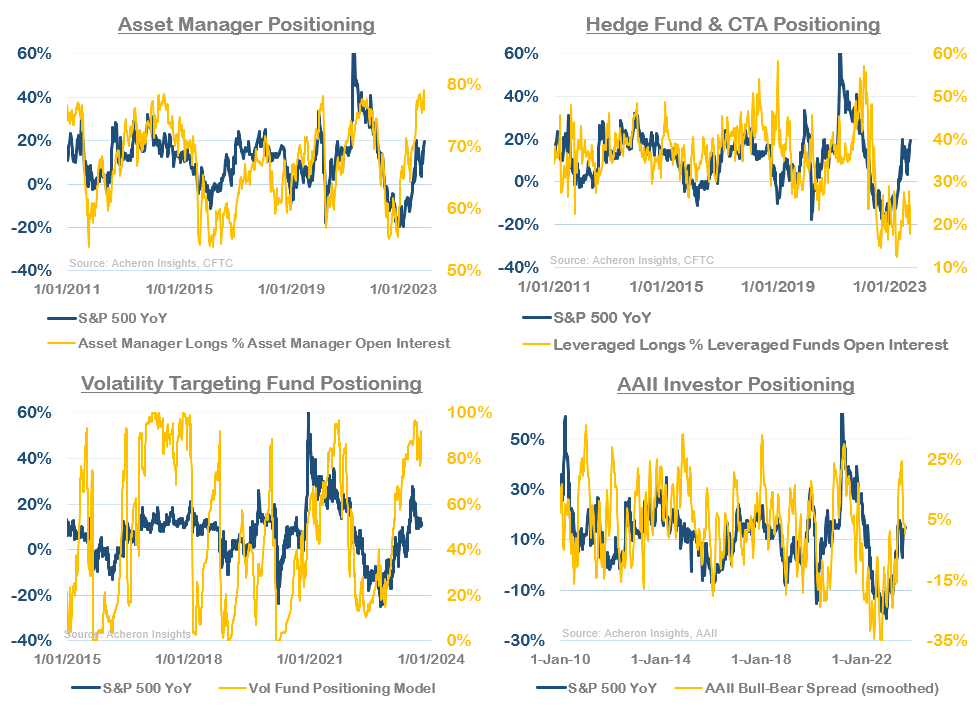
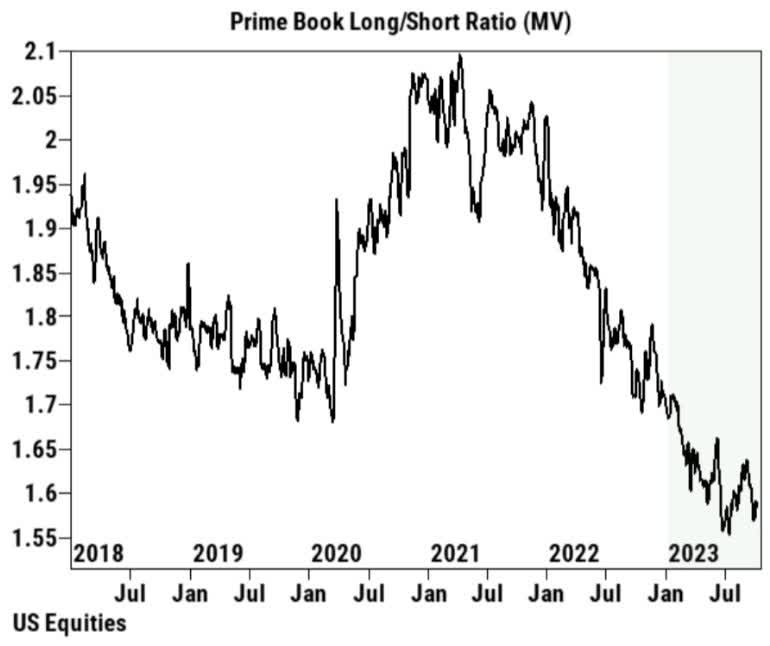
From a positioning perspective, this correction has gone a long way to reduce some of the excessive bullishness we were seeing a couple of months ago. While asset managers and volatility targeting funds are still very long the market, hedge funds, CTA’s and investor sentiment is far more neutral.
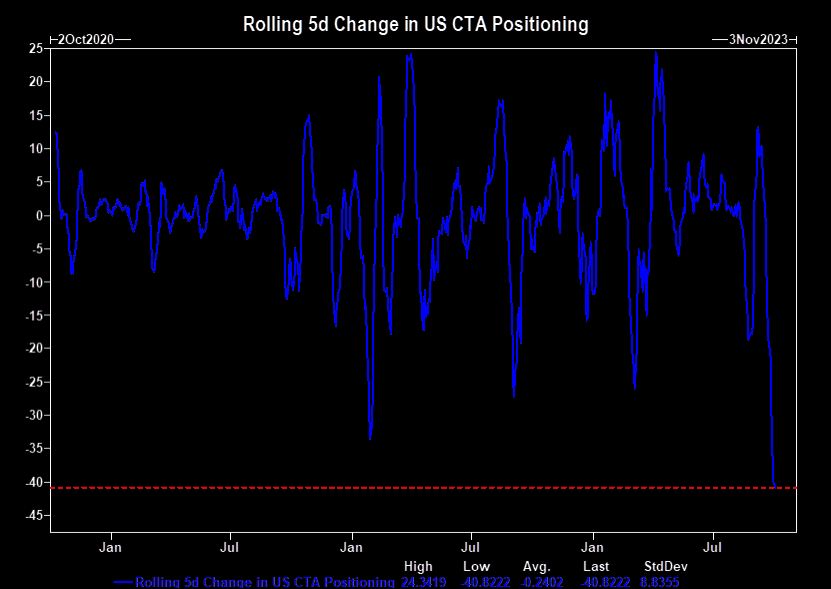
Most notably, this sell-off has seen a big unwinding in CTA positioning toward equities. Easily the largest in a couple of years, CTA’s have gone from significantly overweight to now significantly short the market. Much of the fuel they provided this sell-off is now exhausted.
Source: Goldman Sachs 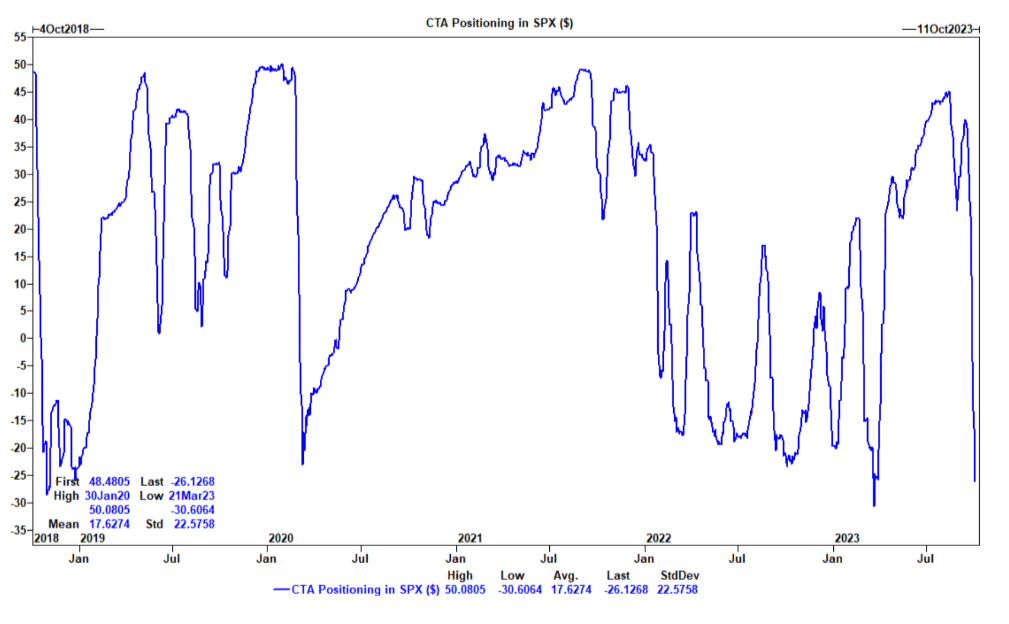
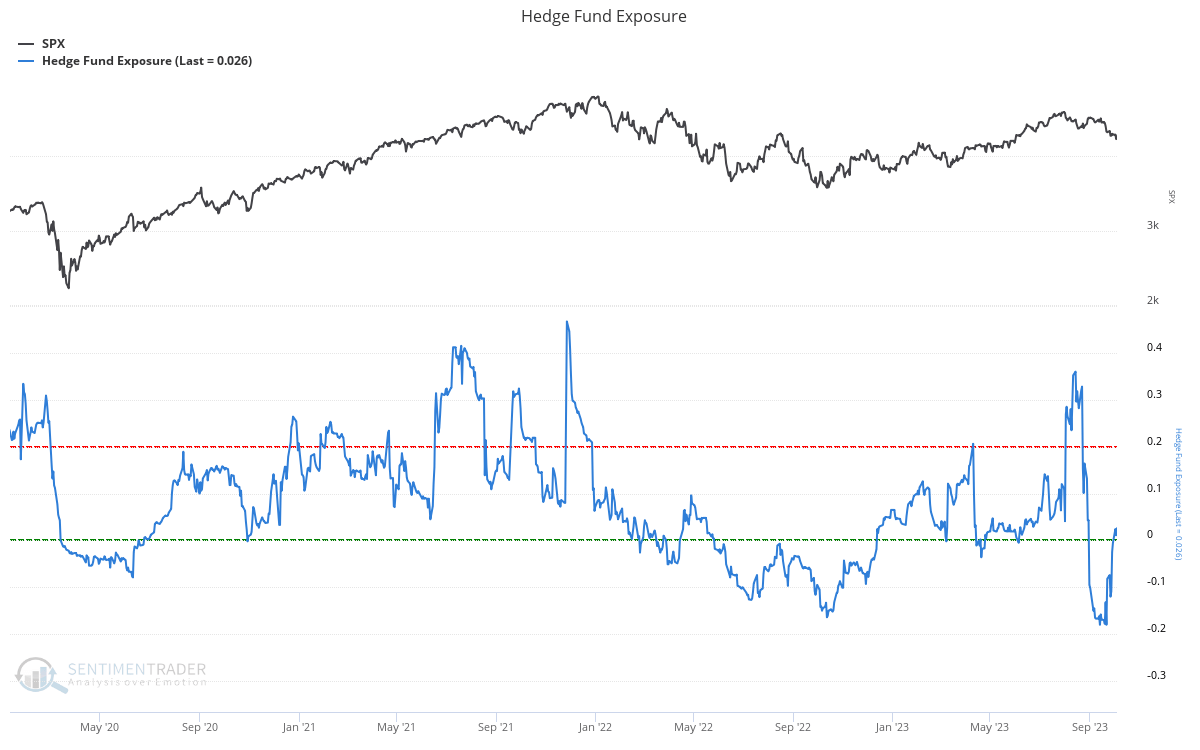
The same can be said of hedge funds, whose exposure to the market has gone from materially net-long to net-short. Whilst we have seen a pick-up in hedge fund exposure over the past couple of weeks, their positioning remains relatively benign and should we see a rebound over the next few weeks that sees shorts get squeezed, leveraged players such as hedge funds and CTA’s could provide plenty of fuel to fire a blow-off top into year end.
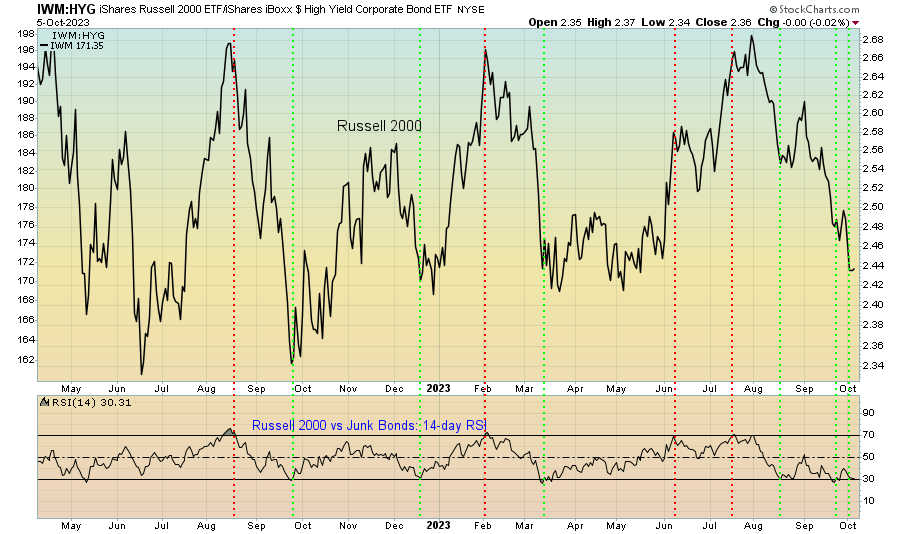
Another trend worth noting is I am seeing a number of short-term buy signals begin to pop up. One such example is the Russell 2000 vs junk bonds (HYG) RSI, which has reached extreme oversold territory. This generally coincides with short-term moves higher for small caps at the very least.
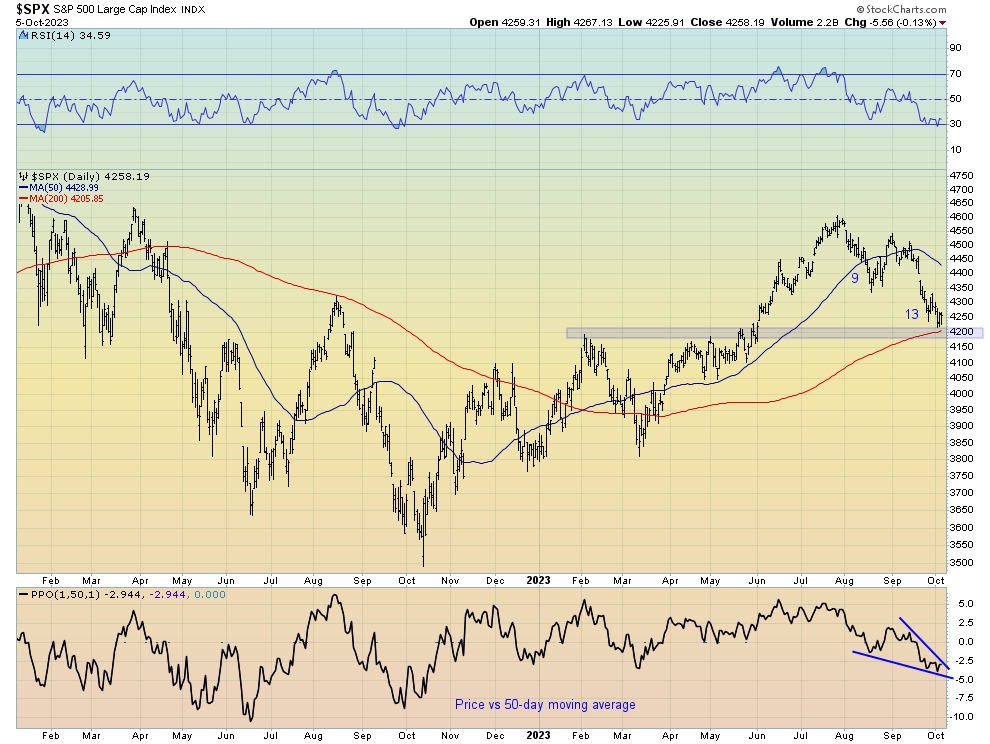
From a technical perspective, the S&P 500 has corrected back to a notable support level around 4,200. Given this level also coincides with the 200-day moving average, it seems like a reasonable place for the market to stage a bounce. At the very least, the stage is set for another volatile month in October.
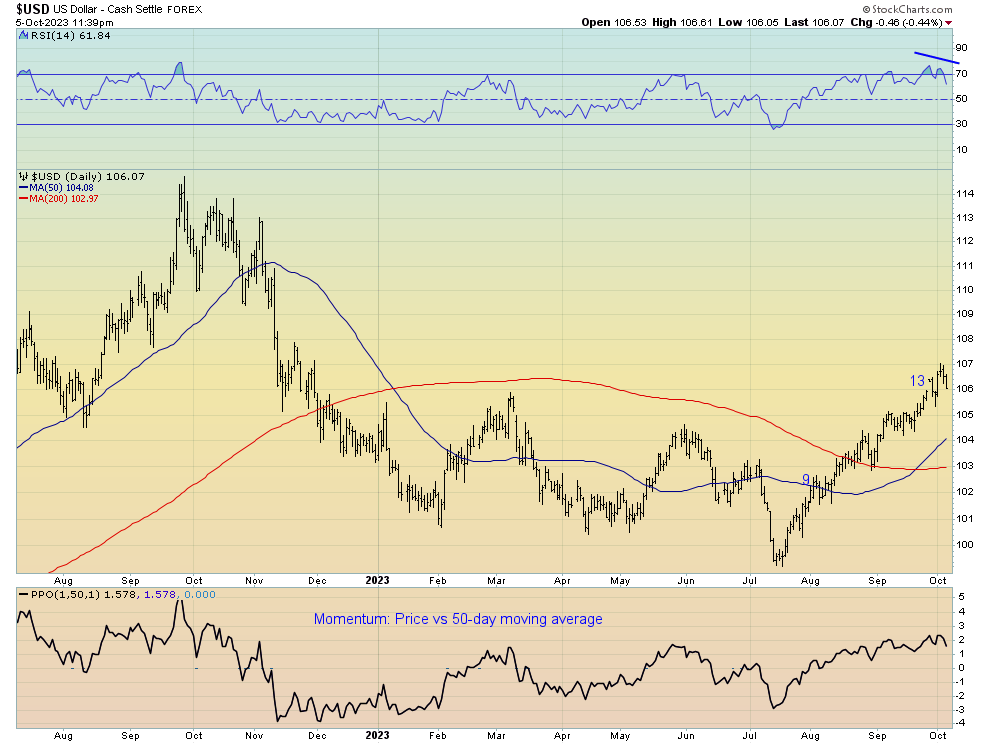
At the centre of this recent turmoil in both the stock market and bond market has been the rapid rise in the dollar since mid-July. A higher dollar is very bad for liquidity, so any move lower in the DXY in the weeks or months ahead should help to provide some calm in risk-assets. Though I remain bullish the dollar over the medium-term, I’d expect some kind of consolidation and/or pull-back is warranted given how one-directional it has traded in recent months.
Another market development worth pointing out has been the rapid correction in crude oil this past week. Although I was expecting a move lower in oil prices (as detailed here), the fact it has happened this quickly is somewhat concerning, especially given we have seemingly lost the 200-day moving average.
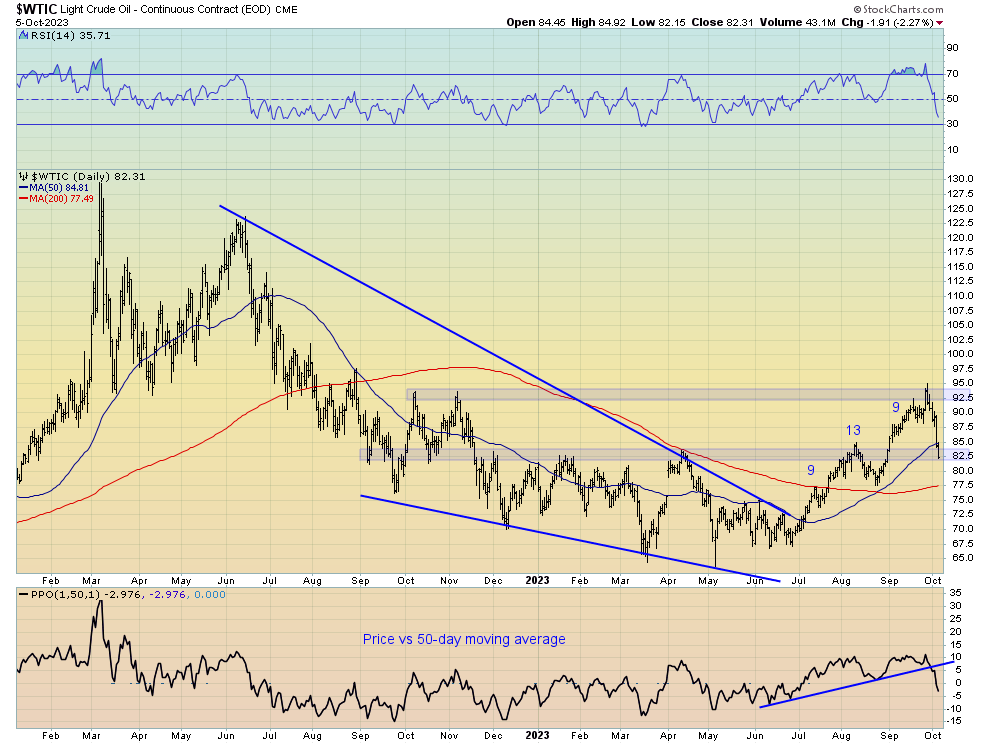
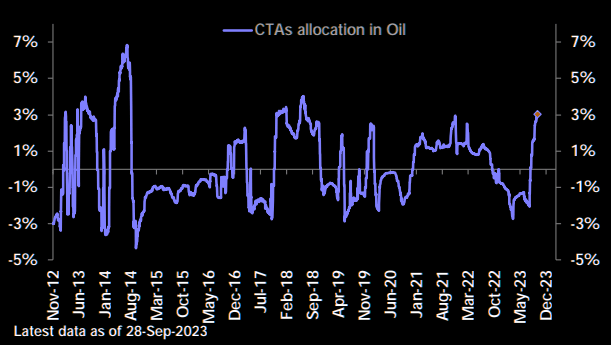
One of the primary reasons why I’ve been expecting oil to correct was as result of the degree to which hedge funds and CTA’s had gotten themselves long oil in recent weeks. CTA’s in particular were the most overweight oil they had been in years.
Overall, the fundamental outlook for oil remains largely positive for the next few months, and there remains a decent chance we see WTI again test the mid-to-low $90s before the year is out. The current washout of speculative positioning should only support this case, it’s now a matter of whether WTI can find support around $82 or $75.
Editor's Note: The summary bullets for this article were chosen by Seeking Alpha editors.