AK2
AK2
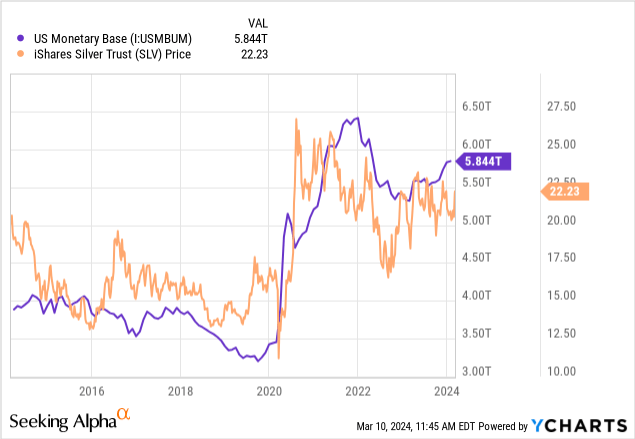
In December, I published my latest analysis of the silver market. At that time, I held a bullish outlook for the silver ETF (NYSEARCA:SLV) based on my view that the monetary base would rise. Fundamentally, as detailed in that article, silver is the ultimate hedge against the monetary base. The monetary base is, in simple terms, all the money that exists in either paper or digital form (i.e., bank reserves in the Fed). As that figure rises or falls, silver (in USD terms) usually follows suit. See below:
Importantly, my views on silver are not a short-term or technical outlook, but a long-term one based on the fundamental instability of the US monetary system. By instability, I do not mean risk of collapse, as some silver bulls see, but the likelihood of prolonged monetary issues that should cause silver to outperform other assets over a ~10-year horizon. I also believe the short-term outlook for silver is relatively bullish, as there are many reasons to think 2024 will see the most significant increase in monetary instability since 2020.
Of course, that view is speculative and data-dependent. Much of this critical data has changed over the past four months. Thus, I believe it is an excellent time to examine the critical economic data for silver to give an updated outlook for its short-term and long-term potential.
My core silver thesis mirrors that of most silver bulls. Put simply, the US has so much public (government) and private (household) debt that, to me, it is virtually inevitable that it can only be reduced by currency devaluation. From that standpoint, I am not bullish on silver but bearish on fiat currency, and I see silver as the ideal way to short fiat currency, which has specific benefits to gold and bitcoin.
However, unlike many silver bulls, I do not necessarily believe this will be a sizeable short-term devaluation. Although possible, I see the likeliest outcome is a decade or more of ~4% inflation. Over that period, we could see inflation range from 0% to 8%, but likely with a trend toward acceleration. It seems to be an excellent short-term period to invest in silver because inflation has declined considerably, causing most investors and mainstream analysts to assume that the US economy is re-entering the <2% inflation dynamic seen in the 2010s, which would be bearish for silver.
That said, there are indications that inflation is in a mid-cycle trough, which may be followed by a return to 8% YoY inflation. The strongest indication is the huge re-acceleration we see in service inflation. Services account for ~61% of the CPI, including critical costs such as shelter, healthcare, and insurance. Commodities less food and energy account for ~19%, with the other 20% going to food and energy. Changes in food and energy prices primarily drive short-term fluctuations in the CPI. As those input costs change, they tend to alter prices in other goods (such as clothes) as higher or lower fuel costs change commodity production costs. However, while goods are most often discussed regarding the CPI, services account for most personal spending and are, by far, the most stable inflation gauge, not being so subject to changes in input costs. See the annualized monthly data below:
CPI Services vs. Goods (Federal Reserve Economic Database)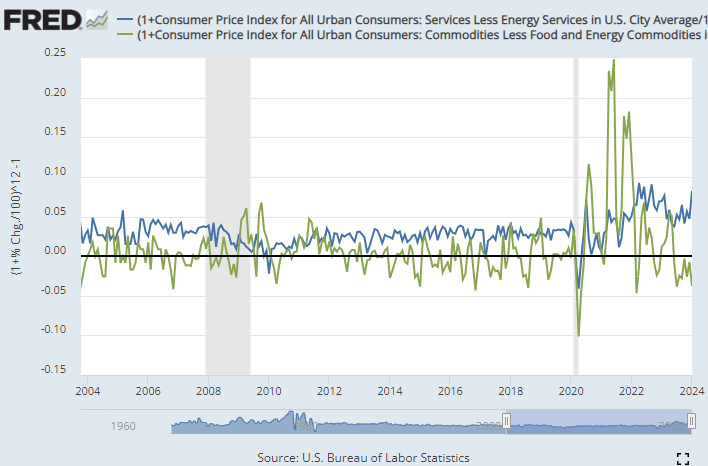
Note that these data depict annualized metrics on monthly price changes, not the "slow" YoY metrics that are usually discussed.
I believe this is the single most important chart for those interested in the economy today. It clearly shows a trend that remains hardly discussed by mainstream economic analysis, but is a growing issue spoken of by the Federal Reserve. There is a notable divergence between services inflation and goods inflation. Today, goods, excluding food and energy, are becoming cheaper YoY at around 3.7% annualized. However, the more essential services segment is becoming more expensive at over 8% annualized.
Realistically, depending on their lifestyle, many people are more exposed to inflation in services than goods. Some readers may find that they pay over 61% of their income toward services instead of goods; thus, inflation is rising much faster than the CPI headlines suggest. Further, as discussed in some of my articles, inflation may have been persistently ~2% higher than the headline figure suggests in recent years because of how services are calculated. If so, today's economy would be stagnant, as opposed to growing (as the headline suggests), which more appropriately explains lackluster (though not abysmal) consumer sentiment.
Since the services CPI segment has a more stable inflation rate and is far less exposed to international currency and commodity market volatility, the overall CPI rate usually fluctuates around the services CPI rate, not the goods rate. Services CPI is now at 8% annualized, roughly the same peak it reached in 2022. It was followed by a >8% overall inflation rate, driven by a substantial short-term commodity price increase.
In my view, similarly to the 1965-1980 period, we're in the middle of a trough in the inflation rate, and an even more considerable rebound may follow. In the last US currency devaluation, the inflation rate dipped significantly on three occasions, eventually peaking at over 15%. Over that period, silver rose from $1.3/oz to $20/oz by 1980. Technically, it peaked at ~$50/oz in 1980, but that was due to a market-cornering event. Thus, silver is about as expensive as it was in the 1980 market, despite tremendous currency devaluation. From both a gold and CPI-adjusted view, silver is discounted today. See below:
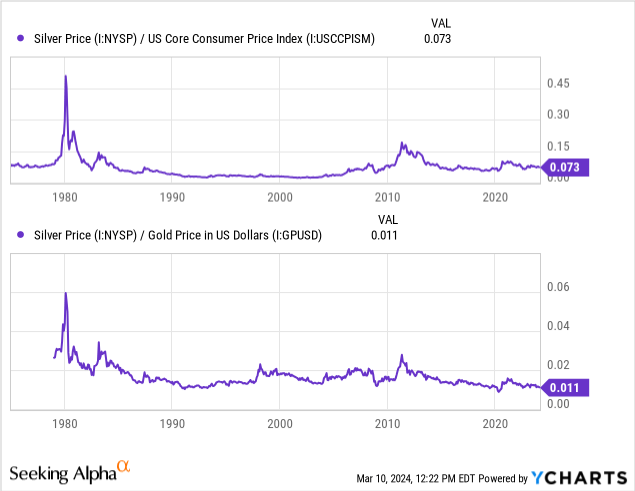
Silver was discounted more around 1990 to 2000, but that occurred during the great inflation moderation. Although some believe inflation will return to the <2% range as in then, I think that is extremely unlikely. Inflation in services is already back to 8% and, as detailed in-depth here, there is reason to believe the US government will need to pursue QE within the coming years to ease its debt burdens, which are accelerating with interest rates.
As discussed in my last SLV article, the ETF is also a solid hedge against banking risks. My longstanding view is that most regional banks remain on the cusp of collapse due to their negative or low fair-value equity positions. It is true that these "paper losses" will not be realized automatically. However, in the event of a decline in deposits (as we're seeing)or a rise in loan losses (as we're starting to see), they can cause rapid bank failure. The US government can do very little to stop this issue, and its efforts to delay it are not working too well, as seen in the recent New York Community Bancorp (NYCB) crisis.
As noted in my last SLV article, the key figure to watch regarding bank issues is likely to reverse repurchase liabilities from the Federal Reserve. Many banks garnered significant excess liquidity during the deluge of the monetary stimulus of 2020. That liquidity has offset the negative liquidity drain of QT and high interest rates, particularly for larger banks (which are often liquidity suppliers to smaller banks). As these banks drain their reverse repo assets (liabilities to the Fed), this hidden source of cash will dry up, potentially accelerating liquidity deficits in the most exposed banks. See below:
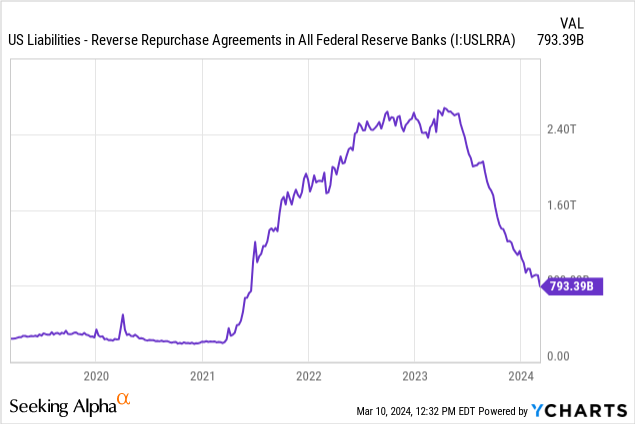
Over the past year, this figure has declined to ~$140B per month, so it should fall to zero by five to six months from now, or around August to September. As long as it continues to decline at a similar pace, I believe this points to a potential spike in bank strains around the early fall of this year, as excess liquidity should dry up around then. Interest rate cuts could slow this issue, but rate cuts are looking less likely given the rebound in services inflation.
Realistically, SLV is far better than silver bullion outside the unlikely event of needing physical metal for an emergency. Legally speaking, SLV is physically backed in vaulted assets. It is highly liquid and has a 50 bps expense ratio, a far lower cost than the huge premiums on bullion. SLV is also more liquid than most alternative silver ETFs or CEFs, though the bulk of my analysis holds for those such as PSLV. PSLV differs from SLV in that it is easier to acquire bullion from PSLV and SLV; however, doing so remains unreasonable for most investors.
I was bullish on SLV in December and am more bullish on it today. Since then, my view that inflation would rebound is starting to appear confirmed. We're currently in a period where the data points to an inflation rebound; however, the market still needs to account for that, potentially creating an ideal short-term and long-term buying opportunity for SLV. Other bullish factors include potential US government and private sector debt issues and an expected increase in bank issues, which I expect to spike around mid-year.
SLV has held its $19-$23 range very well for some time. It is on the high end of that range today so that SLV could see some mean reversion soon. However, I believe it is more likely to break above the resistance level over the coming months, following the trend of both gold and Bitcoin. Of the three, I prefer silver because it has the best correlation with the US monetary base, which, to me, investors looking to preserve capital must hedge against until the US debt-to-GDP ratio falls back below 80%, which isn't happening anytime soon.