asbe
asbe
Silver had been dead in the water in 2024, with only a $2.60 per ounce range on the continuous futures contract until last week, when the price reached a new high for this year, extending the range to $3.495. Meanwhile, gold reached another record high of just above $2,200 per ounce on its continuous COMEX futures contract, with the active April contract rising to $2,203.
Silver is trading at less than half its 1980 all-time peak, lagging gold's performance. In an October 24, 2023, Seeking Alpha article on the Amplify Junior Silver Miners ETF (NYSEARCA:SILJ), I wrote:
I am bullish on silver because the price held up well during the recent correction. Geopolitical factors are trumping interest rates and currency markets. ETFMG Prime Junior Silver Miners ETF could be the product of choice in the current environment.
On October 24, 2023, the unleveraged SILJ product was at the $8.74 per share level. At $9.45 on March 18, SILJ was over 8% higher. I continue to favor this product as the odds favor rising silver prices after the current consolidation period ends.
At the most recent high, COMEX gold futures for April delivery rose to $2,203 per ounce. In 1980, when silver reached its record $50.36 high, gold's peak was $875 per ounce. In 2011, when silver made a slightly lower $49.82 high, gold reached $1,920.70.
Silver may be gold's little bother, but it has underperformed its sibling over the past years.
Quarterly Silver-Gold Ratio Chart (CQG)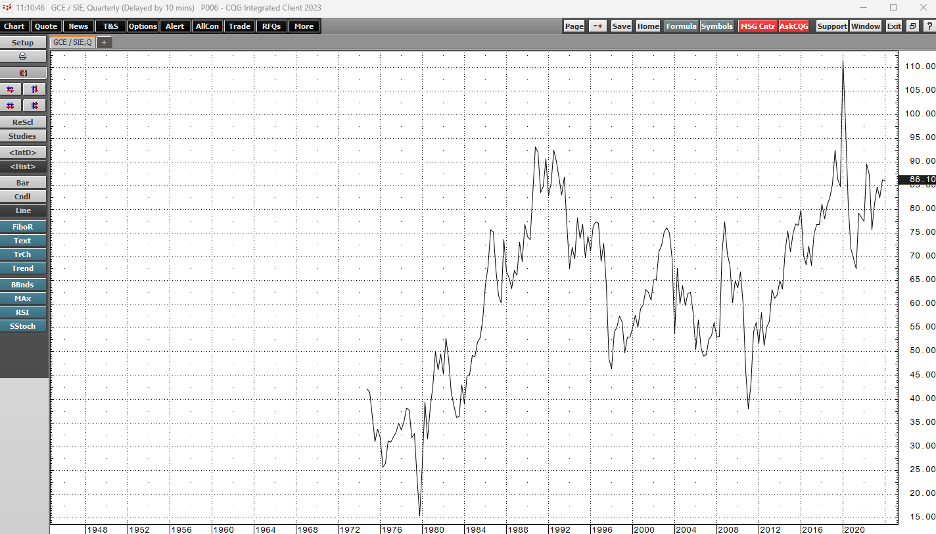
The quarterly chart of the COMEX gold divided by the COME silver futures continuous futures contracts highlights the silver-gold ratio, or the number of ounces of silver value in each ounce of gold value, which reached a 15.47 low in late 1979 and a 111.42 high in early 2020. At around 86 ounces of silver in each ounce of gold value in mid-March 2022, the ratio is above the midpoint of the 1979 low and 2020 high.
While silver has not followed gold, the odds favor a sudden and violent updraft as the silver market offers speculators and investors value at around half the price of the 1980 record high.
After reaching $49.52 per ounce in 2011, silver futures made lower highs and lower lows. Silver spiked lower when the 2020 global pandemic gripped markets across all asset classes, experiencing a blow-off low.
Twenty-Year COMEX Silver Futures Chart (Barchart)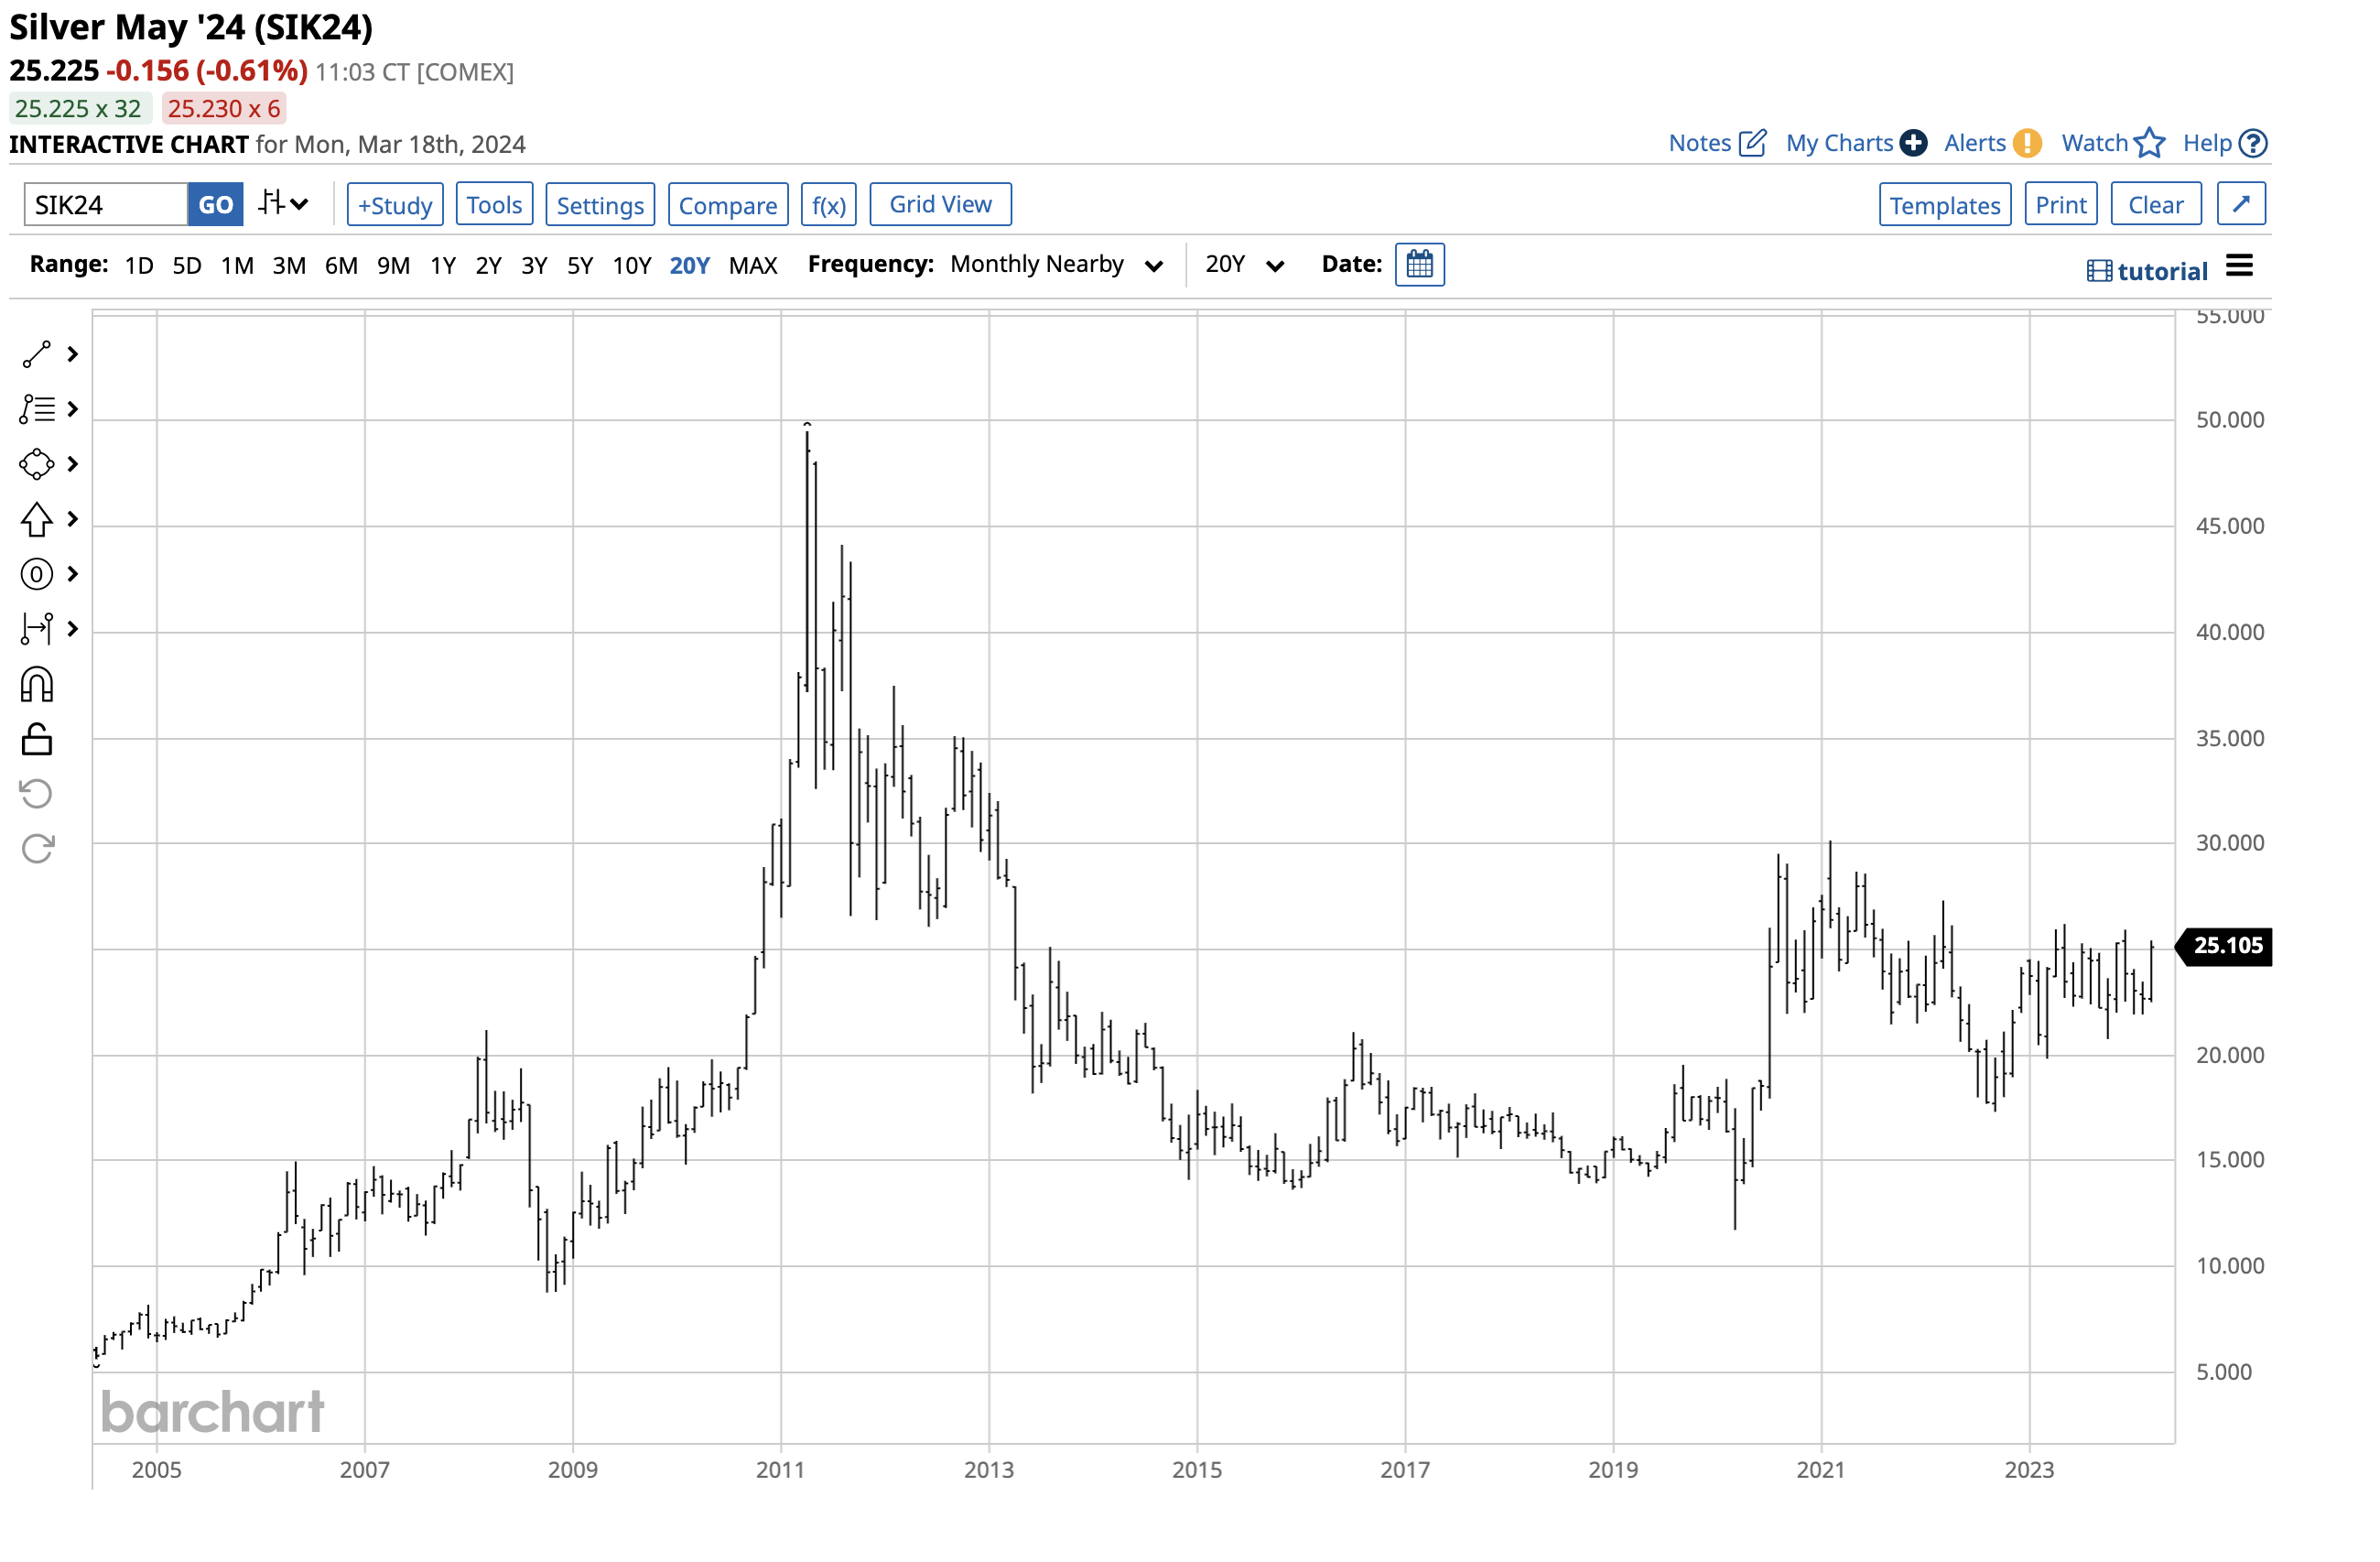
As the chart highlights, silver fell to a $11.735 low in March 2020. Less than one year later, in February 2021, it rallied 157% to a $30.16 high. The February 2021 high is the current upside technical target for the silver futures market.
The ten-year silver chart highlights the primarily bearish trend in silver.
Ten-Year COMEX Silver Futures Chart (Barchart)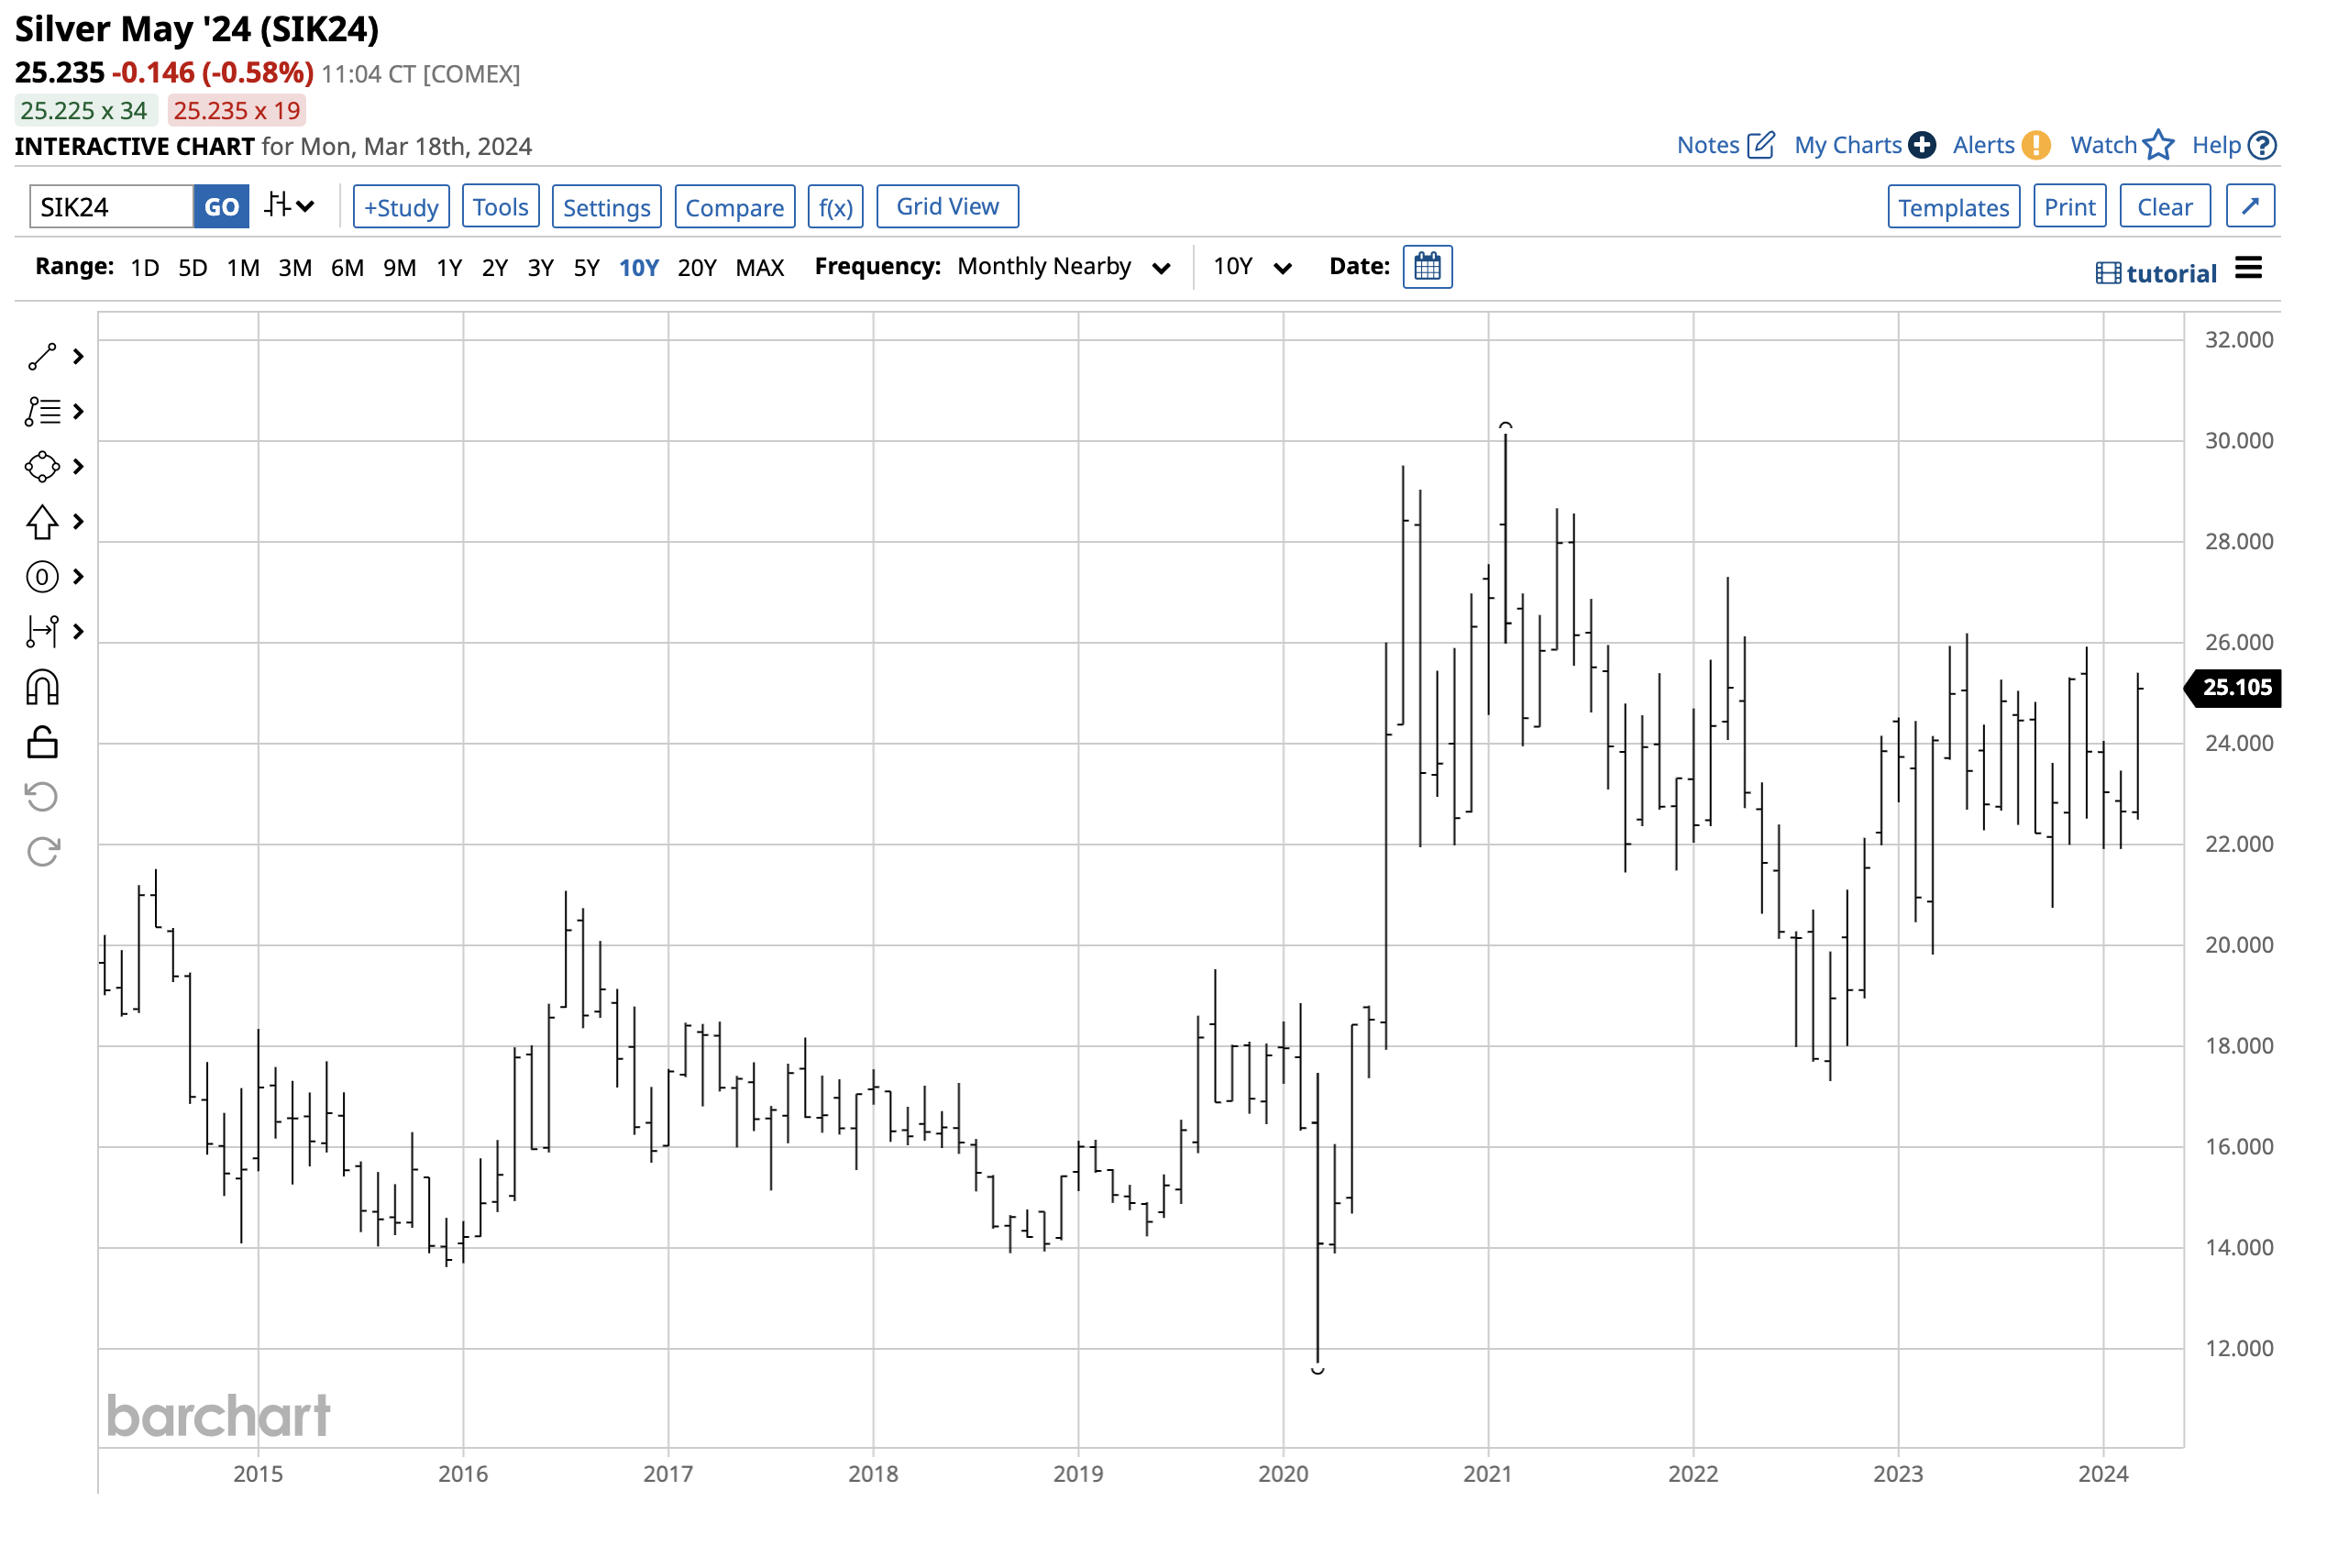
The chart illustrates silver's downward bias since the early 2021 high. However, the price traded sideways in 2023, with a $6.37 range. In 2024, the current $3.4950 trading band is a continuation of the price consolidation.
Silver's continuous contract low in January and February was at the $21.925 per ounce level, which could be a double bottom, a very bullish technical formation. When a stretched rubber band snaps, the price move can be dramatic.
At the $9.45 per share level, the Amplify Junior Silver Miners ETF had around $688 million in assets under management. SILJ trades an average of over 1.59 million shares daily and charges a 0.69% management fee.
SILJ's fund profile states:
SILJ Fund Profile (Seeking Alpha)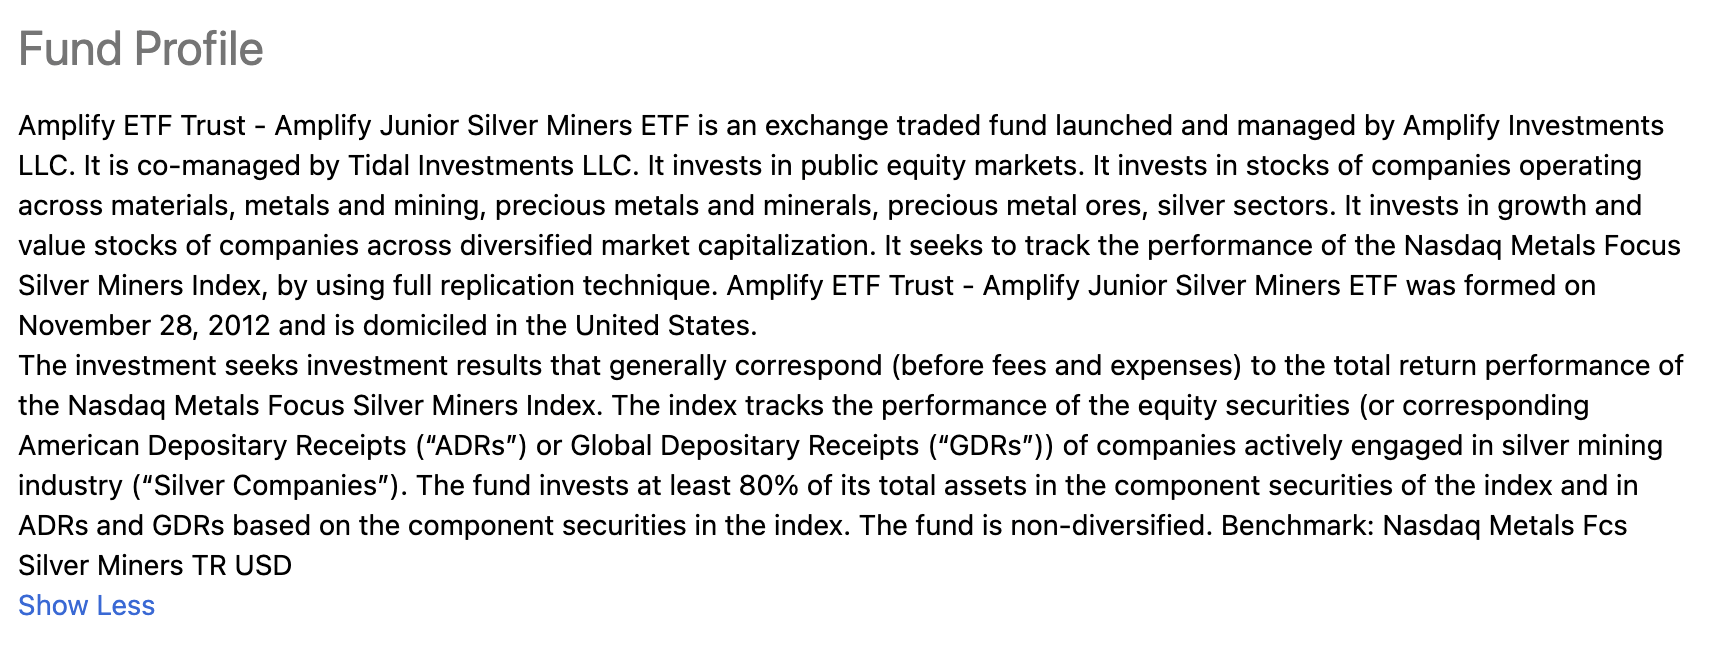
SILJ's top holdings include:
Top Holdings of the SILJ ETF Product (Seeking Alpha)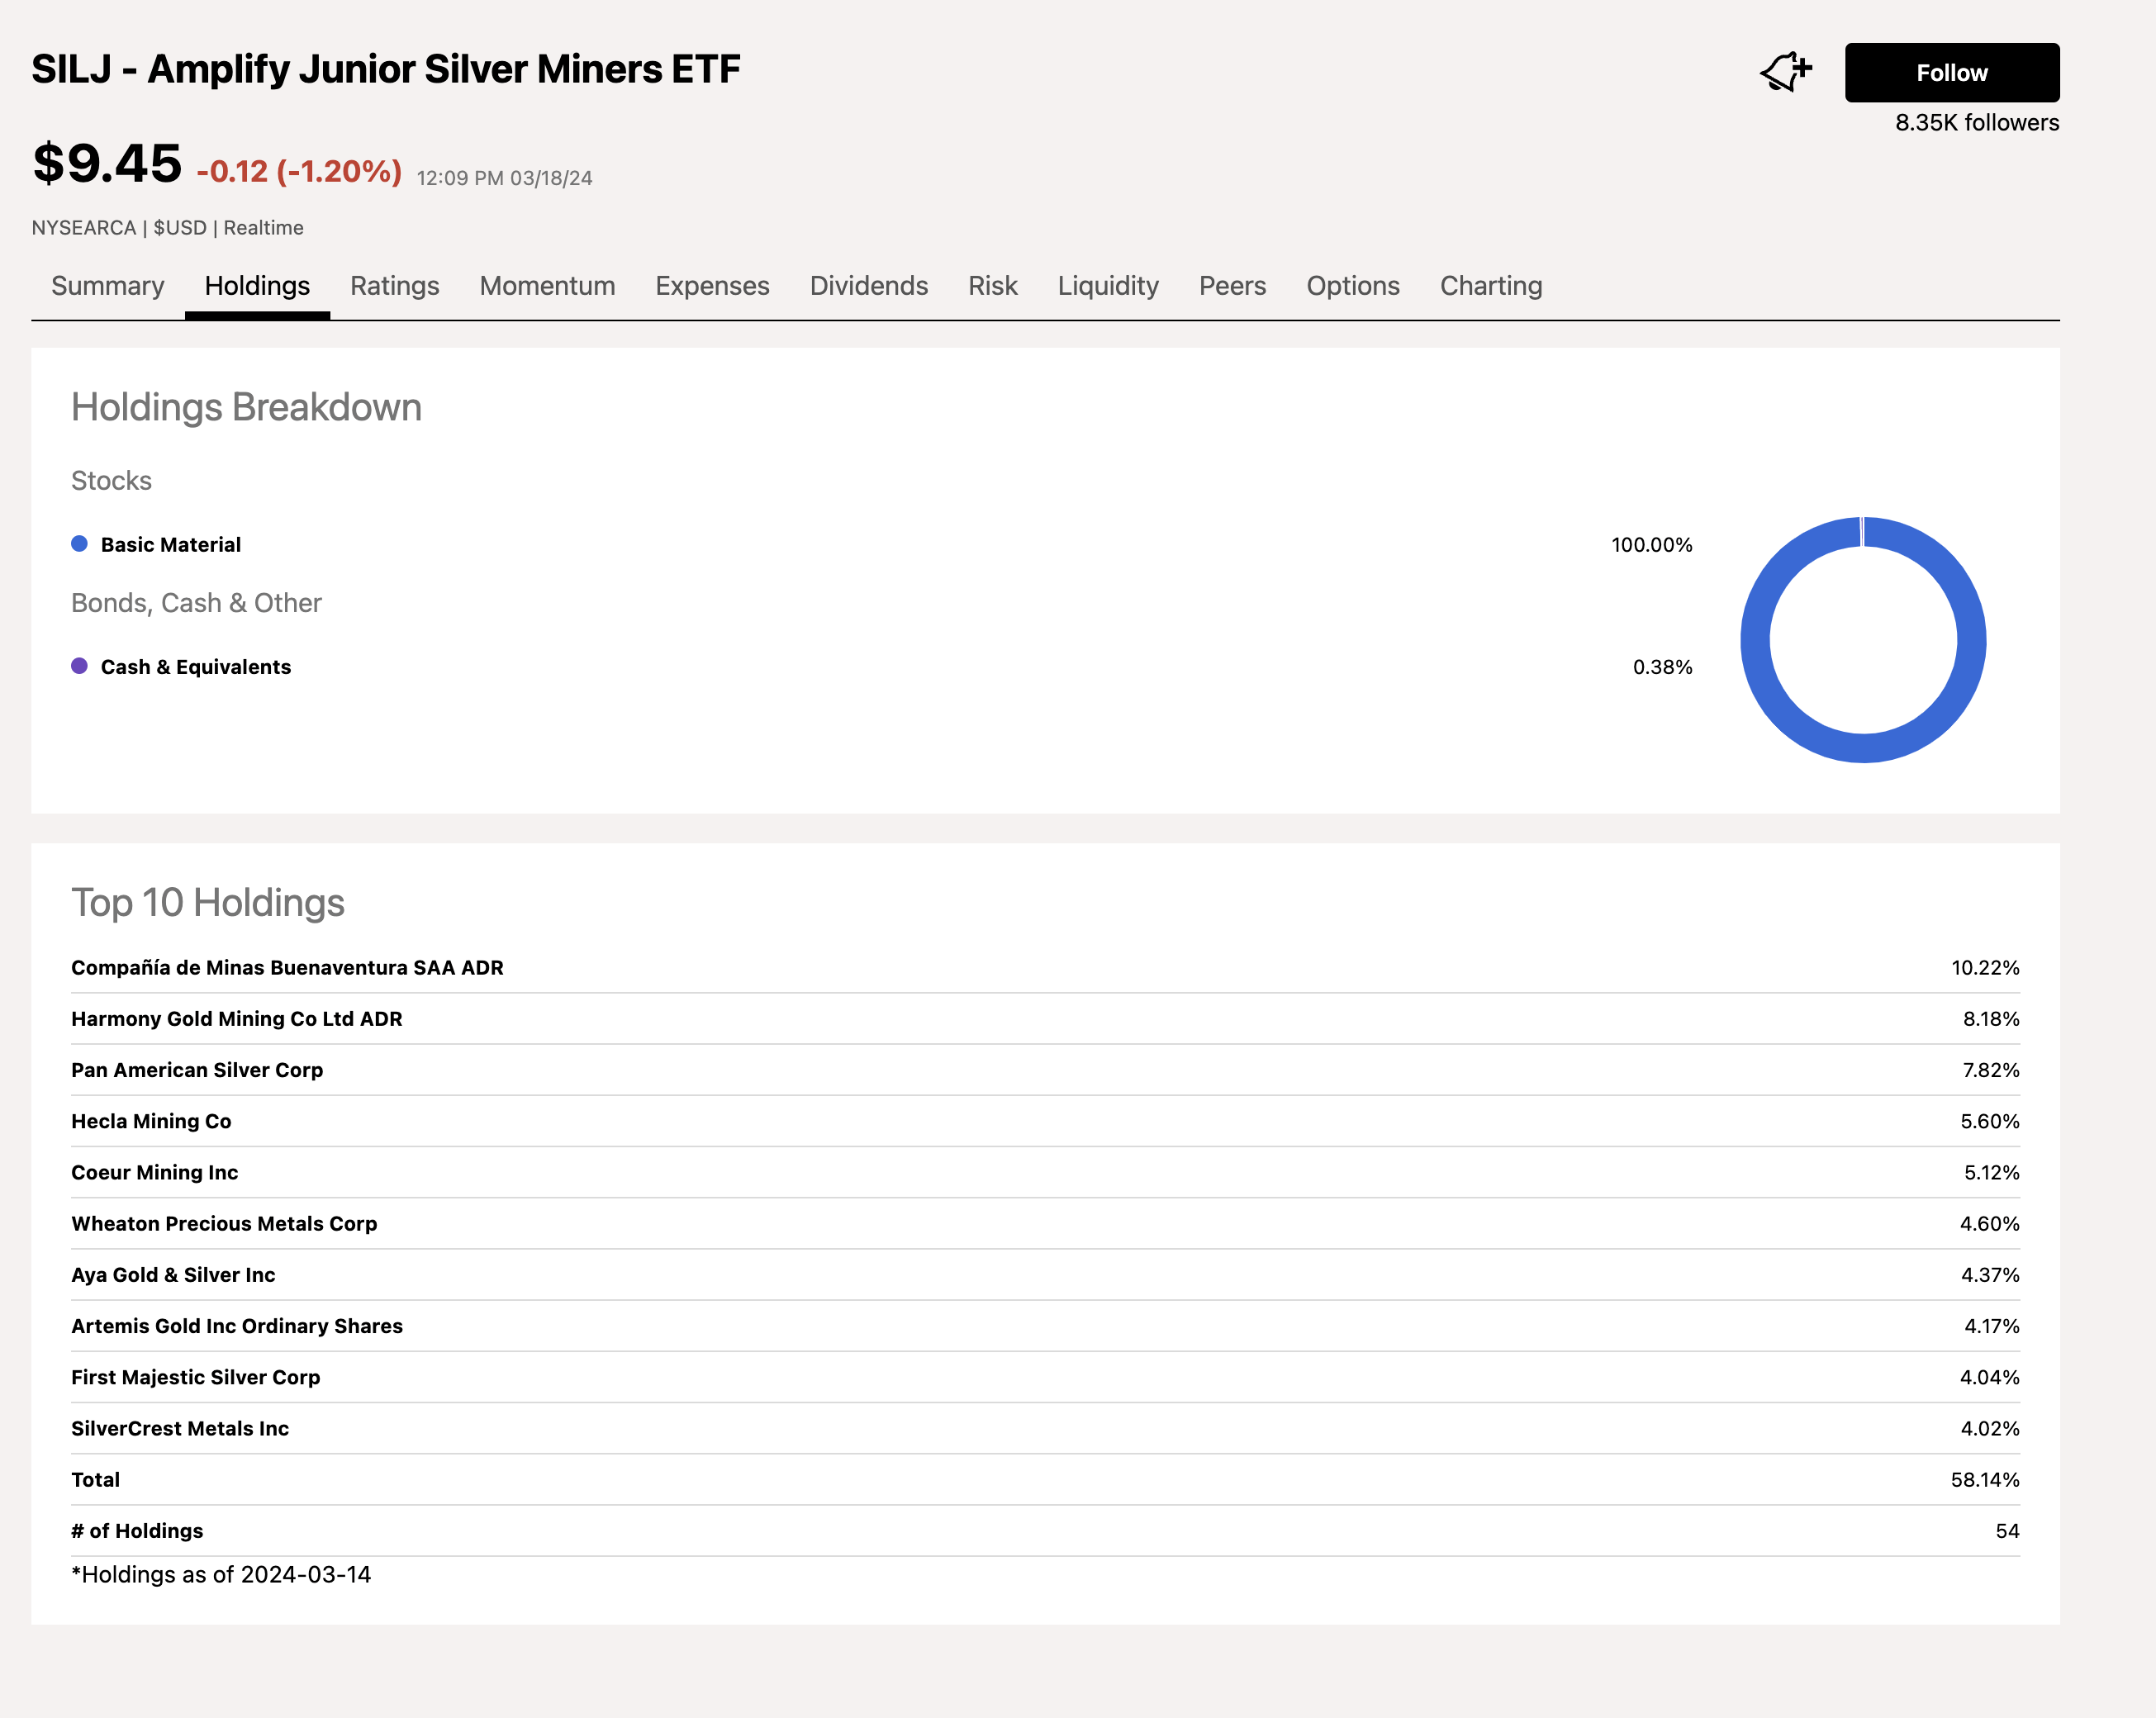
SILJ is an unleveraged ETF with a leveraged twist. Junior silver miners that explore for silver reserves and extract the metal from the earth's crust, a leveraged business. Miners invest significant capital in holes in the ground and potential mines, hoping to achieve substantial gains.
American author Samuel Clemens, aka Mark Twain, once said, "The definition of a mine is a hole in the ground with a liar standing next to it." During the U.S. gold rush, many speculative mining ventures went belly up, with investors losing their shirts. Samuel Clemens had first-hand knowledge of the precious metals mining business, as he moved to the Western U.S. in the mid-nineteenth century in a failed attempt at mining.
Today's mining companies are more sophisticated as technological advances have improved the odds of locating proven and probable reserves. However, the business remains highly speculative on two fronts. First, finding the silver or gold in the earth's crust is not guaranteed. Second, metals prices must be at levels where the extraction costs are less than the current market prices to make the business economic.
Meanwhile, a bull market tends to cause mining shares to outperform the underlying commodity prices because of mining's implied leverage. The rush to buy silver after the 2020 spike low, which took the price 157% higher, is an example of how mining shares can experience explosive rallies.
Five-Year Chart of the SILJ ETF Product (Barchart)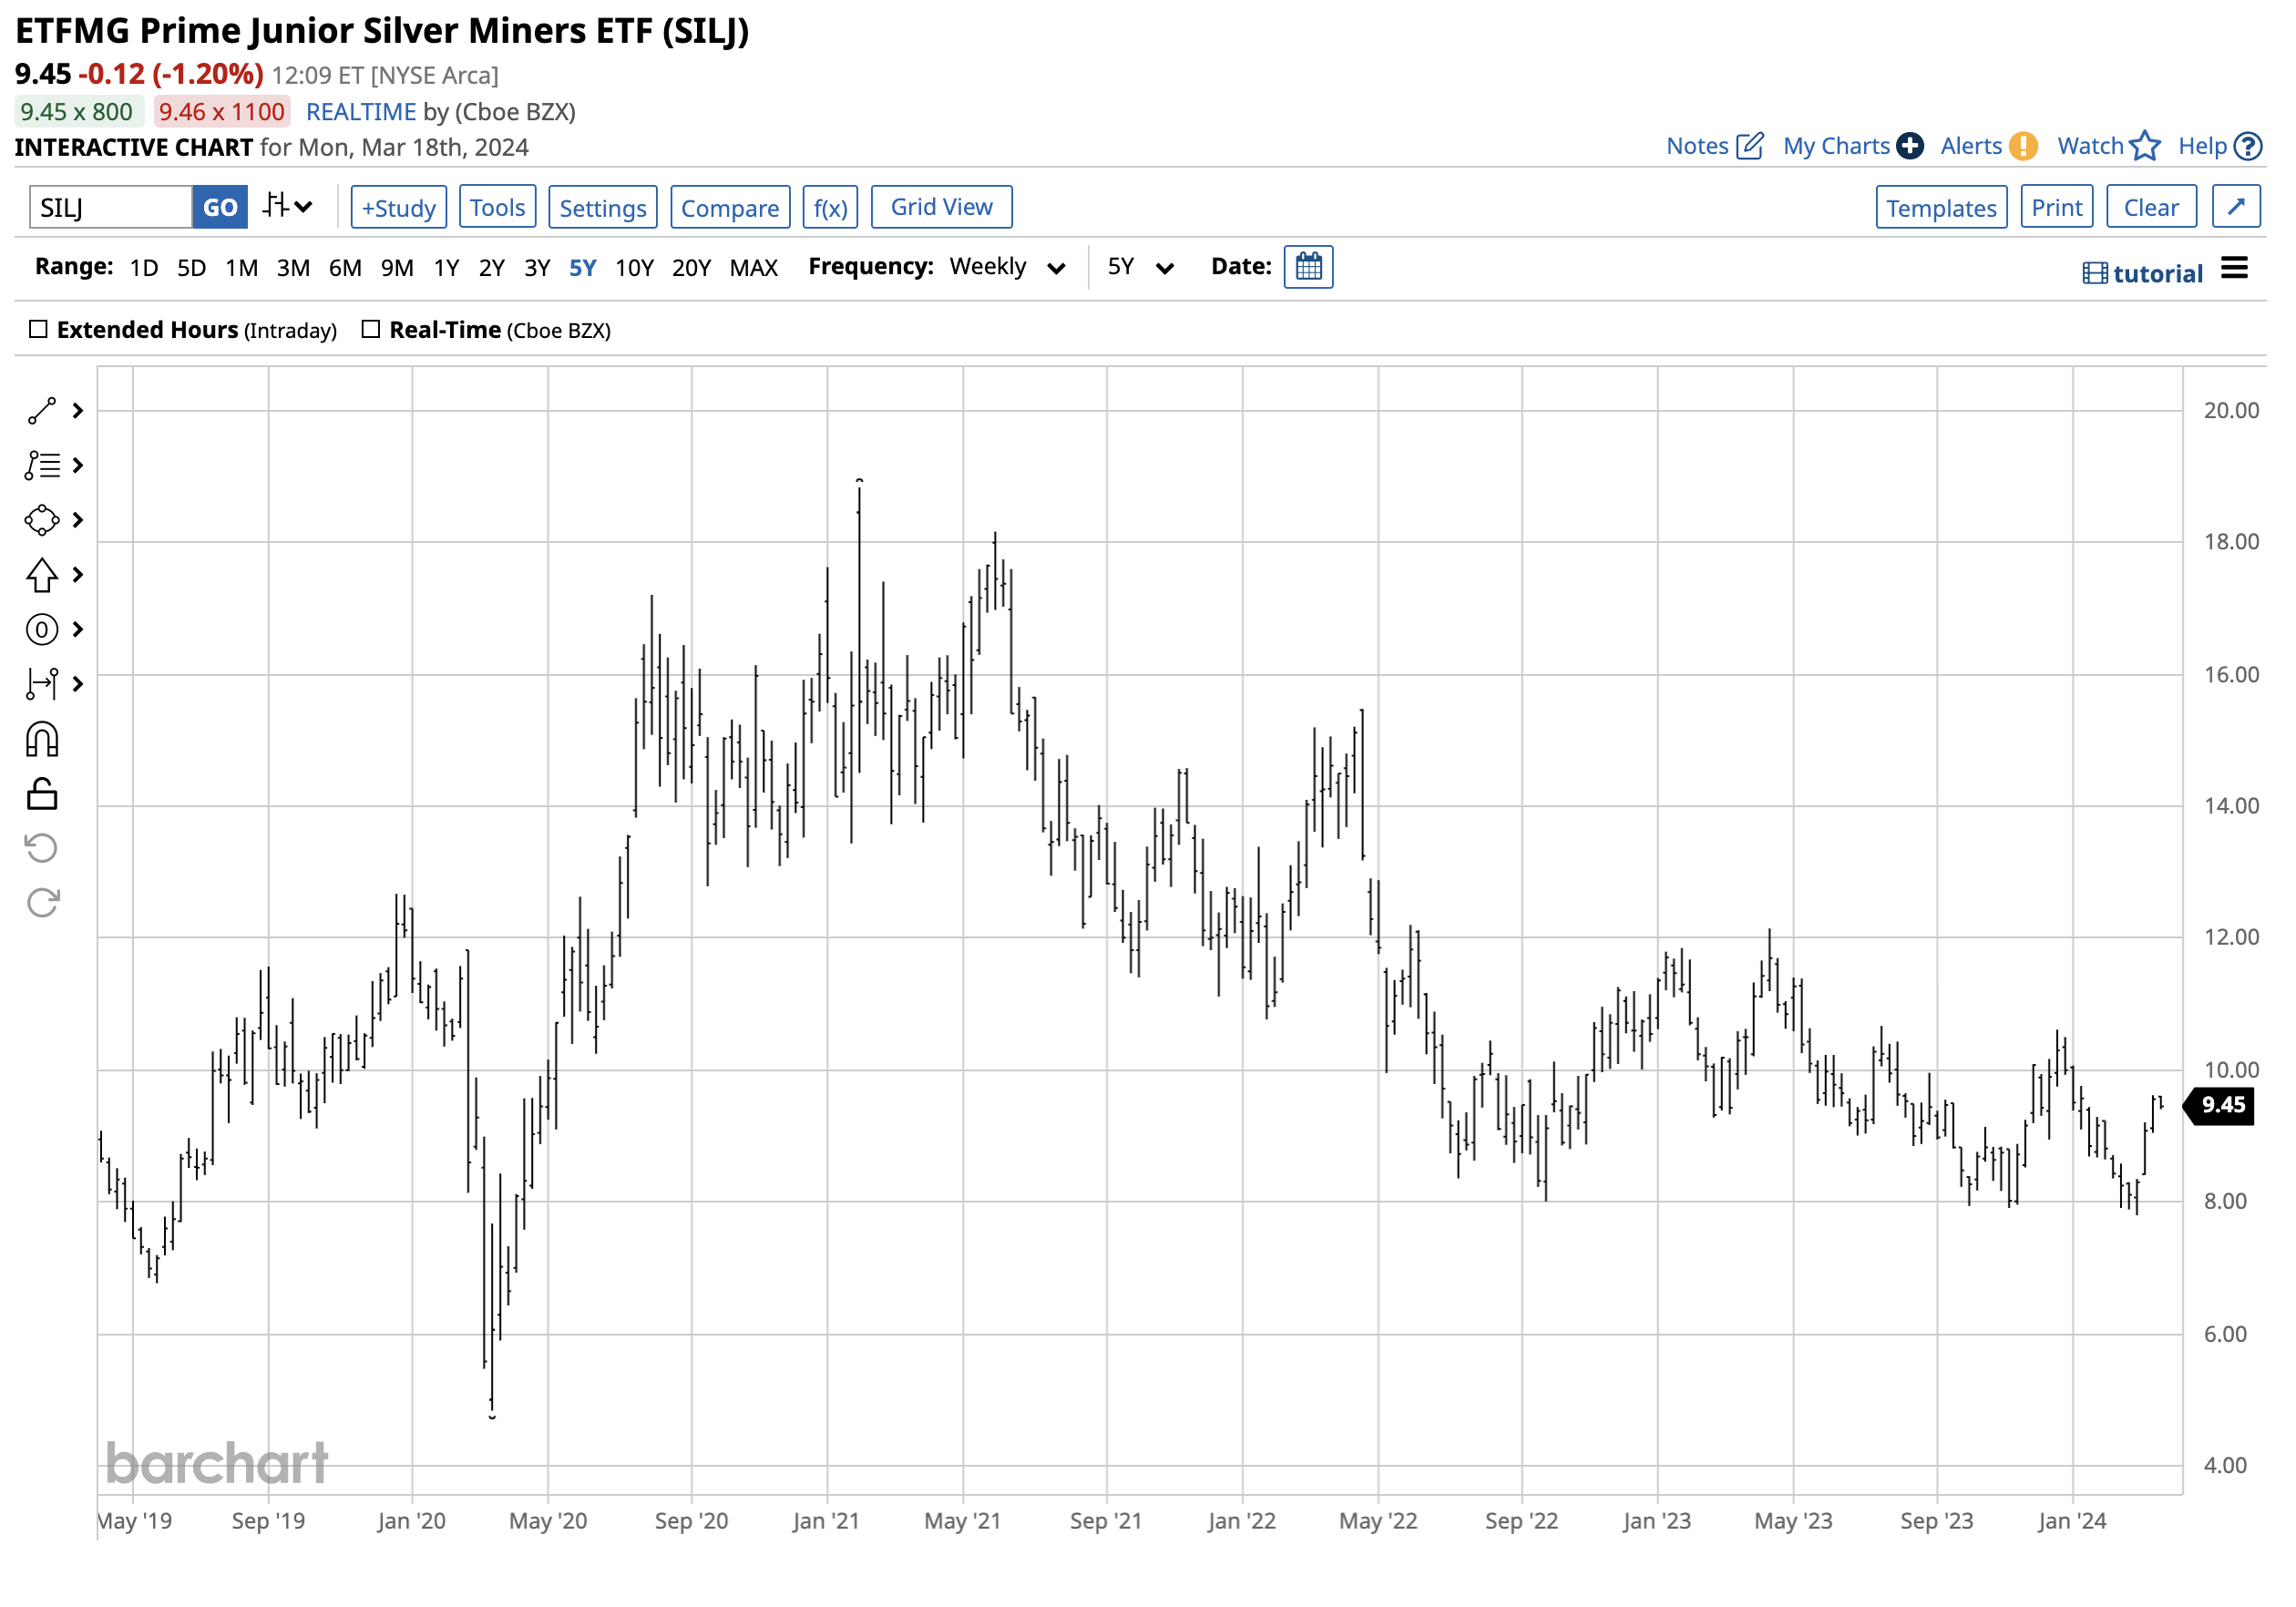
The chart shows that SILJ rallied 289.3% from $4.84 to $18.84 per share when silver rallied 157% from March 2020 through February 2021.
At below $9.50 per share on March 18, another explosive silver rally could cause a herd of buyers to descend on the junior silver mining ETF product.
If gold is a guide, silver is cheap, and silver mining shares are at bargain basement prices. Gold and silver mining shares have underperformed the metals because inflation has increased production costs. However, buying in gold mining shares has increased as gold rises to new highs.
Historically, silver has been more volatile than gold for two reasons. First, its nominal price is less expensive than gold, leading to more speculative activity. Second, silver rallies to either side of $50 per ounce in 1980 and 2011 caused many market participants to hop on trends when they develop. A bull market always attracts more interest than a bear market trend.
Quarterly Gold Futures Chart with Historical Volatility (CQG)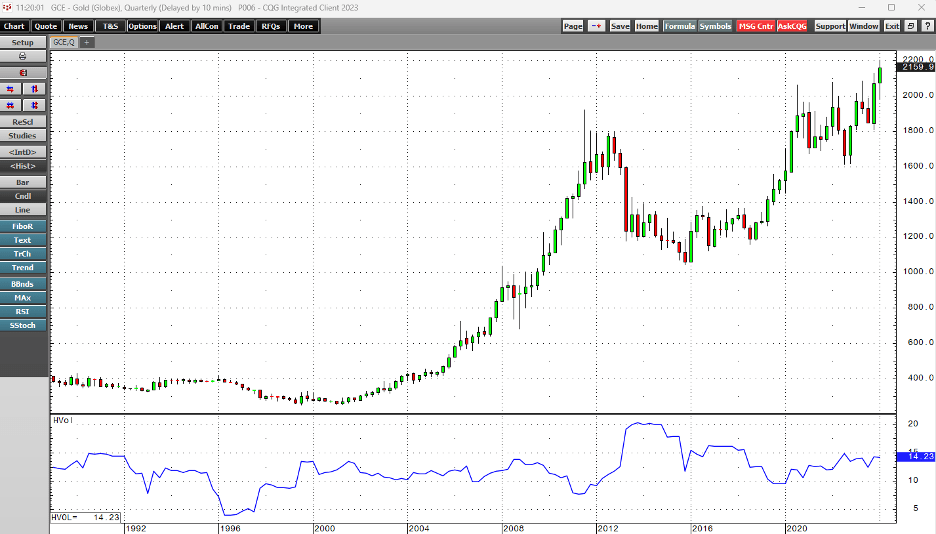
The chart shows gold's quarterly historical volatility is at 14.23%. The high was just over 20% in 2013.
Quarterly Silver Futures Chart with Historical Volatility (CQG)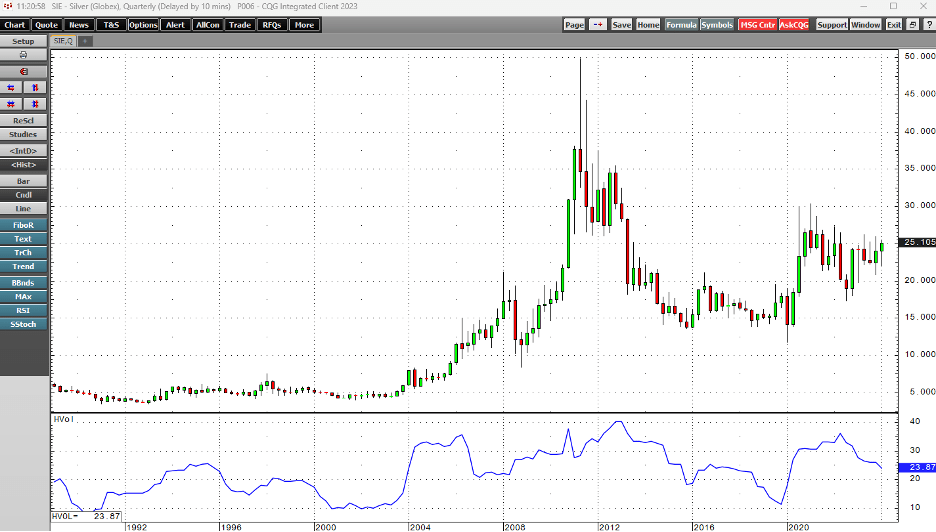
Meanwhile, silver's quarterly price variance, at 23.9%, is nearly double gold's historical volatility level. Silver volatility reached over 40% in 2013. In 1981, silver's historical volatility eclipsed the 100% level, while gold's peak was 42.4%.
The bottom line is silver could surprise and even shock on the upside when the price breaches the technical resistance level.
Twenty-Year Silver Futures Chart (Barchart)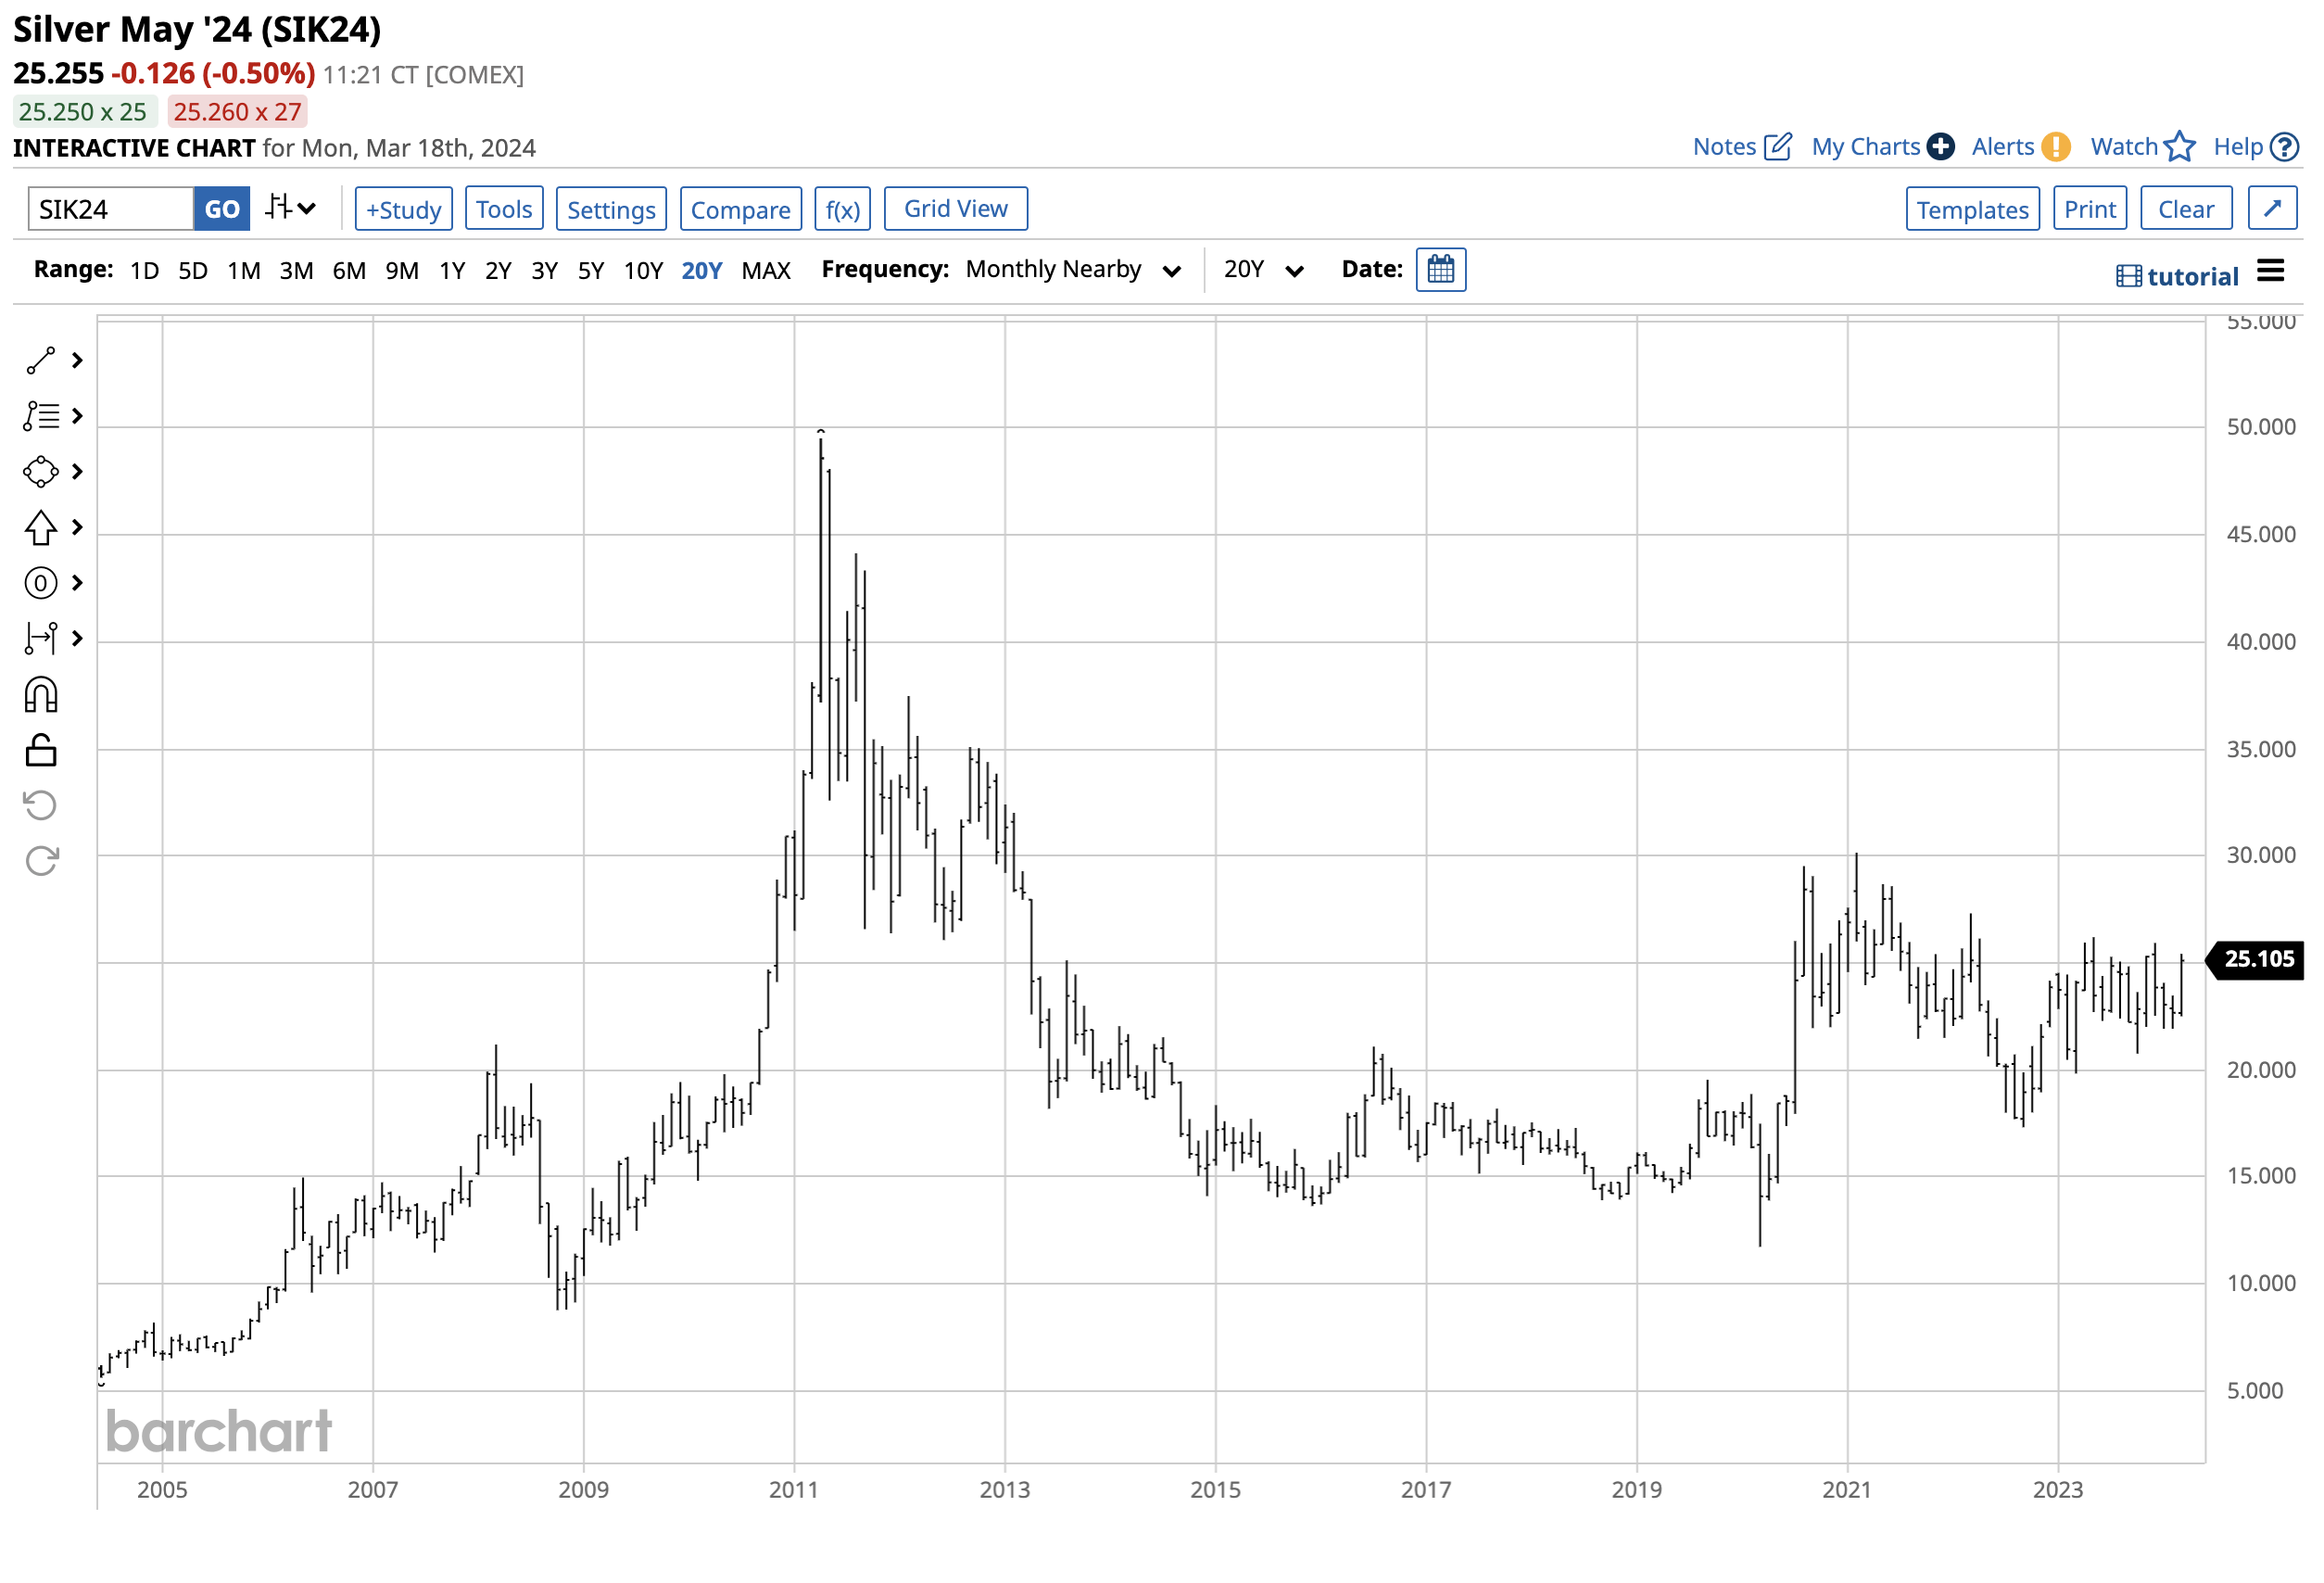
As the chart highlights, silver is approaching a level at the December 2023 $25.935 high that will end the pattern of lower highs since 2011. However, a break above the February 2021 $30.16 high is likely necessary to fuel the speculative fervor that could propel silver toward a challenge of the $50 level.
Twenty-Year Chart of the SILJ ETF Product (Barchart)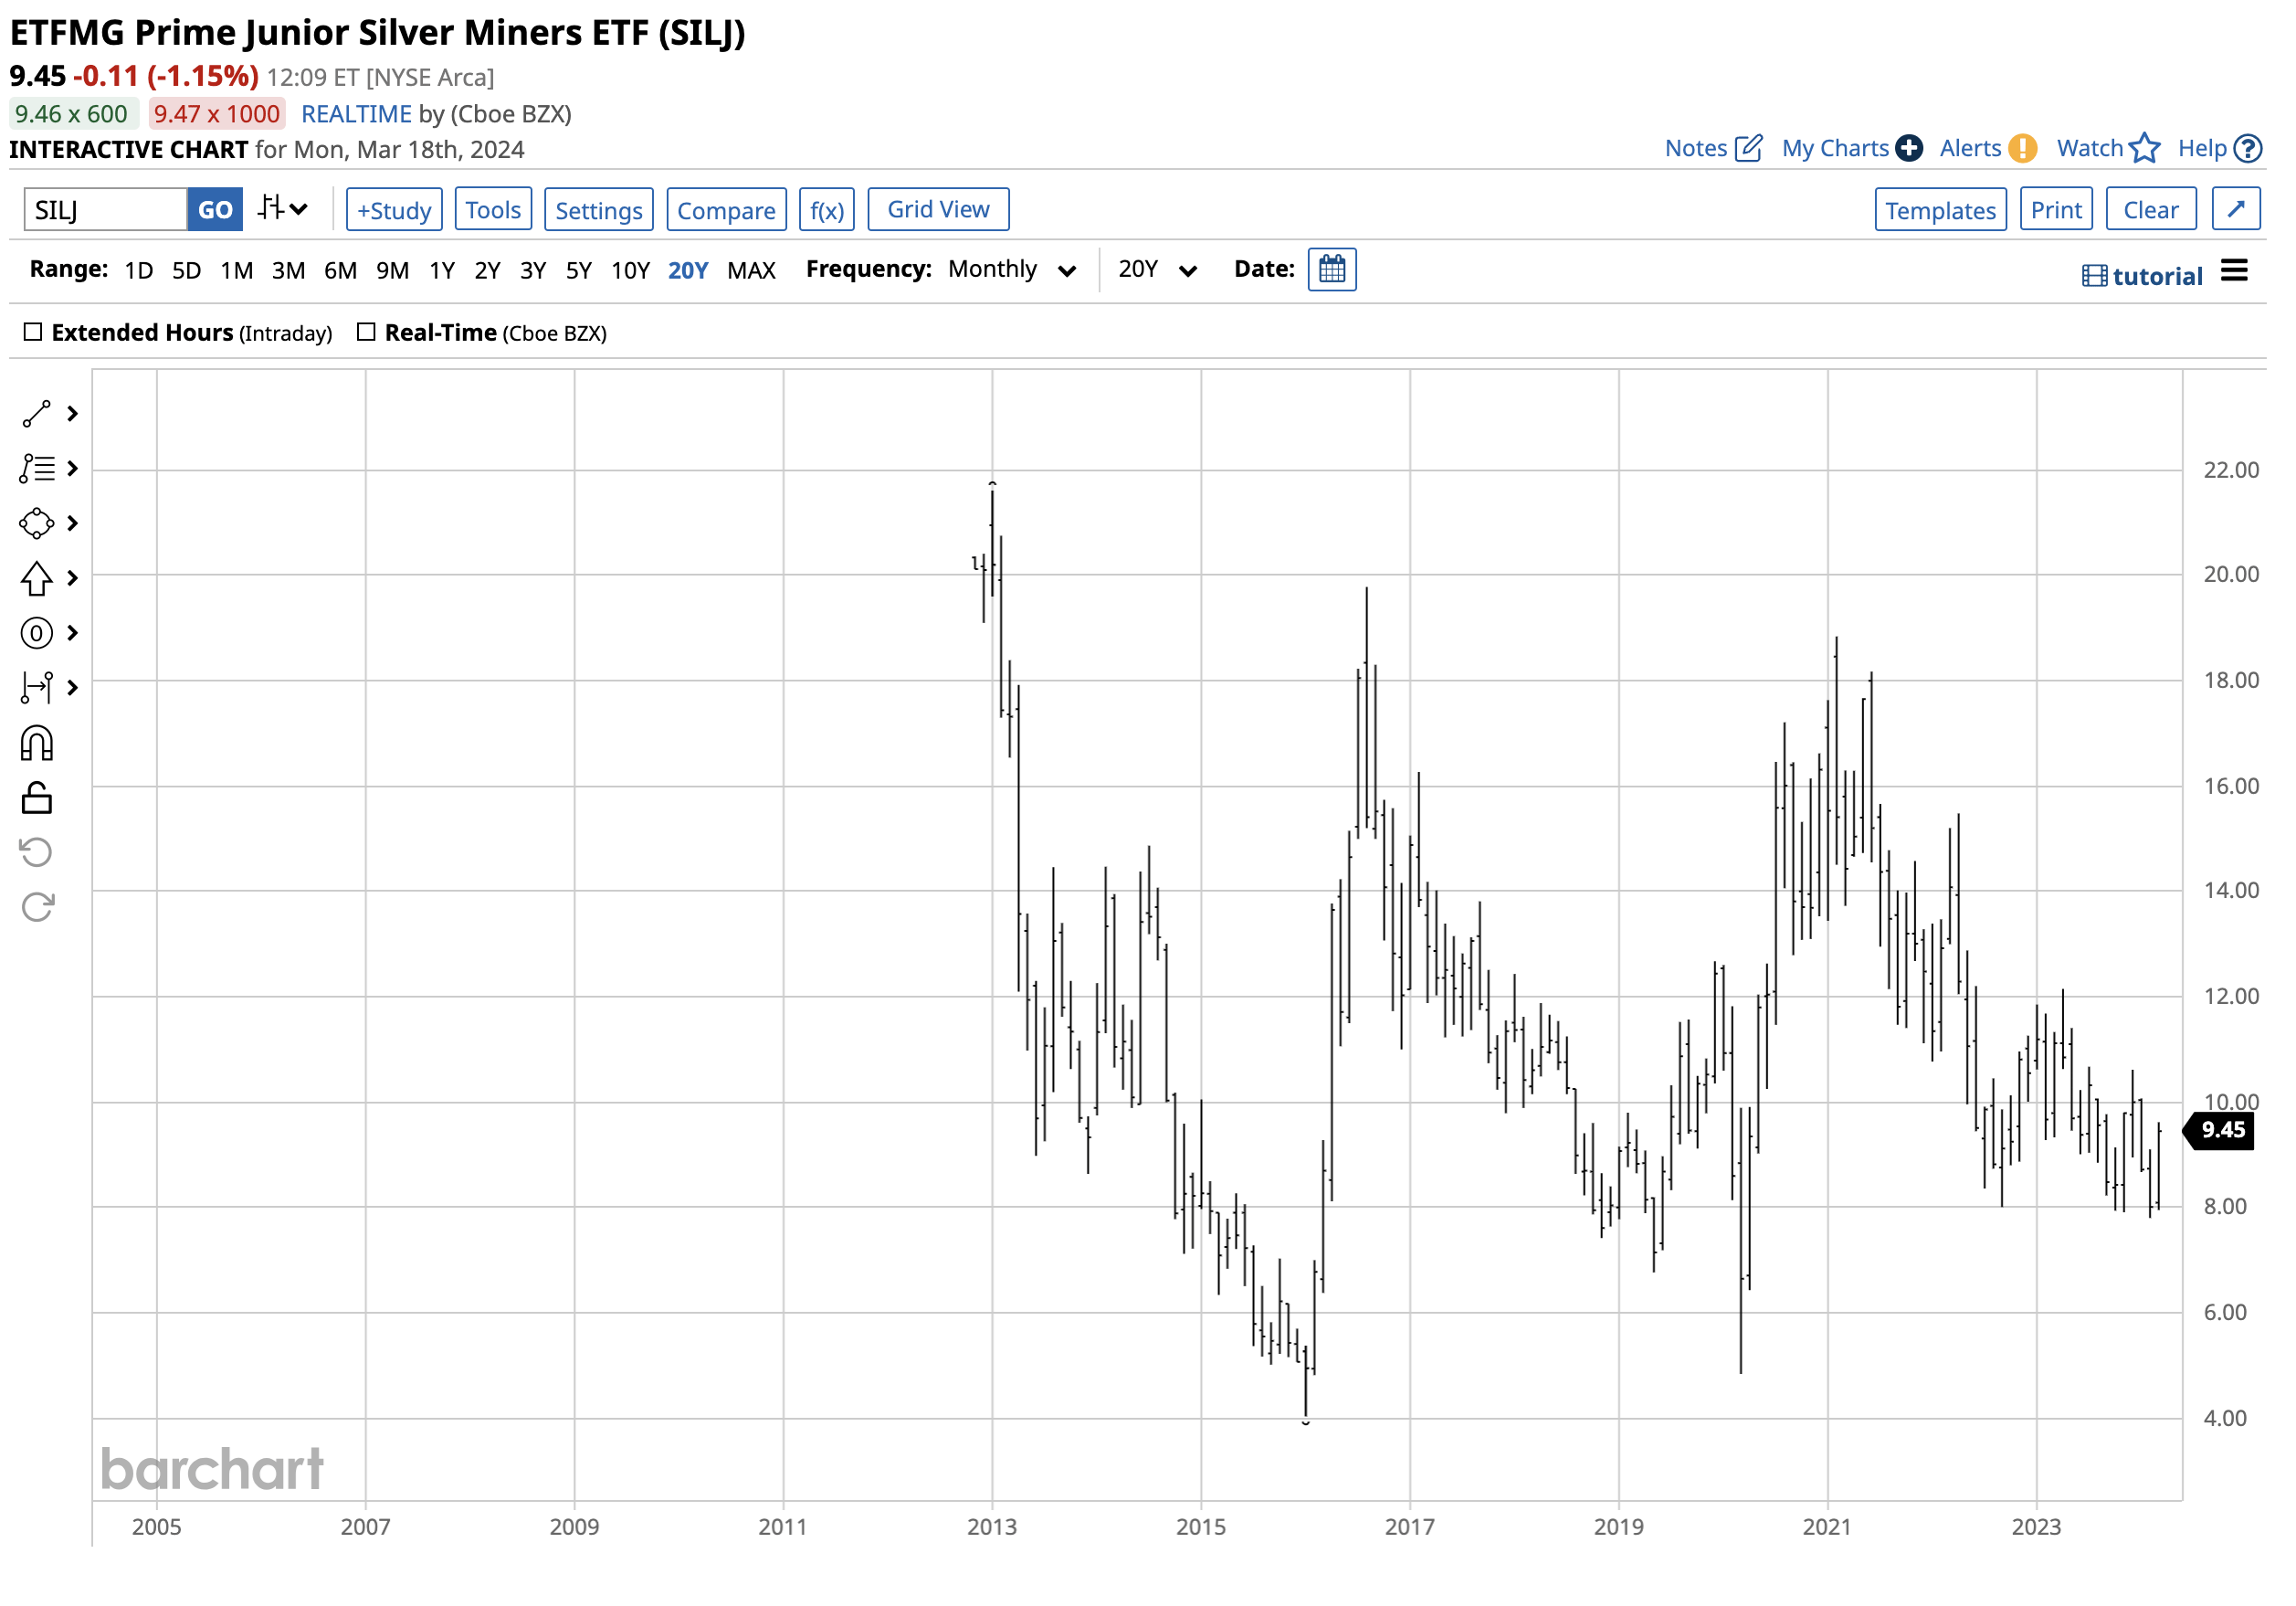
SILJ has only been around since 2012, but the chart resembles the silver futures trading pattern. The first technical resistance level is at the December 2023 $10.62 high, with critical resistance at the February 2021 $18.84 peak.
I expect silver to challenge these upside targets over the coming months. Moreover, silver could experience a shock-and-awe rally that takes the price above the 1980 high into uncharted territory.
Central banks and governments continue to validate gold's role in the worldwide financial system, but if gold is the currency bill, silver remains the change in pockets. As fiat currency values decline, gold and silver are the world's oldest means of exchange. Expect silver to catch up with gold as it is at half the level of the 1980 and 2011 highs; gold is at record levels. Silver and SILJ are inexpensive and offer value at the current price levels.