
designer491
designer491
Earnings of Simmons First National Corporation (NASDAQ:SFNC) will likely remain flattish in upcoming quarters. The addition of new branches and a robust labor market will likely lift loans and consequently earnings. On the other hand, a lower average margin and higher operating expenses will restrict earnings growth. Overall, I’m expecting the company to report earnings of $1.55 per share for 2023 and $1.52 per share for 2024. Next year’s target price suggests a high price upside from the current market price. Further, the company is offering a high dividend yield. As a result, I’m maintaining a buy rating on Simmons First National Corporation.
Although the loan portfolio size declined in the third quarter, the growth for the first nine months is in line with my expectations. I’m expecting moderate loan growth in upcoming quarters, partly due to management’s network expansion efforts. According to recent press releases, the company has added a branch in Dallas, TX, and a branch in St Louis, MO since the start of the fourth quarter. Further, the company plans to add a branch in Jonesboro, AR in 2024. Simmons currently operates through 232 branches, which means that the company averages $96 million worth of deposits and $72 million worth of loans per branch. As a result, the addition of every new branch is material. It could lead to a balance sheet growth of approximately 40 basis points.
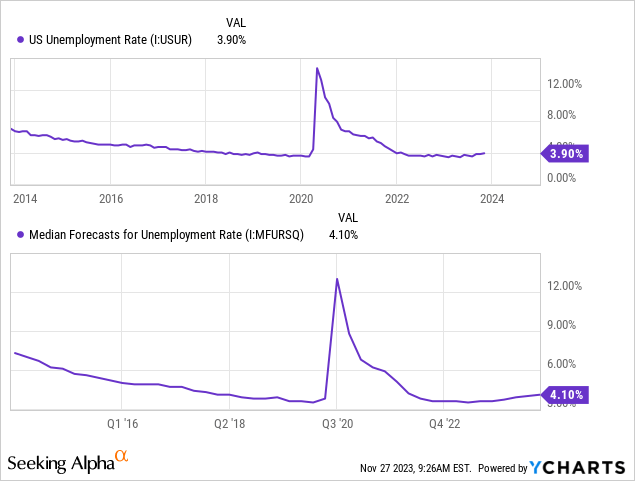
The labor market is also currently somewhat favorably positioned, which indicates good economic activity and consequently credit demand. Simmons First National operates in Arkansas, Kansas, Missouri, Oklahoma, Tennessee, and Texas. As the company's markets are quite diverse, I think the national average is a good proxy for the different markets. As shown below, the unemployment rate continues to remain at a very low level. Further, it’s expected to crawl upward next year but still remain below the rate before 2018.
Considering these factors, I’m expecting the loan portfolio to grow by around 1.0% every quarter till the end of 2024. The following table shows my balance sheet estimates.
| Financial Position | FY19 | FY20 | FY21 | FY22 | FY23E | FY24E |
| Net Loans | 14,357 | 12,663 | 11,807 | 15,946 | 16,719 | 17,398 |
| Growth of Net Loans | 23.1% | (11.8)% | (6.8)% | 35.1% | 4.8% | 4.1% |
| Other Earning Assets | 4,537 | 7,200 | 10,123 | 8,098 | 7,574 | 7,727 |
| Deposits | 19,850 | 16,987 | 19,367 | 22,548 | 22,454 | 23,365 |
| Borrowings and Sub-Debt | 1,836 | 2,024 | 1,908 | 1,386 | 1,797 | 1,834 |
| Common equity | 2,988 | 2,976 | 3,249 | 3,269 | 3,305 | 3,247 |
| Book Value Per Share ($) | 30.2 | 27.0 | 28.4 | 26.3 | 26.2 | 25.7 |
| Tangible BVPS ($) | 18.3 | 16.2 | 17.4 | 14.6 | 14.8 | 14.3 |
| Source: SEC Filings, Earnings Releases, Author's Estimates(In USD million unless otherwise specified) | ||||||
Variable-rate loans make up a sizable 44% of the total loan portfolio, as mentioned in the third quarter’s earnings presentation. Further, variable-rate deposits, including interest-bearing transaction accounts and savings deposits, make up 48% of total deposits. As a result of the combination of the variable-rate assets and liabilities, the margin is barely affected by interest rate changes. The results of management’s rate-sensitivity analysis, given below, show this relationship.
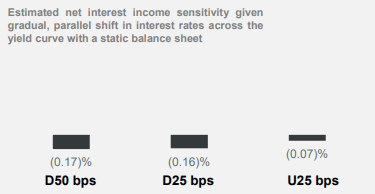
Earnings Presentation 3Q 2023
Considering this rate sensitivity, the margin should’ve been range-bound this year as interest rates rose. However, the net interest margin has actually slipped significantly. The margin dipped by 22 basis points in the first, 33 basis points in the second, and 15 basis points in the third quarter of the year. The major reason is that the deposit mix significantly worsened this year, as shown below.
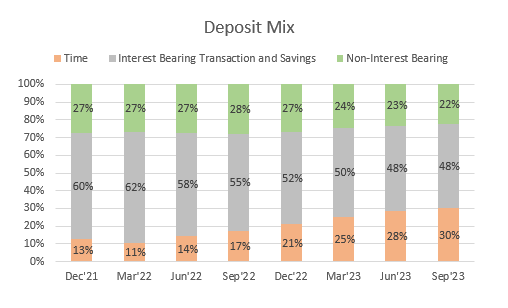
SEC Filings
Further, costly borrowings increased by 29% in the first nine months of the year. Borrowings on average carried a rate of 3.8% during the first nine months, while interest-bearing deposits carried a rate of 2.59% in the first nine months of 2023, according to details given in the 10-Q filing.
I’m expecting deposit migration to end soon because interest rates are unlikely to change much in the next six to nine months. Rate hikes had previously been encouraging depositors to shift their funds away from non-interest-bearing and low-interest-bearing accounts. Further, the addition of new loans at high rates will lift the margin.
Overall, I’m expecting the margin to remain unchanged in the last quarter of 2023, and then increase by two basis points each quarter next year. As next year’s upturn will likely not be as steep as the downturn this year, the average margin for next year will most probably be lower than the average margin for 2023. I’m estimating the average margin for 2024 to be 11 basis points below the average for 2023.
Compared to my last report, which was issued before the first quarter’s results, I’ve slashed my margin estimate for 2023 because the margin has performed much worse than I anticipated.
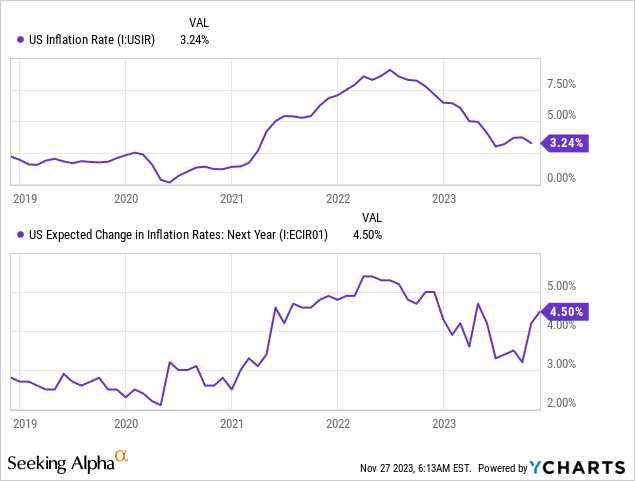
Despite the disinflation that started last year, inflation is likely to remain moderate through the end of next year. As a result, I’m expecting operating expenses to trend upward next year. Further, the addition of new branches will contribute to operating expenses.
The anticipated loan growth will likely counter the effect of a lower average net interest margin and higher operating expenses next year. Considering these factors, I’m expecting Simmons First National to report earnings of $1.55 per share for 2023 and $1.52 per share for 2024. The following table shows my income statement estimates.
| Income Statement | FY19 | FY20 | FY21 | FY22 | FY23E | FY24E |
| Net interest income | 602 | 640 | 592 | 717 | 647 | 632 |
| Provision for loan losses | 43 | 75 | (33) | 14 | 40 | 32 |
| Non-interest income | 198 | 240 | 192 | 170 | 177 | 185 |
| Non-interest expense | 454 | 485 | 484 | 567 | 548 | 556 |
| Net income - Common Sh. | 238 | 255 | 271 | 256 | 196 | 192 |
| EPS - Diluted ($) | 2.41 | 2.31 | 2.46 | 2.06 | 1.55 | 1.52 |
| Source: SEC Filings, Earnings Releases, Author's Estimates(In USD million unless otherwise specified) | ||||||
I last covered Simmons before the release of the first quarter’s results. At that time, I estimated earnings of $2.12 per share for 2023. I’ve slashed my earnings estimate for the year because the margin has already performed much worse than I anticipated.
Due to loan and deposit books that are quite geographically diverse, I believe Simmons’ risk level is comfortable. Moreover, the following two factors make the risk level somewhat low.
Simmons First National is offering an attractive dividend yield of 5.0% at the current quarterly dividend rate of $0.20 per share. The earnings and dividend estimates suggest a payout ratio of 53% for 2024, which is much higher than the last five-year average of 30%. Nevertheless, I’m not worried about a dividend cut because maintaining a 53% dividend payout is easily achievable. Moreover, the company’s capital level is more than adequate, so there will be no pressure on the company to cut dividends in order to meet regulatory requirements. The company reported a total capital ratio of 14.27% for the end of September 2023, which is much higher than the minimum regulatory requirement of 10.0%.
I’m using the historical price-to-tangible book (“P/TB”) and price-to-earnings (“P/E”) multiples to value Simmons First National Corporation. The stock has traded at an average P/TB ratio of 1.47 in the past, as shown below.
| FY19 | FY20 | FY21 | FY22 | Average | ||
| T. Book Value per Share ($) | 18.3 | 16.2 | 17.4 | 14.6 | ||
| Average Market Price ($) | 24.9 | 18.9 | 29.2 | 24.7 | ||
| Historical P/TB | 1.36x | 1.16x | 1.67x | 1.69x | 1.47x | |
| Source: Company Financials, Yahoo Finance, Author's Estimates | ||||||
Multiplying the average P/TB multiple with the forecast tangible book value per share of $14.30 gives a target price of $21.10 for the end of 2024. This price target implies a 30.5% upside from the November 24 closing price. The following table shows the sensitivity of the target price to the P/TB ratio.
| P/TB Multiple | 1.27x | 1.37x | 1.47x | 1.57x | 1.67x |
| TBVPS - Dec 2024 ($) | 14.3 | 14.3 | 14.3 | 14.3 | 14.3 |
| Target Price ($) | 18.2 | 19.7 | 21.1 | 22.5 | 24.0 |
| Market Price ($) | 16.2 | 16.2 | 16.2 | 16.2 | 16.2 |
| Upside/(Downside) | 12.8% | 21.6% | 30.5% | 39.4% | 48.2% |
| Source: Author's Estimates |
The stock has traded at an average P/E ratio of around 10.6x in the past, as shown below.
| FY19 | FY20 | FY21 | FY22 | Average | ||
| Earnings per Share ($) | 2.41 | 2.31 | 2.46 | 2.06 | ||
| Average Market Price ($) | 24.9 | 18.9 | 29.2 | 24.7 | ||
| Historical P/E | 10.3x | 8.2x | 11.9x | 12.0x | 10.6x | |
| Source: Company Financials, Yahoo Finance, Author's Estimates | ||||||
Multiplying the average P/E multiple with the forecast earnings per share of $1.52 gives a target price of $16.10 for the end of 2024. This price target implies a 0.3% downside from the November 24 closing price. The following table shows the sensitivity of the target price to the P/E ratio.
| P/E Multiple | 8.6x | 9.6x | 10.6x | 11.6x | 12.6x |
| EPS 2024 ($) | 1.52 | 1.52 | 1.52 | 1.52 | 1.52 |
| Target Price ($) | 13.1 | 14.6 | 16.1 | 17.6 | 19.2 |
| Market Price ($) | 16.2 | 16.2 | 16.2 | 16.2 | 16.2 |
| Upside/(Downside) | (19.1)% | (9.7)% | (0.3)% | 9.1% | 18.5% |
Equally weighting the target prices from the two valuation methods gives a combined target price of $18.60, which implies a 15.1% upside from the current market price. Adding the forward dividend yield gives a total expected return of 20.0%. Hence, I’m maintaining a buy rating on Simmons First National Corporation.