
William_Potter
William_Potter
The ProShares Short Dow30 ETF (NYSEARCA:DOG) is a popular exchange-traded fund, or ETF, to short the Dow Jones Index for trading or hedging purposes.
As described by ProShares,
ProShares Short Dow30 seeks daily investment results, before fees and expenses, that correspond to the inverse (-1x) of the daily performance of the Dow Jones Industrial Average
If the Dow Jones goes down 1% in one day, DOG's price is supposed to go up 1%. To fulfill its objective, the fund holds short positions in futures and swap contracts on the underlying index, associated with treasury bills as collateral.
Practically, there is some tracking error almost every day. The next table reports the daily returns of DOG and SPDR® Dow Jones Industrial Average ETF Trust (DIA) for the last week.
Date | DOG | DIA |
11/24/2023 | -0.31% | 0.35% |
11/22/2023 | -0.47% | 0.50% |
11/21/2023 | 0.25% | -0.20% |
11/20/2023 | -0.59% | 0.60% |
11/17/2023 | 0.06% | -0.17% |
In normal market conditions, tracking errors tend to mitigate on a timescale of a few days. For this 5-day period, DIA gained 1.08% and DOG lost 1.05%, a difference of 3 bps.
In one month, DIA has gained 7.32%, while DOG has lost 6.18%. In the last 12 months, both are in gain: DIA at 5.84%, DOG at 1.53%. Since its inception on 6/19/2006, DIA has gained 380%, while DOG has lost 87%.
These numbers point to a non-linear behavior beyond tracking errors. In fact, it looks a lot like a leveraged ETF.
In fact, an inverse ETF like DOG is a leveraged ETF with a -1 leverage factor. It is subject to volatility drift in addition to tracking errors. Imagine a very volatile asset that goes up 25% one day and down 20% the day after. A perfect inverse leveraged ETF goes down 25% on the first day and up 20% on the second day. On the close of the second day, the underlying asset is back to its initial price:
(1 + 0.25) x (1 - 0.2) = 1.
At the same time, the perfect inverse ETF has lost 10%:
(1 - 0.25) x (1 + 0.2) = 0.9.
In a trending market, drift can be positive. If the underlying index goes up 10% two days in a row, on the second day, it is up 21%:
(1 + 0.1) * (1 + 0.1) = 1.21.
Then, the perfect inverse ETF has lost only 19%, which represents a positive drift of 2%:
(1 - 0.1) * (1 - 0.1) = 0.81.
The drift is path-dependent. If the underlying index gains 50% on day 1 and loses 33.33% on day 2, it is back to its initial value, like in the first example. However, the inverse ETF loses one-third of its value, instead of 10% in the first case:
(1 - 0.5) x (1 + 0.3333) = 0.6667.
Without a demonstration, it is a clue that the decay worsens when volatility is rising.
The Dow Jones index is not as volatile as these examples, but DOG shows some drift at a lower scale.
There is no standard or universally recognized definition for the drift of a leveraged ETF. Mine is simple and based on the difference between the leveraged ETF performance and Ñ times the performance of the underlying index on a given time interval, if Ñ is the leveraging factor.
First, let's start by defining "Return": it is the return of a leveraged ETF in a given time interval, including dividends. "IndexReturn" is the return of a non-leveraged ETF on the same underlying asset in the same time interval, including dividends. "Abs" is the absolute value operator. My "Drift" is the drift of a leveraged ETF normalized to the underlying index exposure in a time interval. It is calculated as follows:
Drift = (Return - (IndexReturn x Ñ))/ Abs(Ñ)
In the case of DOG, the formula is greatly simplified: the sum of the returns of DOG and DIA on a given period.
The next chart plots the 12-month drift of DOG, starting on 7/1/2007 (about 12 months after inception).
12-month drift of DOG, since 7/1/2007 (chart: author; data: Portfolio123)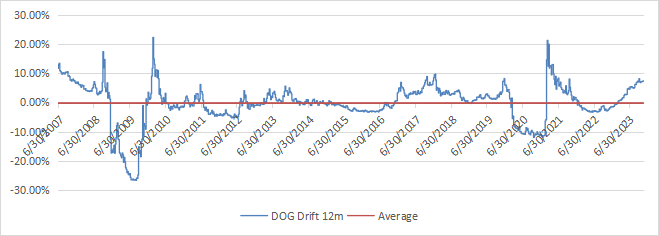
The 12-month drift has varied between -27% and +22%, and it is close to zero on average (exactly -0.23%). The chart shows what was expected: the drift quickly drops in negative territory during very volatile times (like Q4 2008 and Q1 2020), and it goes toward positive values in steady market uptrends.
A negative drift doesn't mean that DOG was a bad hedging instrument in 2008 and 2020, but that volatility was a significant drag on its gains. In general, ProShares Short Dow30 ETF is an efficient hedging instrument against sharp corrections. The cost of hedging is quite cheap compared to other derivatives, and the drift history is much less concerning than for -3x ETFs like ProShares UltraPro Short Dow30 ETF (SDOW). However, it may suffer a decay when the Dow Jones has alternatively positive and negative daily returns.
Even if DOG is among the safer hedging instruments, investors must understand its behavior in order to not panic when drift happens.