PM Images
PM Images
As the markets are digesting the PPI surprise, I would like to discuss the ETF that has been one of the main beneficiaries of this bull market, the Schwab U.S. Large-Cap Growth ETF (NYSEARCA:SCHG). Today's note is supposed to offer a more in-depth look at SCHG's past performance and compare factor stories of this ETF and the Invesco QQQ ETF (QQQ) to decide whether it is worth buying into this comparatively simple yet potent strategy at these levels.
According to its website, SCHG is managed passively, with the Dow Jones U.S. Large-Cap Growth Total Stock Market Index being the nucleus of its strategy. As described in the prospectus:
The index includes the large-cap growth portion of the Dow Jones U.S. Total Stock Market Index actually available to investors in the marketplace. The Dow Jones U.S. Large-Cap Growth Total Stock Market Index includes the components ranked 1-750 by full market capitalization and that are classified as “growth” based on a number of factors. The index is a float-adjusted market capitalization weighted index.
Beating the iShares Core S&P 500 ETF (IVV) has not been an issue for SCHG since its inception in December 2009, as its annualized return over the January 2010–February 2024 period was 2.28% higher. Interestingly, it has also outmaneuvered the iShares Russell 1000 Growth ETF (IWF).
| Portfolio | IVV | QQQ | SCHG | IWF |
| Initial Balance | $10,000 | $10,000 | $10,000 | $10,000 |
| Final Balance | $59,718 | $109,225 | $79,098 | $78,445 |
| CAGR | 13.44% | 18.38% | 15.72% | 15.65% |
| Stdev | 14.77% | 17.71% | 16.82% | 16.19% |
| Best Year | 32.30% | 54.85% | 50.11% | 42.60% |
| Worst Year | -18.16% | -32.58% | -31.80% | -29.31% |
| Max. Drawdown | -23.93% | -32.58% | -31.80% | -30.75% |
| Sharpe Ratio | 0.87 | 0.99 | 0.9 | 0.92 |
| Sortino Ratio | 1.38 | 1.69 | 1.48 | 1.53 |
| Market Correlation | 1 | 0.92 | 0.96 | 0.96 |
Data from Portfolio Visualizer
Looking at a few select risk metrics, we see that it was achieved mostly because of SCHG's outstanding ability to capture more upside during the bull phase. The flip side here is that it lost more when the market was creeping lower, with the downside capture ratio being the worst in this group.
| Metric | IVV | QQQ | SCHG | IWF |
| Upside Capture | 99.24% | 121.48% | 111.91% | 109.09% |
| Downside Capture | 96.89% | 102.66% | 103.09% | 99.43% |
Data from Portfolio Visualizer
Alas, neither SCHG nor IWF were capable of outcompeting QQQ, a vehicle that is considered to be one of the key U.S. tech & growth equity universe barometers. Below, we will be discussing whether QQQ is better than SCHG regarding factors as well.
For a fuller context, I believe it is also worth comparing SCHG's returns to those of the actively managed JPMorgan Active Growth ETF (JGRO) and the Capital Group Growth ETF (CGGR) over the September 2022–February 2024 period (as JGRO was incepted in August 2022, a few months after CGGR). In my January 2024 article on JGRO, I called it "a sound choice for value-averse growth style maximalists." CGGR's strengths and weaknesses were discussed in my July 2023 note.
| Portfolio | SCHG | JGRO | CGGR |
| Initial Balance | $10,000 | $10,000 | $10,000 |
| Final Balance | $14,771 | $14,534 | $14,723 |
| CAGR | 29.70% | 28.31% | 29.42% |
| Stdev | 20.60% | 19.38% | 20.25% |
| Best Year | 50.11% | 37.74% | 42.18% |
| Worst Year | -10.29% | -6.23% | -5.94% |
| Max. Drawdown | -10.29% | -8.85% | -9.19% |
| Sharpe Ratio | 1.15 | 1.15 | 1.15 |
| Sortino Ratio | 1.94 | 2.01 | 2.15 |
| Market Correlation | 0.91 | 0.94 | 0.96 |
Data from Portfolio Visualizer
Over the period concerned, none of the active vehicles were capable of outsmarting SCHG's passive strategy.
Below is an overview of the key factor parameters on the value, growth, and quality fronts:
| Parameter | SCHG | QQQ |
| Holdings (stocks and REITs) | 247 | 101 |
| Market Cap, $ billion | 1,251 | 966.05 |
| EY | 2.7% | 2.85% |
| P/S | 19.97 | 9.57 |
| Revenue Fwd | 15.6% | 12.95% |
| EPS Fwd | 23% | 19.84% |
| ROE adjusted for Booking (BKNG) | 46.9% | 41.4% |
| ROE | 159.1% | 236.69% |
| ROA | 16.2% | 14.58% |
| Quant Valuation B- or higher | 1.3% | 3.3% |
| Quant Valuation D+ or lower | 96.8% | 91.69% |
| Quant Profitability B- or higher | 98% | 97.73% |
| Quant Profitability D+ or lower | 0.7% | 1.15% |
| Quant Growth B- or higher | 67.4% | 61.1% |
| Quant Growth D+ or lower | 1.4% | 6.7% |
Calculated by the author using data from Seeking Alpha and the ETFs. SCHG and QQQ holdings as of March 15. Financial data as of March 16
From the above, I believe it is evident that SCHG does have an edge over QQQ regarding growth and quality.
More specifically, with almost 2.5x more holdings than QQQ, the Schwab ETF has meaningfully higher weighted-average forward revenue and EPS growth rates. This is partly because SCHG has a larger allocation to NVIDIA (NVDA), 8.8% vs. 6.3%, so NVDA's 69.4% forward revenue growth rate has had a larger impact on the portfolio-wise figure. The key beneficiary of the AI frenzy has also solidly contributed to SCHG's WA market cap. However, there are other meaningful contributors. Close to 31% of SCHG's holdings are absent in QQQ, and among them, 5.1% have revenue growth rates above 20%. Interestingly, SCHG's more pronounced growth tilt was achieved despite having a smaller allocation to IT and a larger allocation to financials than QQQ.
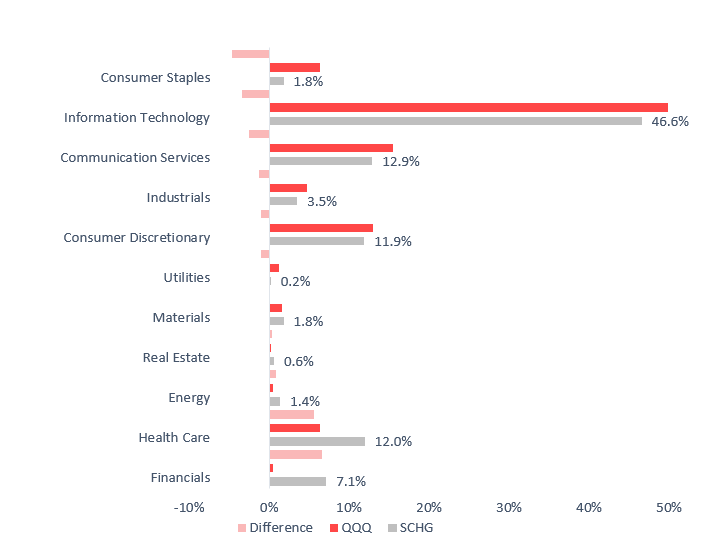
Created by the author using data from the ETFs
Turning to quality, SCHG's holdings mostly more efficiently use their capital than QQQ's, as is evident from the weighted average Return on Assets. NVDA is once again the principal contributor with its 45.3% ROA. Apple (AAPL), which SCHG has overweighted (10.2% vs. 7.65%) despite the company having fairly questionable growth characteristics, is in second place with a 28.6% ROA. Unfortunately, Return on Equity is of no use as it is distorted by BKNG, which has a 22,574% ROE. Adjusted for BKNG, this metric is a few percentage points higher than QQQ's. Regarding exposure to stocks with a B- Quant Profitability grade or higher, both ETFs have excellent results, though the Schwab ETF is slightly ahead.
Finally, valuation is the Achilles' heel of both ETFs. This is hardly surprising, assuming they are value-agnostic. This is a risk worth bearing in mind. For more context on valuation, I prepared a few scatter plots.
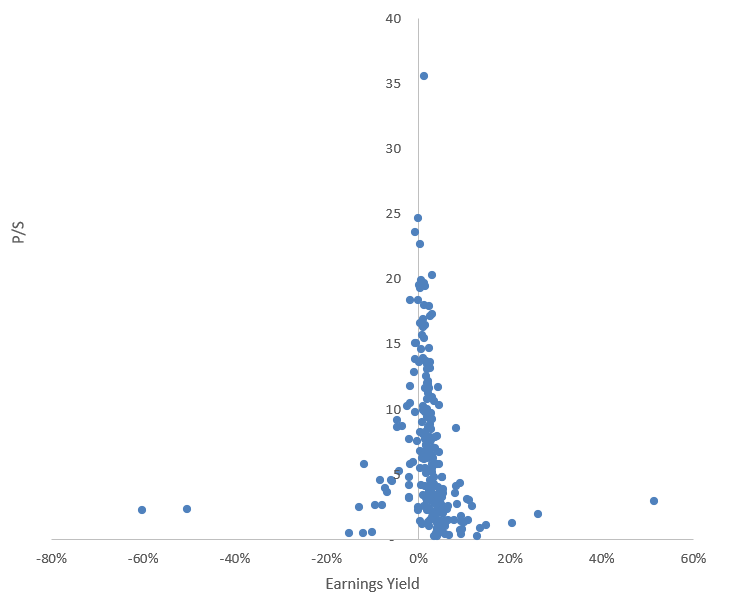
Created by the author using data from Seeking Alpha and SCHG
A nuance here is that the following stocks were removed to improve the readability of the chart:
| Stock | Weight in SCHG | Sector | EY | P/S |
| Karuna Therapeutics (KRTX) | 0.05% | Health Care | -3.4% | 18,639.73 |
| Roivant Sciences (ROIV) | 0.01% | Health Care | 54.7% | 63.2 |
Data from Seeking Alpha and SCHG
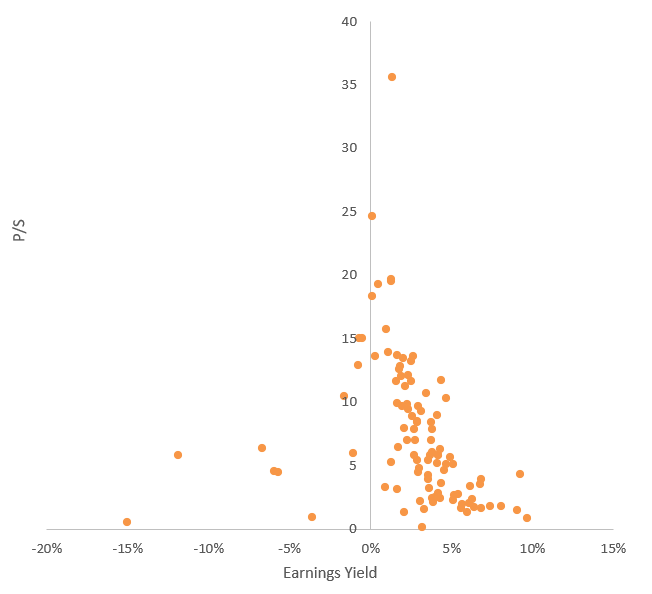
Created by the author using data from Seeking Alpha and QQQ
As we can see, both ETFs have sizable exposure to stocks with P/S ratios above 10x and low single-digit earnings yields. However, there are differences in the weighted average figures, mostly driven by NVDA again.
Whether to buy or not to buy depends on an investor's style preferences and his or her opinion on whether the current zeitgeist will persist or is about to dissipate and whether a fresh value rotation is just around the corner. If the latter is valid, it is obviously worth steering clear of it.
A more complicated question here is whether SCHG has an edge over other investment vehicles available to growth investors. I would argue that it does have it. It is one of the largest, most liquid, and most solidly performing ETFs in the Large Growth sub-class. Obviously, it was incapable of beating QQQ in the past (except for 2021, 2022, and the first two months of 2024), and its AUM is nowhere near. However, I believe SCHG is an in-between vehicle that might work for investors who are seeking a more middle-ground ETF that has higher total returns than IVV or the SPDR S&P 500 ETF Trust (SPY) and is less volatile than QQQ.
All in all, SCHG is a high-quality, long-duration equity play with a respectable track record. Its expense ratio is diminutive at 4 bps, which is substantially lower compared to both QQQ and the Invesco NASDAQ 100 ETF (QQQM). I am fond of how this vehicle blends size, quality, and growth, and thus I suppose growth investors should consider gaining exposure to it. I believe it deserves a Buy rating.