
samxmeg
samxmeg
Schwab Emerging Markets Equity ETF (NYSEARCA:SCHE) started investing operations on 1/14/2010 and tracks the FTSE Emerging Index. It has 1918 holdings, a trailing 12-month yield of 3.17% and an expense ratio of 0.11%. Distributions are paid semi-annually.
As described by FTSE,
The FTSE Emerging Index provides investors with a comprehensive means of measuring the performance of the most liquid Large and Mid Cap companies in the emerging markets. FTSE Emerging Markets indexes are part of the FTSE Global Equity Index Series (GEIS). The series includes large and mid cap securities from advanced and secondary emerging markets, classified in accordance with FTSE's transparent Country Classification Review Process.
SCHE is mostly invested in large cap stocks: about 60% of asset value is in companies with more than $15B in market capitalization.
SCHE size segments (chart: author; data: Schwab)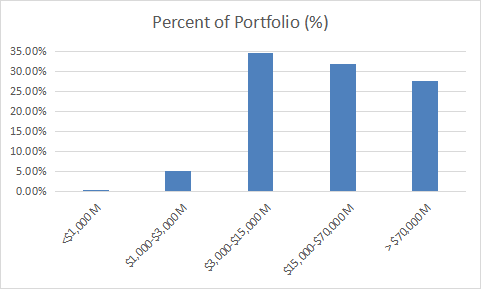
The fund is overweight in China (32.6%). Then, come India (19.2%) and Taiwan (16.2%). Other countries are below 7%. Exposure to geopolitical risks related to China is very high: China and Taiwan represent 48.7% of assets together. The next chart lists the top 10 countries, with an aggregate weight about 92%.
SCHE country allocation (chart: author, data: Schwab.)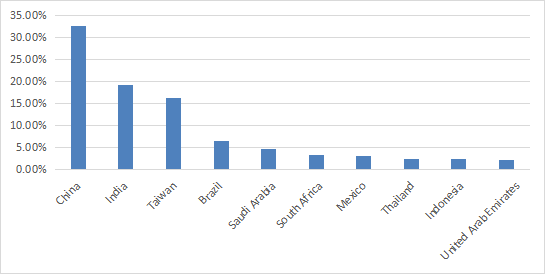
The portfolio is quite diversified across sectors: none of them weighs more than 25%. However, it is heavy in financials (22.8%), especially in banks. Technology (16%) and consumer discretionary (14%) also have a significant weight. Other sectors are below 10%, but they still represent 47.2% of assets in aggregate.
SCHE sector breakdown (Chart: author, data: Schwab)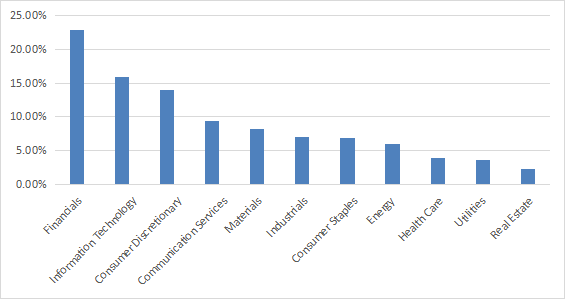
The next table lists the 10 stocks, weighting about 21% of asset value. Taiwan Semiconductor Manufacturing (TSM) is the heaviest one (6.6%). Other positions are under 4%.
Name | Weight% | Country | Symbol | Sector |
TAIWAN SEMICONDUCTOR MANUFACTURING | 6.59 | TW | 2330 | Information Technology |
TENCENT HOLDINGS LTD | 3.86 | CN | 700 | Communication Services |
ALIBABA GROUP HOLDING LTD | 2.91 | CN | 9988 | Consumer Discretionary |
RELIANCE INDUSTRIES LTD | 1.51 | IN | RELIANCE | Energy |
MEITUAN | 1.26 | CN | 3690 | Consumer Discretionary |
HDFC BANK LTD | 1.13 | IN | HDFCBANK | Financials |
PDD HOLDINGS ADS INC | 1.09 | CN | PDD | Consumer Discretionary |
INFOSYS LTD | 0.96 | IN | INFY | Information Technology |
CHINA CONSTRUCTION BANK CORP H | 0.91 | CN | 939 | Financials |
VALE SA | 0.84 | BR | VALE3 | Materials |
The next tables compare SCHE with the four largest emerging markets ETFs tracking non-currency-hedged indexes:
SCHE is the less liquid of the group, yet trading volume is high enough to satisfy long-term investors and swing traders as well. EEM, the most popular measured in trading volume (so the most suitable for short-term trading), also has a much higher expense ratio than its peers (0.69% vs. 0.07% to 0.11%).
SCHE | VWO | IEMG | EEM | SPEM | |
Inception | 1/14/2010 | 3/4/2005 | 10/18/2012 | 4/7/2003 | 3/19/2007 |
Expense Ratio | 0.11% | 0.08% | 0.09% | 0.69% | 0.07% |
AUM | $7.88B | $67.90B | $66.57B | $16.28B | $7.09B |
Average Daily Dollar Volume | $36.15M | $362.40M | $508.72M | $1.05B | $58.85M |
Number of Holdings | 1918 | 4791 | 3214 | 1380 | 3540 |
Assets in Top 10 | 20.96% | 17.13% | 19.72% | 22.94% | 17.73% |
Data: Seeking Alpha
SCHE, VWO and SPEM feature a 3%+ dividend yield, whereas IEMG and EEM are close to 2.5%. SPEM shows the highest dividend-growth rate in 5 years, and SCHE is in the middle of the pack in this regard. VWO is the only one with a quarterly distribution, which may make a difference for dividend-oriented investors. The others pay distributions only twice a year.
SCHE | VWO | IEMG | EEM | SPEM | |
Dividend Yield, TTM | 3.17% | 3.22% | 2.50% | 2.45% | 3.41% |
Dividend Frequency | Semiannual | Quarterly | Semiannual | Semiannual | Semiannual |
Dividend Growth 5Y CAGR | 2.54% | 3.00% | -4.20% | -1.94% | 12.98% |
Data: Seeking Alpha
There is no significant difference in aggregate valuation and growth metrics between these funds, as reported in the next table. IEMG and EEM look marginally better in earnings growth.
SCHE | VWO | IEMG | EEM | SPEM | |
Price/trailing earnings | 12.6 | 12.86 | 12.4 | 12.29 | 12.53 |
Price/book | 1.65 | 1.66 | 1.56 | 1.56 | 1.63 |
Price/sales | 1.38 | 1.34 | 1.25 | 1.31 | 1.32 |
Price/cash flow | 8.08 | 8.06 | 8 | 8.1 | 7.85 |
Trailing earnings growth % | 18.73% | 18.88% | 21.06% | 20.92% | 19.48% |
Sales growth % | 11.78% | 11.11% | 11.63% | 11.86% | 10.30% |
Cash flow growth % | 7.73% | 7.22% | 7.37% | 7.56% | 9.35% |
Data: Fidelity
Regarding performance, SCHE is behind SPEM and almost on par with VWO in 10-year total return. However, the difference with SPEM in annualized return is only about 50 bps. EEM has been lagging its peers.
SCHE | VWO | IEMG | EEM | SPEM | |
1Y Price Return | 5.53% | 5.44% | 7.17% | 5.88% | 5.69% |
1Y Total Return | 8.74% | 8.70% | 9.73% | 8.34% | 9.16% |
10Y Price Return | -10.09% | -10.30% | -9.82% | -14.02% | -2.49% |
10 Y Total Return | 18.28% | 18.74% | 15.81% | 6.06% | 23.34% |
Data: Seeking Alpha
Schwab Emerging Markets Equity ETF is a large and mid-cap emerging markets ETF. It is well diversified across sectors and holdings, but overweight in China, like most emerging market funds. The next table is a summary of our comparison between SCHE and four close competitors. The fund winning in more characteristics is SPEM, followed by VWO. However, all characteristics may not have the same importance for all investors. Feel free to make your own ranking from the data reported in this article.
Investors who like emerging markets, but not Chinese companies, may consider funds excluding China like iShares MSCI Emerging Markets ex China ETF (EMXC).
Winner | SCHE rank | |
Fees | SPEM | 4 |
AUM | VWO | 4 |
Liquidity | EEM | 5 |
Diversification | VWO | 4 |
Div. Yield | SPEM | 4 |
Div. frequency | VWO | 2 |
Div. growth | SPEM | 3 |
1Y return | IEMG | 3 |
10Y return | SPEM | 3 |
Valuation | on par | |
Growth | on par |
Editor's Note: This article discusses one or more securities that do not trade on a major U.S. exchange. Please be aware of the risks associated with these stocks.