
Laurence Dutton
Laurence Dutton
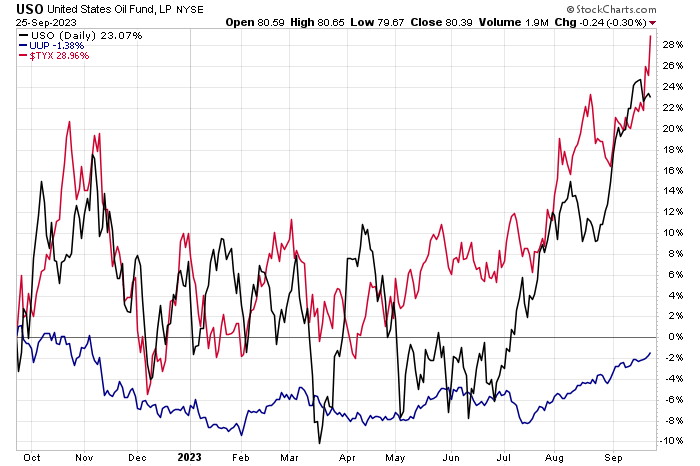
It’s a September to remember for the bears. Q3 in general has been a struggle for stocks, and the latest dip has hit some of the ‘junk’ particularly hard. The ARK Innovation ETF (ARKK) has fallen from above $51 to under $39 since mid-July. It was a bit more than two months ago when interest rates were relatively stable, the dollar was dipping, and commodities were looking quite weak.
Things have changed quite a bit at the macro level, and the disruptive tech theme has taken a back seat to the reality that interest rates will stay high through 2024. Spreadsheet math asserts that higher discount rates should pressure long-duration equities more than those with low debt and high current free cash flow.
Still, I see upside potential to ARKK, or at least an easing of the selling pressure as we enter a better part of the calendar. Likewise, investors holding shares of the AXS Short Innovation Daily ETF (NASDAQ:SARK) should book profits after a solid Q3 return. Let’s dig into why now may be the time to get your buy lists ready on some risky tech-related plays.
Stockcharts.com
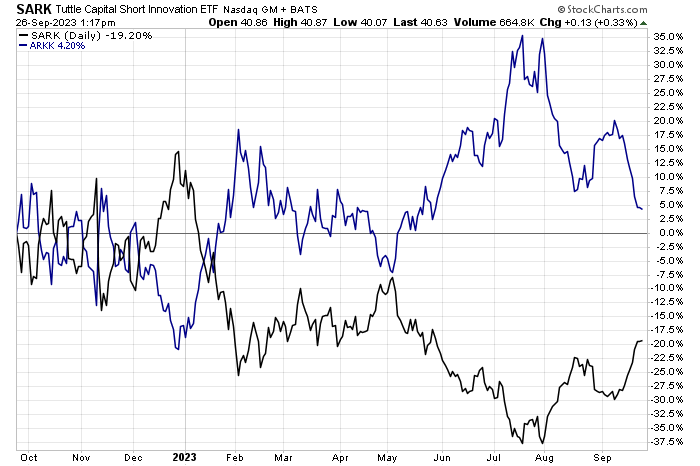
According to the issuer, SARK aims to provide investors with daily inverse (-1x) exposure to the performance of the ARK Innovation ETF before fees and expenses. This means that if ARKK goes down by 1% in a day, SARK seeks to go up by approximately 1% on the same day. Given the daily reset, investors should be aware of the risk of holding a product like SARK beyond a single session. While it is not a leveraged ETF, the fund does employ derivatives to capture its objectives, adding to what is already a risky portfolio strategy.
Stockcharts.com
The fund is designed for investors who believe that disruptive innovation has become overvalued and that growth stock valuations are too lofty. AXS Investments states that SARK allows investors to take a bearish position on transformational industries such as next-gen Internet, electric vehicles, genomics, and fintech.
SARK is a small ETF with just $233 million of assets under management. Daily volume has also trended lower from the first quarter of this year. As it stands, typical trading volume is respectable at 1.11 million shares as of September 25, 2023. While no bid/ask spread is listed, the fund earns a strong A- liquidity rating. Troubling, however, is that SARK’s net expense ratio is high at 0.75% and current share price momentum is not impressive over an extended period, despite the Q3 alpha it has generated.
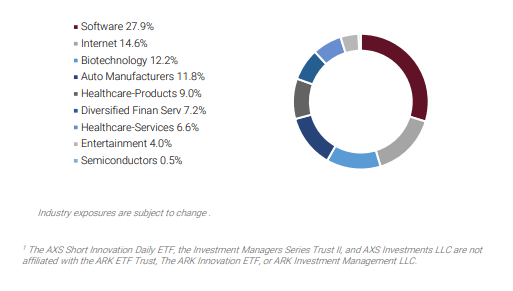
So, here’s what you get by owning SARK – the short portfolio is most exposed to the Software industry with the Internet space not far behind. There’s also exposure away from the Information Technology sector – Biotech is 12% while the Consumer Discretionary Auto Manufacturer’s niche is also near 12%. In general, however, many of the equities are of comparable factor profiles.
AXS Investments
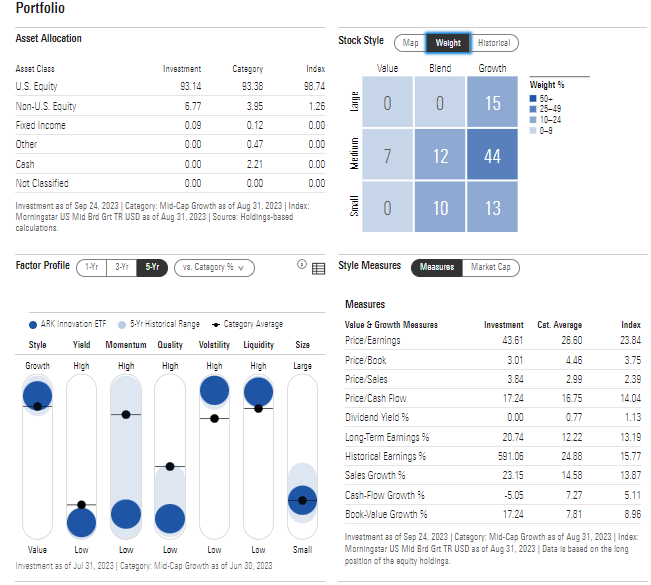
Let’s inspect the holdings of what SARK seeks to short. The ARKK ETF indeed trades at a lofty 44 times earnings, per Morningstar. While that of course seems like an absurd valuation, you also get high earnings growth with the portfolio. Also, the allocation collectively sells for a reasonable 3.8 times sales.
The current environment looks far different from two years ago when P/S multiples were to the moon. I assert that the valuation case is not all that for ARKK today given the steep drawdown of its strategy. Of course, a continued rise in interest rates and away from low-quality companies would help the SARK bulls out there.
Morningstar
Seasonally, ARKK tends to bottom out in October after a September slide. And that has generally played out in its 8-year history, according to data provided by Equity Clock.
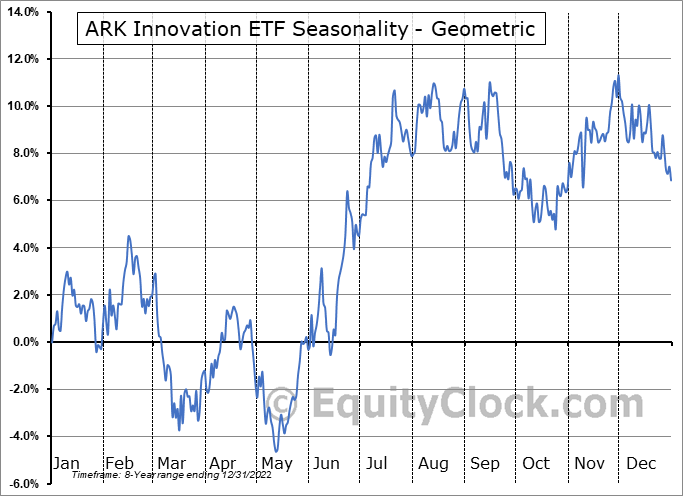
Equity Clock
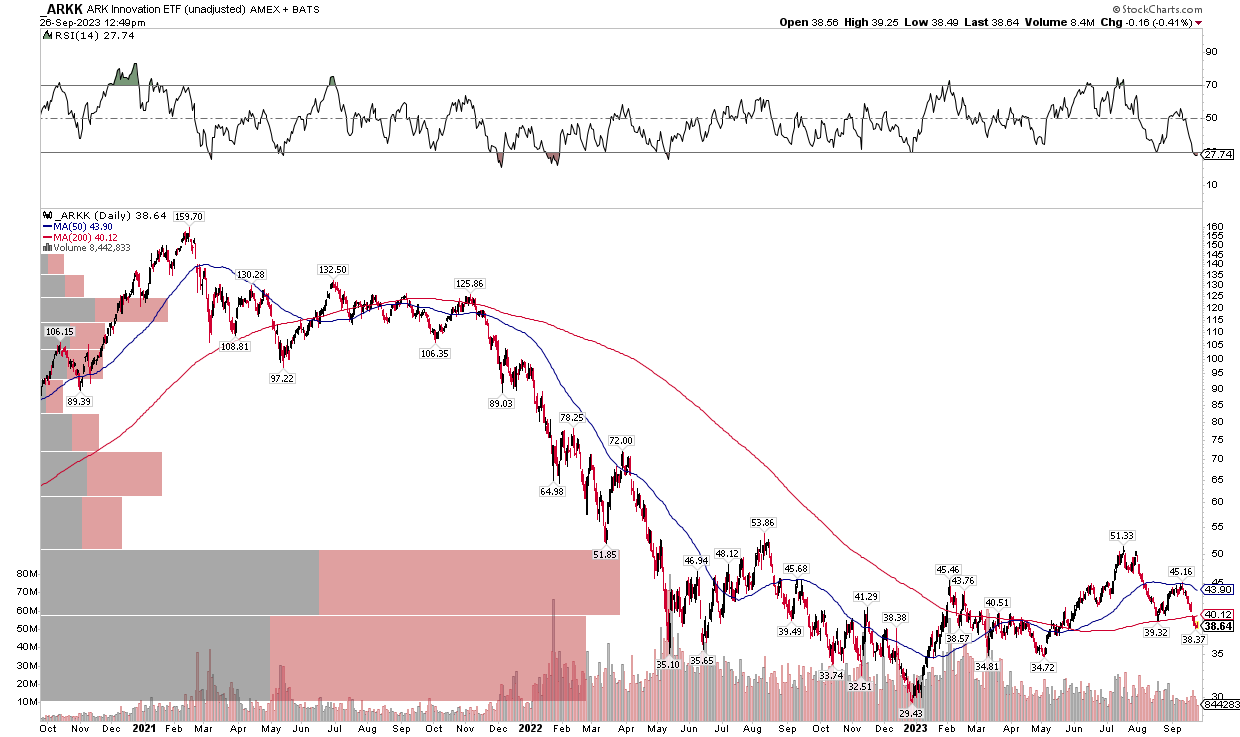
We must understand the price action on ARKK in order to come to a conclusion about SARK. Notice in the ARKK chart below that shares are trying to put in a bearish to bullish reversal pattern. Admittedly, I do not like to seeing the August low get taken out. Also, the fund is now significantly below its modestly rising long-term 200-day moving average – a bearish sign.
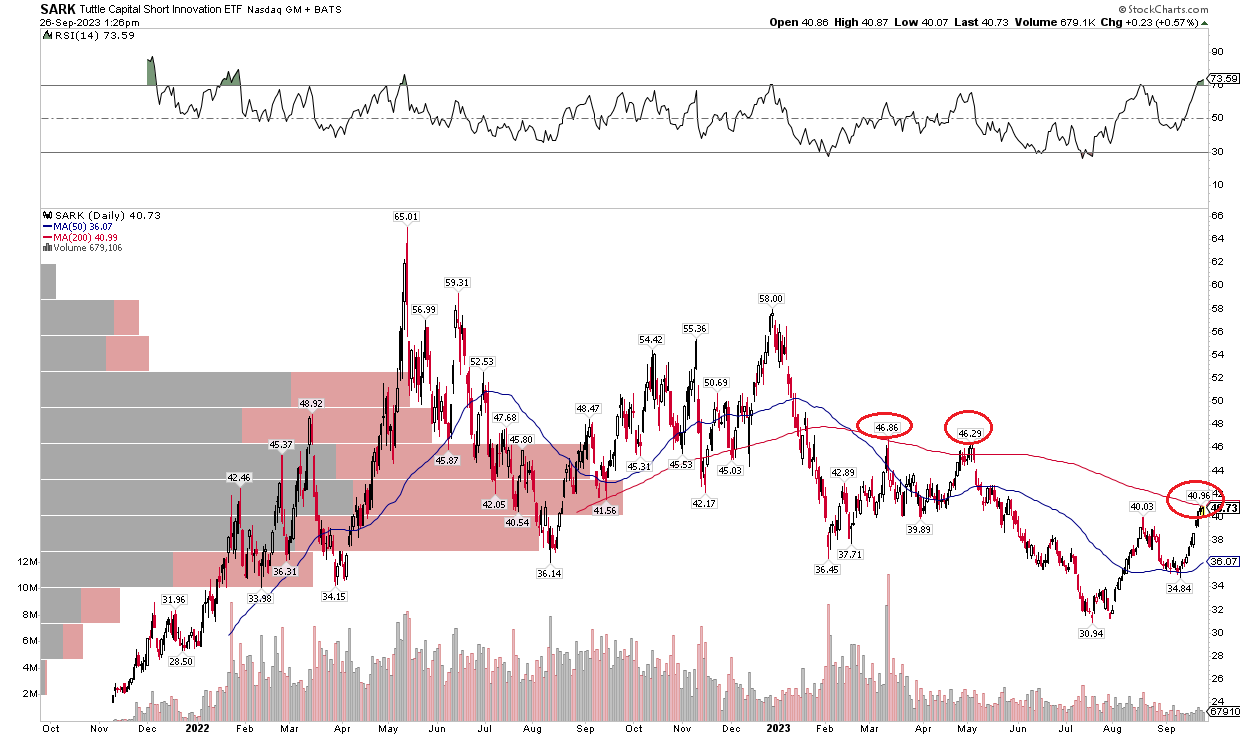
ARKK also met selling pressure when it tried to rally above its 50dma earlier this month. Could it fall to the March and May lows just shy of $35? Certainly, but the volume thrust that came about off the late 2022 low looks solid. It may take time, but I see a bottoming formation ongoing, so the time to be long SARK has come and gone. While a swing trade long SARK this summer worked well, booking profits appears prudent ahead of October.
Stockcharts.com
Stockcharts.com
I have a sell rating on SARK. Its very high expense ratio and longer-term risk by taking an inverse position on a portfolio of stocks is likely not a favorable long-term strategy. Also, following a significant July through September jump, trimming gains is wise ahead of what is often a bullish period for the broader market.