
Lemon_tm
Lemon_tm
Seabridge Gold Inc. (NYSE:SA) is a Canadian development-stage mining company focused on developing its 100% owned flagship asset, the KSM (Kerr Sulphurets Mitchel) Project, in British Columbia. Tier-1 mining assets in Tier-1 jurisdictions represent an investment case in Seabridge Gold. The company is also advancing E&D (Exploration and Development) activities at its other promising mining properties, namely Iskut (British Columbia), 3 Aces (Yukon), Courageous Lake (Northwest Territories), and Snowstorn (Nevada). Seabridge's business model centers on focused exploration to expand its already significant mineral resources underlying its mining assets in Tier-1 locations. Seabridge expects to enter a strategic partnership to help secure project development funds, since its available liquidity is too low to support KSM's significant development CAPEX.
In this article, we discuss the following areas to help us consider an investment thesis about the company:
1. There is promising growth potential associated with Seabridge's mining assets, particularly the KSM Project.
2. KSM development CAPEX is huge, and Seabridge intends to find a strategic partner to secure project financing.
3. The share price is highly leveraged to gold price volatility.
Let's get into the details.
In 2022, Seabridge filed the NI 43-101 Technical Report on the KSM Project, which included a PFS (PreFeasibility Study) and a PEA (Preliminary Economic Assessment) on the significant deposits included within the Project.
1) 2022 PreFeasibility Study: The 2022 PFS revealed an open pit mine plan (which will utilize a flotation and gold extraction mill to produce metal concentrate that will be trucked to a nearby seaport from where it will be transported to smelters) with an expected life of 33 years and recorded some improvements from the 2016 PFS on the KSM Project.
Notably, the 2022 PFS revealed the following changes (mostly positive) from the 2016 PFS report:
The 2022 PFS also highlighted total costs (at base case estimates) of $601/oz gold after adjusting for BPC (by-product credits) from copper, silver, and molybdenum. Interestingly, at spot gold prices varying between the range of $2,000 and $2,050/oz, these expected total costs leave room for significant operating margins (at ~$1,400/oz gold equivalent production). The operating margins are set for further increase when we consider Seabridge's alternate total cost forecasts of ~$490/oz based on then-spot gold prices of ~$1,850/oz (at the time of the release of the Technical Report in 2022). The KSM Project's 2022 PFS highlighted an underlying tonnage of 2,292 million tons of ore at an average grade of 0.64 g/t gold, 0.14% copper, 2.2 g/t silver, and 76 ppm (parts per million) molybdenum, which is expected to convert to 47.3 Moz gold, 7,320 million pounds copper, 160 Moz silver, and 385 million pounds molybdenum. It's important to note that the PFS only incorporated results from the Mitchell, East Mitchell, and Sulphurets deposits and excluded the resource estimate attributable to the Kerr and Iron Cap deposits.
Total Cost Estimates Under KSM's PFS 2022 - Source: NI 43-101 Technical Report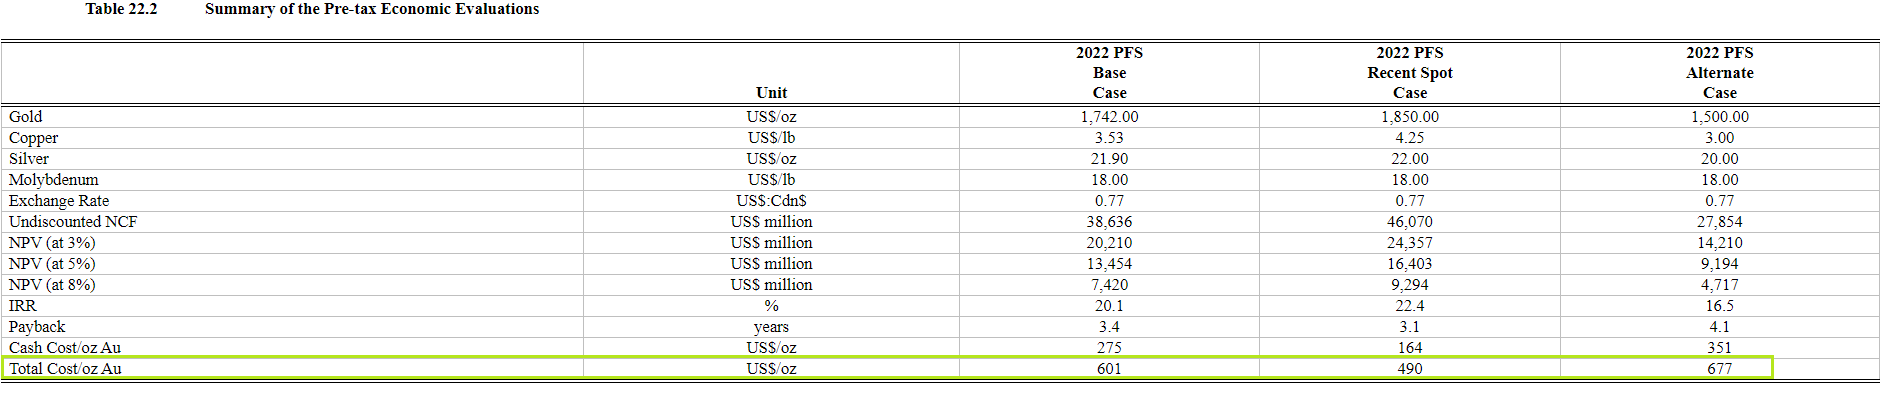
2) 2022 Preliminary Economic Assessment: The 2022 PEA reveals an underground mine plan at the copper-rich Iron Cap deposit using the block cave mining method. Later, Iron Cap's production will be supplemented with a small-scale open pit operation at the Kerr deposit. The PEA highlights a mine life of 39 years, with a peak milling capacity of ~170,000 tpd from Year 12 onward.
The Iron Cap will be an extension to the KSM mine and is expected to produce ~368 Koz (a thousand ounces) of gold, 366 Mlb (a million pounds) of copper, 1.8 Moz of silver, and 0.4 Mlb of molybdenum annually. The underground mine's total cost per pound of copper (~$1.44/lb) provides significant operating margins of ~$2/lb copper at spot copper prices of ~$3.88/lb. The PEA estimates an after-tax NPV of $5.8 BB (discounted at 5%), an after-tax IRR of 18.9%, and a project payback period (after-tax) of 6.2 years.
A) Grades: KSM's mineral reserves are estimated (updated January 2024) to contain a LoM average gold grade of 0.64 g/t. In gold mining, grade is king; higher grade translates into lower production costs and vice versa. I consider KSM's grades impressive due to the following reasons:
British Columbia Gold Grades Versus Other Provinces - Source: S&P Global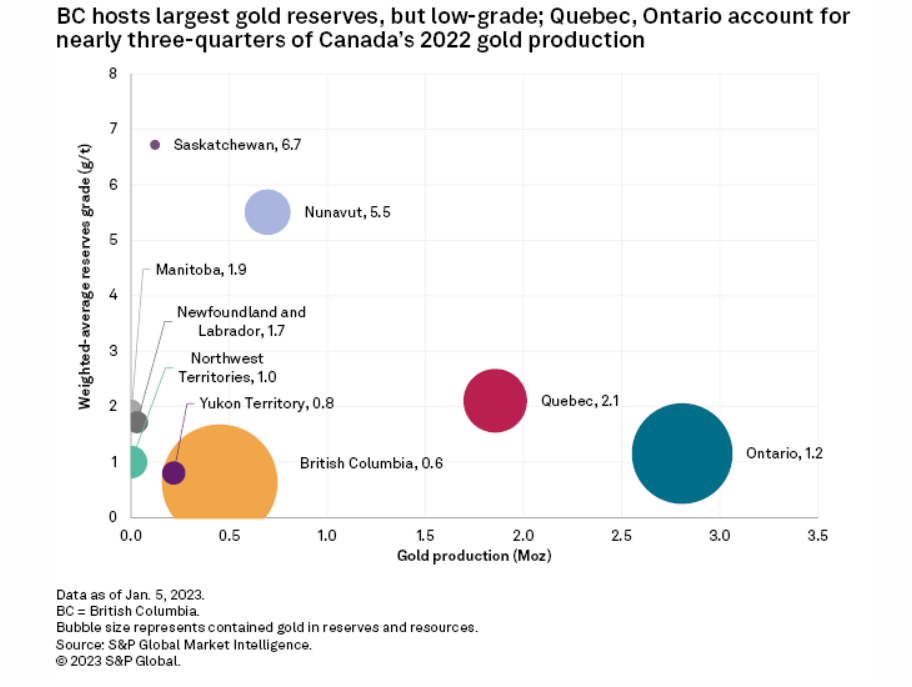
KSM Metal Grades During First 7 Years of Production - Source: NI 43-101 Technical Report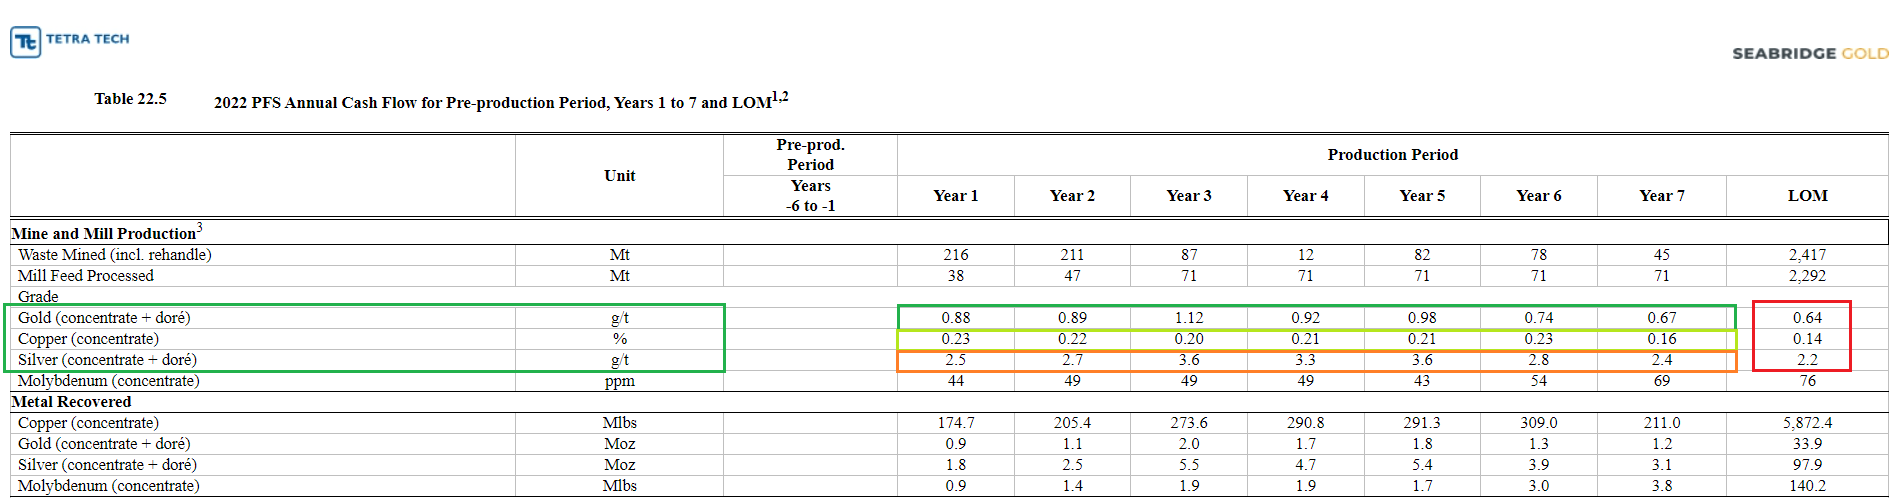
| WRN's Casino Project | Seabridge's KSM Project | |
| Type of Estimate | Proven and Probable Reserves | Proven and Probable Reserves |
| Gold Grade | 0.22 g/t gold | 0.64 g/t gold |
| Copper Grade | 0.19% copper | 0.14% copper |
| Silver Grade | 1.7 g/t silver | 2.2 g/t silver |
| Gold Reserves | 8.5 Moz gold | 17.7 Moz gold |
| Copper Reserves | 5,079 Mlbs copper | 7,320 Mlbs copper |
| Silver Reserves | 64.9 Moz silver | 160 Moz silver |
B) Valuation: I believe NPV/share is a valuable metric to assess the valuation of a mining company whose flagship project is under development. As noted earlier, the KSM Project's Technical Report estimates an after-tax NPV@5% of US$7.9 BB. Using Seabridge's fully diluted share count of ~87 MM gives an NPV/share of ~$90 against the last traded price of $11.60/share (approximately 7.7x upside). Seabridge's 20-year price chart indicates that the share price peaked at $36.88 in October 2007 (check the chart below). Interestingly, gold, copper, and silver prices in October 2007 were lower than today. At the current price levels, Seabridge appears to be trading at a significant discount based on the NPV/share of its flagship KSM Project alone. That is to say, without accounting for the impact of making arrangements for CAPEX.
Seabridge Gold's 20-Year Price Chart - Source: Seeking Alpha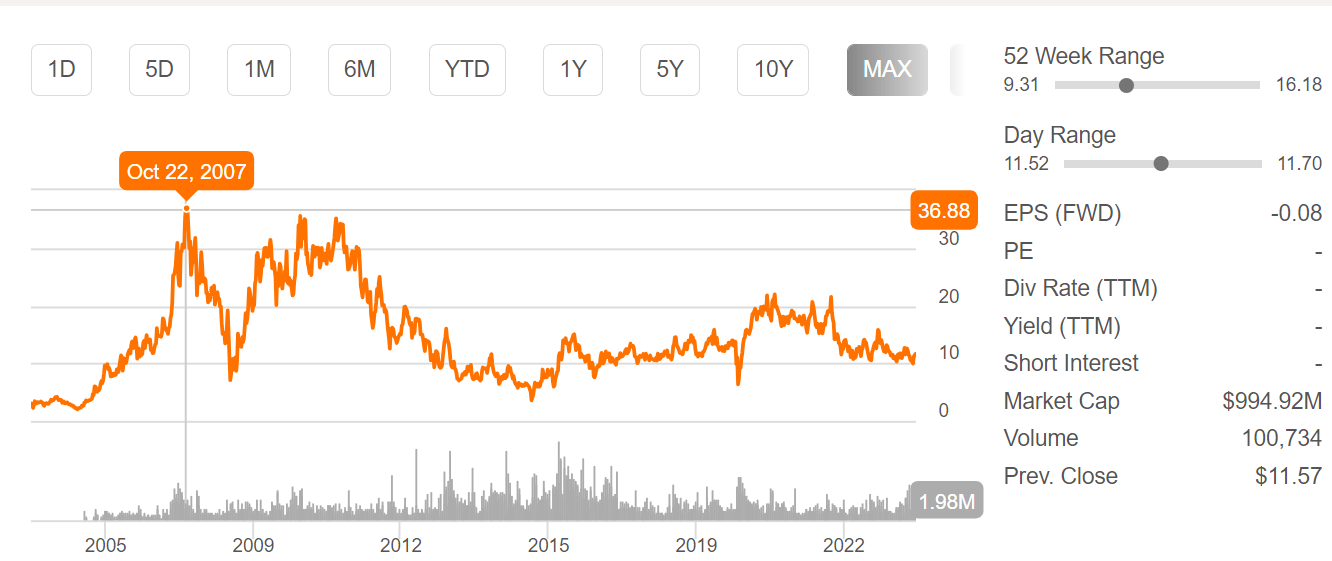
As noted earlier, KSM's revised estimated CAPEX is ~$6.4 BB, which is a gigantic figure, especially considering the open pit nature of the proposed mine. The company's latest February 2024 Presentation reveals its current liquidity at ~C$130 MM+ (including cash worth ~C$119 MM and short-term deposits worth ~C$10 MM), which is sufficient to support Seabridge's ongoing exploration program. However, the company cannot fund the Project's development CAPEX alone. It can raise an expected US$30 MM by selling its non-core assets but needs to partner with a mining giant to develop the KSM Project and other significant assets (including Courageous Lake, Iskut, 3 Aces, and Snowstorm).
If the company goes for equity issuance to fund project development CAPEX, it'll impact the stock's valuation (which looks very attractive at the current price levels). It already has a US$225 MM Secured Note liability on its balance sheet (transaction executed in March 2022). Seabridge may opt for a mix of equity and debt issuance to obtain project finance. Interestingly, per the terms (read point # iv) of the Secured Note issued to Sprott (Sprott Private Resource Streaming and Royalty Corp.), Seabridge has to secure project financing by March 24, 2027; otherwise, Sprott may exercise the option to put the Secured Note back to Seabridge for payment of US$232.5 MM (either through cash or issuance of Seabridge shares). The 2022 Sprott transaction entitles Sprott to a 60% gross silver royalty on its 100% owned KSM Project.
Given the above, I think Seabridge has the following options for securing project financing for KSM (assuming the permitting process runs smoothly):
1) It may enter into a JV partnership with a mining giant that'd assume the financial responsibility (or a large portion of it, to say the least) of developing the mine.
2) It may enter into a metals royalty/streaming agreement (similar to the abovementioned Sprott transaction). However, any such transaction will likely impact SA's future cash flows (interest expense) and future revenues (royalty/streaming arrangement) related to the mine's production.
3) It can sell one or more of its significant projects (other than KSM) or wait to be bought out altogether. During the past five years, the mining industry has seen some notable acquisitions of development-stage companies by mining giants, such as the following:
Let's see when (and if) Seabridge gets an offer from a mining giant for its promising KSM Project because the project's mining economics are remarkable (as discussed earlier). The company's CEO, Rudy Fronk, has stated on multiple occasions (check the CEO's interviews here) that his company is looking for a development partner, especially for its flagship KSM Project. Any such offer from a large mining company would surely bring healthy share price gains.
The table below highlights that Seabridge's share price has reacted strongly to bullish/bearish trends in gold prices (data taken from Finviz). While we may continue to experience near-term gold price volatility given the uncertainty about the Fed's expected rate cut, long-term improvement in gold prices may come from Central Banks' gold rush, recession fears, etc. It remains to be seen whether gold prices can breach the mid-term resistance levels of ~$2,100/oz, as that would be a significant near-term tailwind for Seabridge's share price.
| Period | Gold Price Range | Gold Price Change | Seabridge Price Range | Seabridge Price Change |
| Feb 15. to Feb. 23, 2024 | $2,000 to $2,045 per ounce (Bullish) | $45 per ounce (Up 2.25%) | $9.50 to $11.74 per share (Bullish) | $2.24 per share (Up 24%) |
| Oct 6. - Oct. 30, 2023 | $1,834 to $2,013 per ounce (Bullish) | $180 per ounce (Up 10%) | $9.72 to $11.30 per share (Bullish) | $1.58 per share (Up 16%) |
| Feb. 1 to Feb. 14, 2024 | $2,057 to $2,006 per ounce (Bearish) | $51 per ounce (Down 2.5%) | $10.61 to $9.50 per share (Bearish) | $1.11 (Down 10.5%) |
| Sep. 20 to Oct. 6, 2023 | $1,952 to $1,834 per ounce (Bearish) | $118 per ounce (Down 6%) | $11.53 to $9.72 per share (Bearish) | $1.81 per share (Down 15%) |
It's also pertinent to mention that Seabridge's price returns exceed those of its benchmark ETFs, namely VanEck Junior Gold Miners ETF (GDXJ) and Amplify Junior Silver Miners' ETF (SILJ). Seabridge constitutes 1.01% and 2.30% of the respective holdings of GDXJ and SILJ (as of this writing). Look at the chart below.
1-Year Price Returns - Seabridge Gold v/s GDXJ/SILJ - Source: Seeking Alpha Premium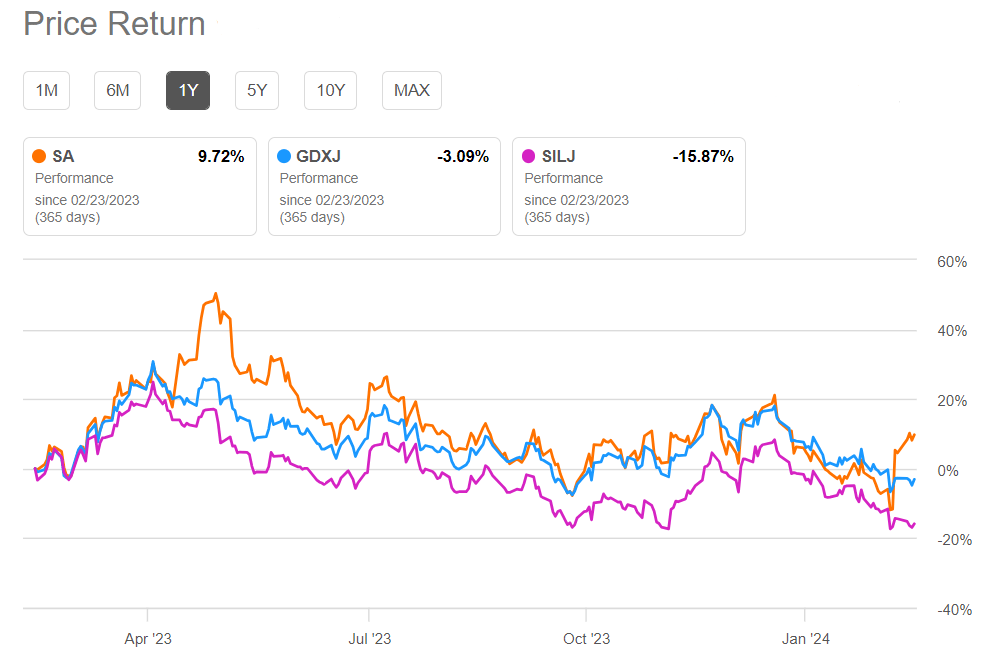
Meanwhile, the global copper price outlook remains largely positive due to an expected sustainable increase in demand that would help uplift copper prices in the near-to-medium and the long term. Supply disruptions (such as the production halt at First Quantum's Cobre Panama mine) will keep a check on the supply side.
When writing, Seabridge last traded at ~$11.74/share, 8% below the mid-point (at ~$12.75/share) of its 52-week range between $9.31 and $16.18/share. As discussed in our analysis, the stock responds well to positive signals from gold prices (which caused the recent bullish momentum in Seabridge's prices). The stock's 14-day RSI (Relative Strength Index) score of 61.17 indicates it's trading in the technically neutral territory but may reach the overbought territory if the RSI reaches 70 points. Finally, the stock's technical price chart (check below) indicates that it could witness near-term share price appreciation to the range of $12 and 12.50, subject to continued positive momentum in gold prices.
SA's Technical Price Chart - Source: Finviz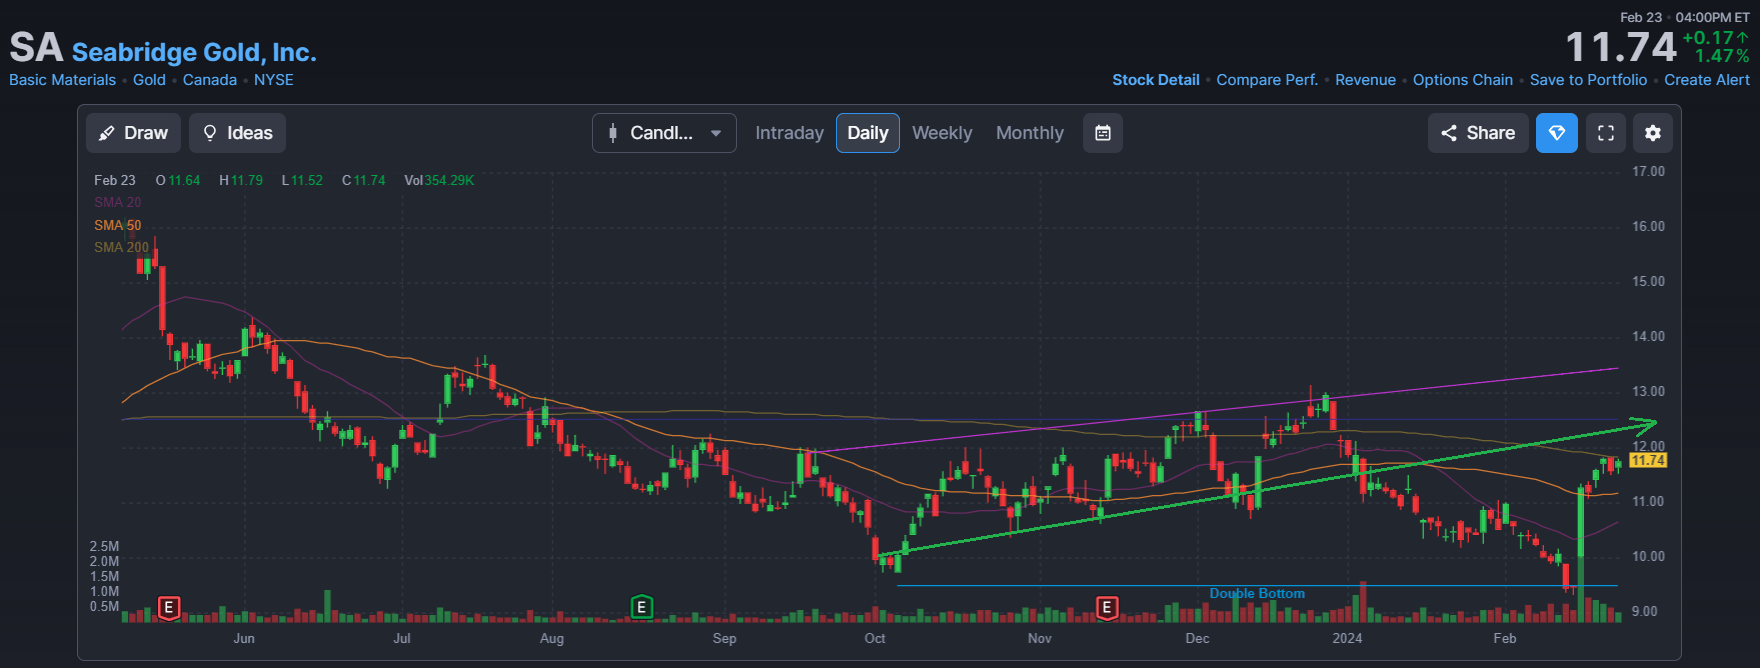
From a fundamental analysis perspective, SA maintains a portfolio of promising mining assets (primarily gold) in low-risk jurisdictions, and the mining dynamics of its flagship KSM project are exceptional. Based on the estimated underlying reserves of the KSM project, SA's share price appears to have an attractive valuation. However, the valuation perspective should be assessed considering KSM's massive development CAPEX. Meanwhile, the company is conducting targeted exploration to discover more gold ounces underground and is focusing on converting the mineral resources into reserves. Until Seabridge's management finds a partner for project development, I believe the stock will be a momentum play, providing strong leverage to volatile gold prices.