
princessdlaf
princessdlaf
iShares S&P Small-Cap 600 Value ETF (NYSEARCA:IJS) warrants a hold rating due to mixed factors impacting the fund. While small-cap stocks have performed well over the past 80 years historically, they have recently underperformed significantly. This recent underperformance has resulted in a value opportunity for small-cap holdings and the ETFs that contain them. However, with regards to IJS, Vanguard's Small-Cap Value ETF (VBR) has stronger long-term performance, a lower expense ratio, and higher dividend yield, making VBR a more attractive option.
IJS is an ETF that seeks to provide exposure to U.S. small-cap stocks that are thought to be undervalued by tracking the S&P SmallCap 600 Value Index. With its inception in 2000, the fund has 500 holdings and $6.92B in AUM. IJS has the greatest sector weight on financials (25.00%), followed by industrials (15.10%) and consumer discretionary (13.46%).
For comparison purposes, other funds examined are VBR, SPDR S&P 600 Small Cap Value ETF (SLYV), and Invesco S&P SmallCap 600 Pure Value ETF (RZV). VBR seeks to track the performance of the CRSP U.S. Small Cap Value Index with the goal of capturing the returns of small-cap value stocks. VBR's greatest sector weight is in industrials (24.10%) and financials (21.40%). SLYV tracks the S&P SmallCap 600 Value Index and includes holdings based on P/E and P/B ratios. RZV is based on the S&P SmallCap 600 Pure Value Index. The fund is heaviest on consumer discretionary (20.21%) and financials (18.62%). RZV selects holdings based on P/E, P/B, and P/S ratios.
IJS has a 10-year compound annual growth rate, or CAGR, of 7.97%. By comparison, VBR has a 10-year CAGR of 8.53%, SLYV has a 10-year CAGR of 7.83%, and RZV has a 10-year CAGR of 6.64%. Of note, all of these are lower than the S&P 500 Index 10-year CAGR of over 12%.
10-Year Total Price Return for Top Small-Cap Value ETFs (Seeking Alpha)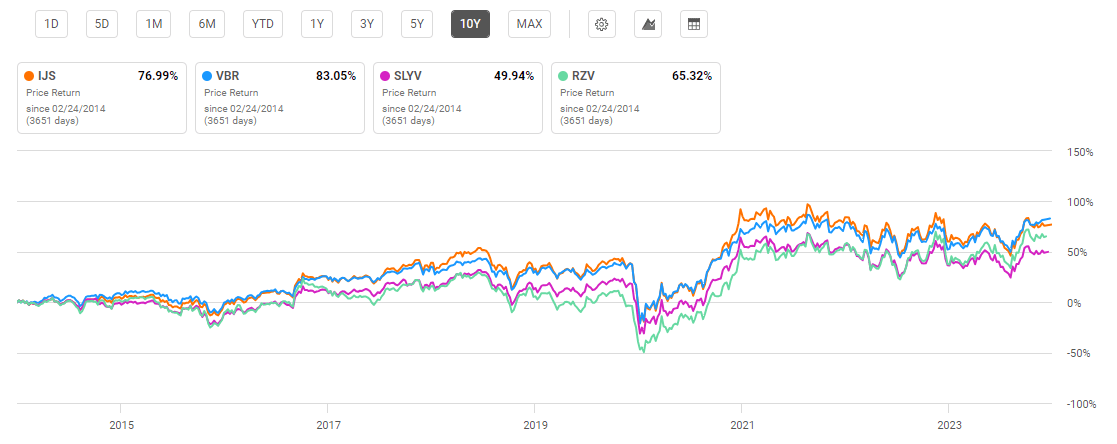
However, small caps have not always underperformed the broader market. In fact, as illustrated below, the rolling average for small caps is superior over a very long time period. Given the macroeconomic conditions this year, including the expected reduction in interest rates, I argue that small caps are due for a comeback. Additionally, small-cap advocates would also argue that their greatest strength is additional "room to grow" over large caps. Therefore, the first reason to consider small-cap holdings is their historic long-term performance.
Small Cap Historic Outperformance (Furey Research Partners, www.brownadvisory.com)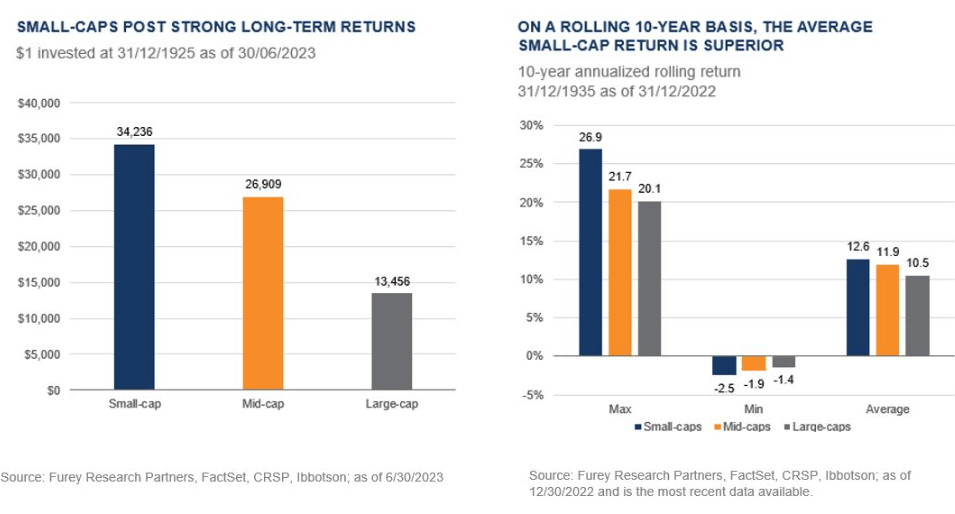
If you are convinced that small-cap value holdings could be a good opportunity looking forward, let's now look at IJS in comparison to some peer ETFs. In addition to lagging VBR in performance, IJS's expense ratio and dividend yield are also less desirable. With an expense ratio of 0.18%, IJS is less expensive than RZV, but notably higher than VBR. Finally, while dividend yield is not a substantial factor, IJS also lags VBR with a dividend yield of 1.48% compared to 1.62% for VBR. Therefore, while I am personally taking a strong look at small-cap value funds for investment, IJS is not the top contender in my mind.
Expense Ratio, AUM, and Dividend Yield Comparison
IJS | VBR | SLYV | RZV | |
Expense Ratio | 0.18% | 0.07% | 0.15% | 0.35% |
AUM | $6.92B | $50.59B | $3.88B | $249.25M |
Dividend Yield TTM | 1.48% | 1.62% | N/A | 1.18% |
Dividend Growth 5 YR CAGR | 4.90% | 1.75% | N/A | 0.62% |
Source: Seeking Alpha, 23 Feb 24
Similar to other small-cap value ETFs compared, IJS is highly diversified with 500 holdings. Due to this high diversification, each fund has a low cumulative weight on their top 10 holdings. For example, IJS only has a combined 9.0% weight on its top 10 holdings.
Top 10 Holdings for IJS and Compared Small-Cap ETFs
IJS - 500 holdings | VBR - 856 holdings | SLYV - 459 holdings | RZV - 145 holdings |
XTSLA - 1.87% | BLDR - 0.74% | ASO - 0.94% | JBLU - 1.94% |
ASO - 0.94% | BAH - 0.63% | ALK - 0.91% | XRX - 1.80% |
ALK - 0.91% | RS - 0.56% | COOP - 0.87% | FL - 1.71% |
COOP - 0.86% | IEX - 0.55% | OGN - 0.85% | KELYA - 1.67% |
OGN - 0.85% | ATO - 0.54% | LNC - 0.83% | WKC - 1.65% |
DXC - 0.74% | FCNCA - 0.53% | DXC - 0.74% | PHIN - 1.58% |
LNC - 0.74% | CSL - 0.53% | CYTK - 0.74% | FDP - 1.56% |
CYTK - 0.74% | JBL - 0.52% | MDC - 0.68% | UNFI - 1.56% |
MDC - 0.68% | BG - 0.49% | MAC - 0.67% | KSS - 1.45% |
MAC - 0.67% | RPM - 0.47% | JXN - 0.67% | BFH - 1.34% |
Source: Multiple, compiled by author on 23 Feb 24
Despite this relative low weight on top holdings, IJS has distinct advantages and disadvantages in its heaviest holdings compared to other small-cap value ETFs. An example of a negative holding for IJS is Alaska Air Group, Inc. (ALK). However, IJS has several stronger holdings, including Mr. Cooper Group Inc. (COOP). These holdings are discussed in further detail below.
The first concerning holding for IJS is Alaska Air Group. While ALK has a forward P/E ratio of just 9.36, 50.2% below its sector median, the company has had challenges with profitability. For instance, Alaska Air Group reported a net loss for Q4 '23 of $2 million. Additionally, the company has demonstrated a net income margin of just 2.25%. While it has been growing with a 13.38% YoY EBITDA growth, Alaska Air's lack of consistent profitability is troublesome for this #3 holding. As a result, ALK has seen a one-year price return of -19%. Alaska Air is representative of other holdings within IJS that may display an attractive P/E but lack solid fundamentals.
While ALK is a concerning top holding for IJS, there are also bright spots within its top holdings. One example is Mr. Cooper Group. COOP has two primary business segments: mortgage servicing and mortgage originations. These two major segments offer the company with diversification, allowing it to sustain profitability in the event of inevitable interest rate fluctuations. This profitability has been demonstrated with a net income margin of 26.88%. Additionally, COOP demonstrates a forward EBITDA growth of 41.35%, significantly higher than its sector. Despite these strong metrics, Mr. Cooper has a forward P/E of 8.25, 22% lower than its sector median. Therefore, COOP is representative of a solid holding for IJS looking forward.
IJS has a current price of $98.95 at the time of writing this article. This price is in the upper half of its 52-week range of $81.81 to $105.10 and below its all-time high of $110.47 seen back in November 2021. Over the past year, IJS has seen negative performance. Comparatively, VBR has significantly outperformed with a 6.84% price return.
One Year Price Return: IJS and Peer Small-Cap Value ETFs (Seeking Alpha)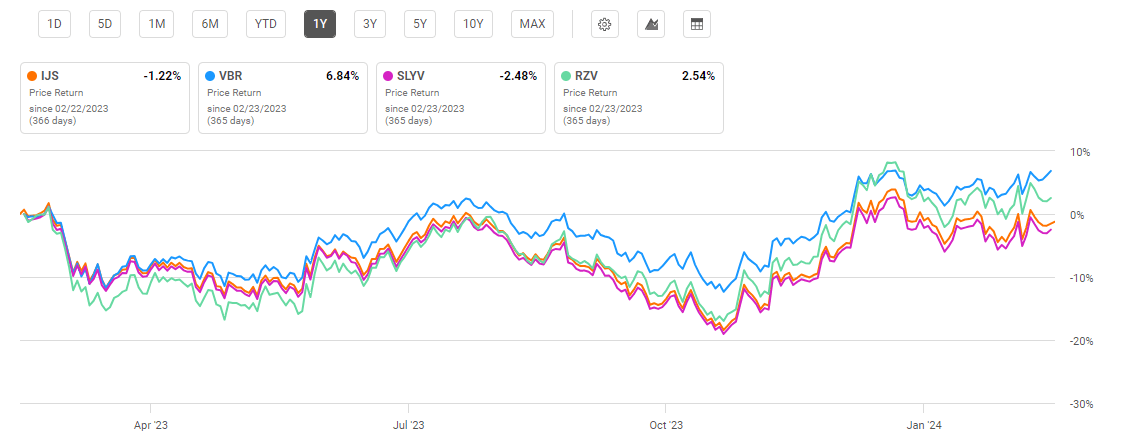
Using price-to-earnings and price-to-book ratios, one can examine the valuation of IJS in comparison to its small-cap ETF peers. Looking at these metrics, IJS has the lowest P/E ratio at 12.26. By comparison, Vanguard's S&P 500 ETF (VOO), a popular S&P 500 Index ETF, has a P/E ratio of 24.2. Therefore, the second reason to consider small cap currently is its comparatively attractive value.
Valuation Metrics for IJS and Peer Competitors
IJS | VBR | SLYV | RZV | |
P/E ratio | 12.26 | 12.7 | 12.51 | 12.92 |
P/B ratio | 1.24 | 1.7 | 1.26 | 0.83 |
Source: Compiled by Author from Multiple Sources, 23 Feb 24
Despite IJS's relatively favorable valuation in comparison to other small-cap value funds, it lacks a sufficient number of strong holdings to propel the fund ahead of its peers. Therefore, while there are multiple potential tailwinds for small-cap stocks and ETFs looking forward, IJS will likely continue to lag peer funds, particularly VBR.
Small-cap funds are notoriously more sensitive than large caps. This is true both in recoveries and recessionary periods. This volatility can be measured by looking at each fund's beta value. IJS has a 5-year beta value of 1.19. By comparison, VBR has a 5-year beta of 1.15 and SLYV has a beta value of 1.19. These beta values greater than 1.0 imply greater volatility than "the market" overall. Therefore, investors in small-cap funds should expect a fair amount of volatility.
The expected reduction of interest rates is the third reason to consider small-cap value. Most economists are expecting the Federal Reserve to reduce interest rates starting in mid-2024. Reduced interest rates represent an opportunity for smaller companies to increase their borrowing, facilitating greater growth and expansion. Interestingly, small-cap stocks beat large cap in 2016, an election year. This performance was thought to be due to expected tax cuts and reduced regulation. With another election year looming and the anticipated reduction in interest rates, small cap could have another good year in 2024. While the S&P 500's performance in 2016 was 11.96%, the S&P 600's performance was 24.72%.
There are three major factors making small-cap value attractive for the remainder of 2024. The first is small cap's strong historic performance. While mega-cap, big tech stocks have propelled the NASDAQ and S&P 500 Indexes to record highs, small caps have been relatively overlooked. This could prime small-cap value funds for a strong comeback. Therefore, the second key factor to consider small-cap value is its current valuation, which is comparatively very attractive. The third reason to consider small-cap value is the widely expected reduction of interest rates in mid-to-late 2024. While these three factors make small-cap value a category for investors to consider, IJS fails to shine as the best small-cap value fund. There are other ETFs, particularly VBR, that have lower expense ratios, better track records of performance, and higher dividend yields. Therefore, although small-cap value is postured for a strong year looking ahead, IJS does not warrant a buy rating currently.