
Userba011d64_201
Userba011d64_201
Vanguard S&P Mid-Cap 400 Growth Index Fund ETF Shares (NYSEARCA:IVOG) started investing operations on 09/07/2010 and tracks the S&P Mid-Cap 400 Growth Index. It has 244 holdings, a dividend yield of 0.94%, and an expense ratio of 0.15%. The same portfolio is available as a mutual fund (VMFGX). It tracks the same index as iShares S&P Mid-Cap 400 Growth ETF (IJK) and SPDR S&P 400 Mid Cap Growth ETF (MDYG).
As described by S&P Dow Jones Indices, S&P 400 constituents are ranked in Value and Growth styles using three valuation ratios and three growth metrics. The valuation ratios are book value to price, earnings to price and sales to price. The growth metrics measure sales growth, earnings growth, and momentum. By construction, 33% of the parent index constituents exclusively belongs to each style, and 34% belongs to both styles. The growth style subset serves as S&P 400 Growth Index and is rebalanced annually. It is capital-weighted, with an adjustment for constituents belonging to both styles. For example, a company with a Value rank better than its Growth rank is given a larger weight in the Value Index than in the Growth Index. The fund's turnover rate in the most recent fiscal year was 48%.
This article will use as a benchmark the parent index S&P Mid-Cap 400, represented by iShares Core S&P MidCap ETF (IJH).
The heaviest sector in the portfolio is industrials (29.6% of asset value), followed by consumer discretionary (18.9%) and technology (13.3%). Other sectors are below 10%. Compared to the parent index, IVOG significantly overweights industrials and underweights mostly financials.
IVOG sector breakdown (Chart: author; data: Vanguard, iShares)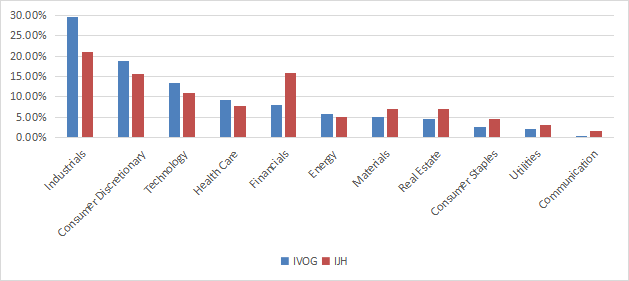
The top 10 holdings, listed in the next table with growth metrics, represent 12.6% of asset value. The top name weighs less than 2%, so risks related to individual companies are low.
Ticker | Name | Weight% | EPS growth %TTM | EPS growth %5Y | Sales Growth %TTM | Sales Growth %5Y |
Super Micro Computer, Inc. | 1.91% | 21.66 | 66.82 | 39.22 | 16.21 | |
Deckers Outdoor Corp. | 1.51% | 50.62 | 40.16 | 15.63 | 13.67 | |
Reliance Steel & Aluminum Co. | 1.28% | -24.15 | 20.95 | -13.03 | 5.12 | |
Carlisle Cos., Inc. | 1.19% | -22.78 | 21.40 | -22.75 | 0.48 | |
GoDaddy, Inc. | 1.17% | 336.37 | 84.95 | 3.78 | 9.83 | |
Manhattan Associates, Inc. | 1.16% | 38.77 | 12.35 | 21.07 | 10.68 | |
Graco, Inc. | 1.12% | 10.32 | 8.36 | 2.43 | 5.84 | |
Lennox International, Inc. | 1.07% | 18.99 | 13.61 | 5.58 | 5.11 | |
Neurocrine Biosciences, Inc. | 1.07% | 57.75 | 62.04 | 26.76 | 33.13 | |
Vistra Corp. | 1.07% | 450.87 | N/A | -3.27 | 27.09 |
As expected from the methodology, IVOG is more expensive than the benchmark regarding valuation ratios and has better growth metrics (reported in the next table). The gap in cash flow growth is especially impressive, although it is not a factor used by the strategy.
IVOG | IJH | |
P/E TTM | 18.86 | 15.87 |
Price/Book | 3.79 | 2.3 |
Price/Sales | 2.22 | 1.32 |
Price/Cash Flow | 12.3 | 10.45 |
Earnings growth | 25.59% | 19.85% |
Sales growth % | 10.71% | 8.11% |
Cash flow growth % | 24.25% | 11.92% |
Data source: Fidelity.
In my ETF reviews, risky stocks are companies with at least 2 red flags among: bad Piotroski score, negative ROA, unsustainable payout ratio, bad or dubious Altman Z-score, excluding financials and real estate where these metrics are unreliable. With this assumption, risky stocks weigh 14.7% of asset value: it is acceptable, but not really good. However, according to the calculation of aggregate quality metrics (reported in the next table), portfolio quality is significantly superior to the mid-cap benchmark.
IVOG | IJH | |
Altman Z-score | 6.50 | 3.15 |
Piotroski F-score | 6.01 | 5.58 |
ROA % TTM | 9.58 | 5.18 |
Since 10/1/2010, IVOG is on par with IJH. The gap of 13 bps in annualized return is immaterial. As reported below, risk metrics (maximum drawdown and volatility) are a bit lower than for the benchmark.
Total Return | Annual Return | Drawdown | Sharpe ratio | Volatility | |
IVOG | 339.99% | 11.69% | -39.32% | 0.64 | 16.85% |
IJH | 332.74% | 11.56% | -42.18% | 0.63 | 17.46% |
The growth fund has outperformed by almost 8% over the last 12 months:
IVOG vs IJH, last 12 months (Seeking Alpha)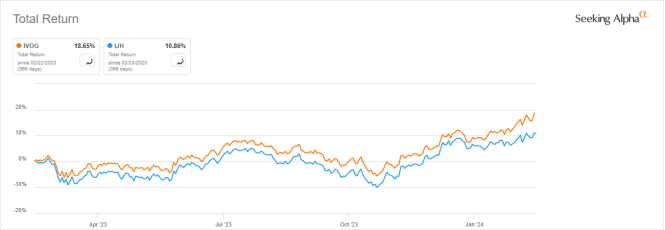
The next table compares characteristics of IVOG and five mid-cap growth ETFs with different methodologies:
IVOG | VOT | IMCG | NUMG | JSMD | FNY | |
Inception | 9/7/2010 | 8/17/2006 | 6/28/2004 | 12/13/2016 | 2/23/2016 | 4/19/2011 |
Expense Ratio | 0.15% | 0.07% | 0.06% | 0.31% | 0.30% | 0.70% |
AUM | $997.28M | $22.72B | $2.09B | $384.56M | $330.59M | $308.31M |
Avg Daily Volume | $2.51M | $34.23M | $11.92M | $1.49M | $1.30M | $1.08M |
Number of Holdings | 247 | 153 | 310 | 59 | 257 | 226 |
Assets in Top 10 | 12.57% | 16.28% | 11.11% | 29.27% | 27.28% | 8.65% |
Turnover | 48.00% | 22.00% | 43.00% | 100.00% | 91.00% | 142.00% |
Regarding 5-year total returns, plotted on the next chart, IVOG performance is average among peers. The best performer is IMCG, which has a lower fee and more liquidity. IVOG is also behind VOT, a larger, older and cheaper (in fee) Vanguard fund tracking the CRSP US Mid Cap Growth Index.
IVOG vs competitors, 5-year return (Seeking Alpha)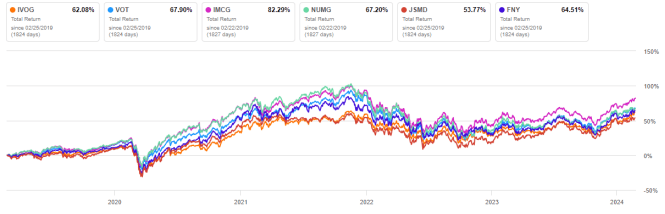
However, IVOG is the best performer in 2024 to date:
IVOG vs competitors, year-to-date (Seeking Alpha)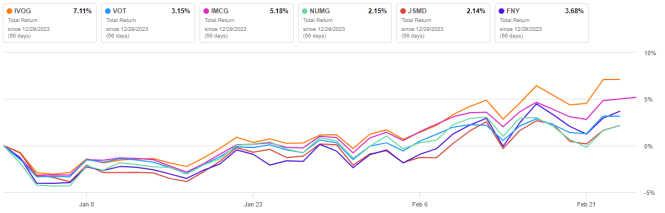
Vanguard S&P Mid-Cap 400 Growth Index Fund ETF Shares uses sales growth, earnings growth, and momentum to select stocks in the S&P Mid-Cap 400 Index. It tracks the same index as IJK and MDYG. The portfolio is overweight in industrials, but well diversified across holdings. Not only growth metrics, but also quality metrics are superior to the benchmark.
Nevertheless, Vanguard S&P Mid-Cap 400 Growth Index Fund ETF Shares historical performance is similar to the benchmark, meaning the methodology has failed to bring significant long-term excess return over the parent index. IVOG has outperformed a number of competitors in 2024, but its 5-year performance is average. It is behind IMCG and VOT, two ETFs charging lower fees.