
akinbostanci/iStock via Getty Images
akinbostanci/iStock via Getty Images
The Invesco S&P 500 Equal Weight ETF (NYSEARCA:RSP) has an impressive 21-year track record and has outperformed the SPDR S&P 500 ETF (SPY) by 0.42% since its April 2003 launch. Due to its weighting scheme, Magnificent Seven exposure is less than 1.5%, so it is a reasonable approach for diversifying and possibly minimizing risk. However, what's not evident is how much quality investors sacrifice by going the equal-weight route. For example, free cash flow and net margins are 5-6% lower, and debt-equity ratios are 0.16 points higher. Though I understand the logic of equal-weighting the Index and agree that SPY has too much Magnificent Seven exposure, it's evident that RSP has too little. Therefore, I rate RSP a "sell," and I will present an excellent alternative that passed four crucial screens for you to consider instead.
RSP tracks the S&P 500 Equal Weight Index, providing greater exposure to smaller companies in the S&P 500 Index while still following the same eligibility requirements, which, for new entrants, include positive earnings in the most recent quarter and positive one-year trailing earnings. RSP features a 0.20% expense ratio, a 1.61% twelve-month distribution yield, and $49 billion in assets since its launch on April 24, 2003.
The Magnificent Seven stocks are Microsoft (MSFT), Apple (AAPL), Nvidia (NVDA), Alphabet (GOOGL), Amazon (AMZN), Meta Platforms (META), and Tesla (TSLA), and comprise 28.68% of SPY. They dominated equity markets last year and powered SPY to a 26.19% gain, and understandably, many investors are looking for ways to decrease their exposure out of fear of a sharp pullback. RSP's equal approach offers that with just 1.40% exposure at each quarterly rebalancing (0.20% per stock).
The approach has some merit. Since May 2003, RSP has outperformed SPY by 0.42% per year, albeit with greater volatility and weaker risk-adjusted returns (Sharpe and Sortino Ratios).
Portfolio Visualizer
However, the five-year rolling return chart reveals this outperformance primarily occurred for the five years ending February 2012.
Portfolio Visualizer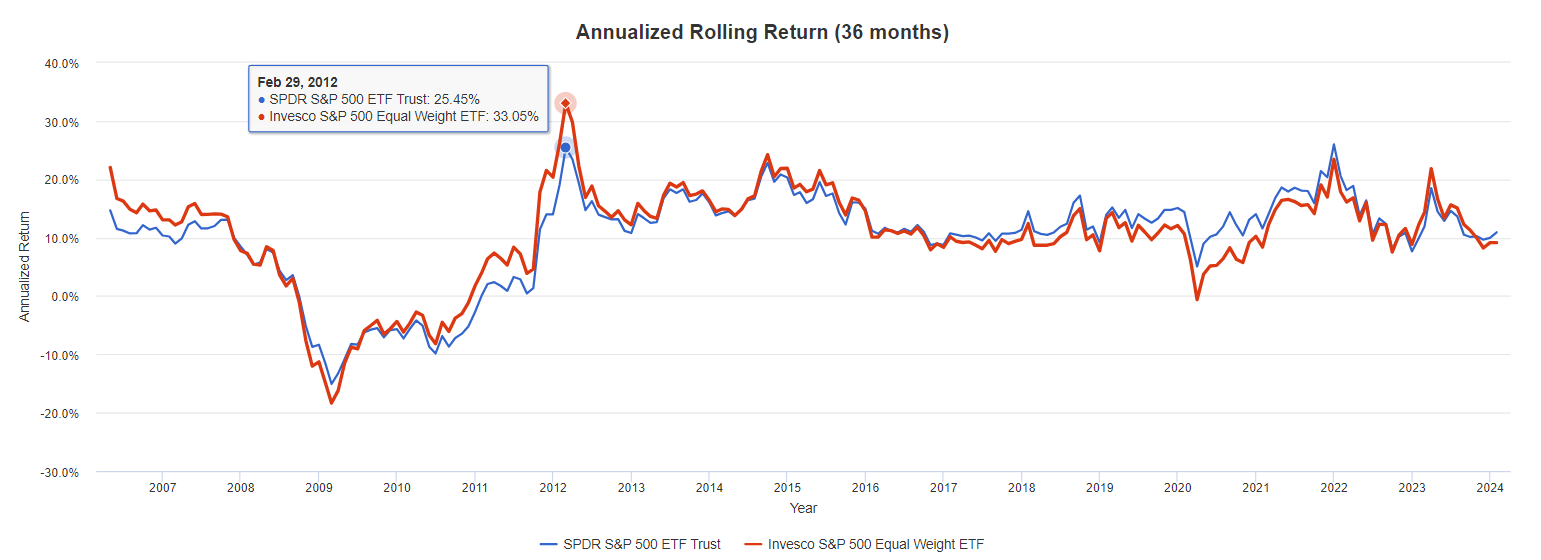
Indeed, RSP outperformed SPY by 18.28% in 2009, when speculative, less profitable stocks made exceptional gains. To demonstrate, according to tables provided at the Ken French Data Library, an equal-weight portfolio of the 20% least-profitable stocks gained 86.06% in 2009 compared to 51.94% for the remaining 80%. The story was similar for value-weighted portfolios (40.53% vs. 26.98%), and I want to emphasize that low-profitable stocks outperforming is not the expected result. For the equal-weighted approach, it's happened 5/20 times over the last two decades (2004-2023) and 8/20 times on the value-weighted side.
You may be wondering why I've emphasized profitability so much. After all, RSP is comprised of profitable stocks because the S&P 500 Index Committee requires it for new entrants. A glance at the statistics for S&P 500 stocks confirms that only 33/500 had negative net margins over the last year, and only three have negative EBITDA margins (MRNA, WDC, NRG). RSP isn't exactly a "low-quality" ETF and is undoubtedly far from the 20% least profitable group mentioned earlier. Still, I want to highlight how there are significant differences in profitability as we move through the S&P 500 Index. In the table below, I've listed various average profitability metrics for 30 sub-industries and their respective weights in RSP and SPY. For simplicity, refer to the profit scores, derived from individual Seeking Alpha Factor Grades.
The Sunday Investor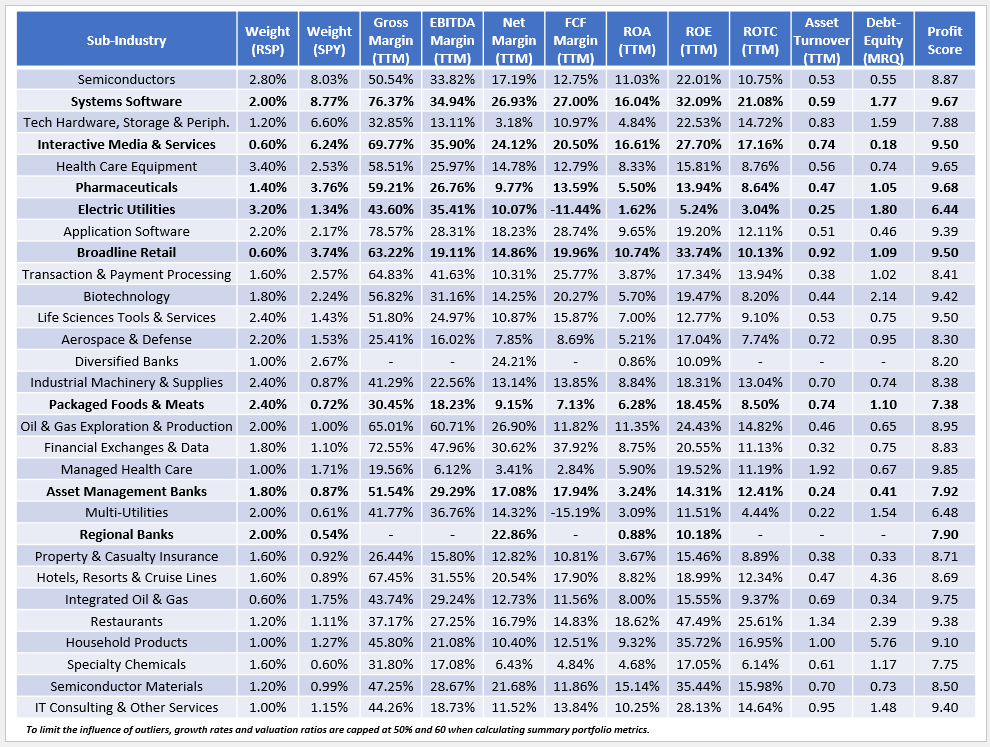
I've bolded the sub-industries where RSP's composition is less favorable. Here's a summary of the first three:
1. RSP underweights Systems Software stocks by 6.77% (2.00% vs. 8.77%). The leading stock is Microsoft (MSFT), with a 10/10 profit score. Still, others like Adobe (ADBE), Oracle (ORCL), Palo Alto Networks (PANW), Fortinet (FTNT), and VeriSign (VRSN) also have perfect scores. While allocating 7.15% to Microsoft might be excessive, this is a sub-industry I want more exposure to, and RSP's 2.00% isn't sufficient.
2. RSP underweights Interactive Media & Services stocks by 5.64% (0.60% vs. 6.24%) by assigning equal weight to Alphabet, Meta Platforms, and Match Group (MTCH). Free cash flow margins for the two Magnificent Seven stocks are excellent, and they've averaged a 175% price return over the last five years. Again, I understand the desire to reduce exposure, but I also don't see the need to boost Match Group's exposure, a stock that's declined by 36% over the last five years, from 0.02% to 0.20% each quarter.
3. There are seven Pharmaceutical stocks in the S&P 500 Index: Eli Lilly (LLY), Johnson & Johnson (JNJ), Merck & Co. (MRK), Pfizer (PFE), Zoetis (ZTS), Viatris (VTRS), and Catalent (CTLT). All but Catalent have perfect 10/10 profit scores. In SPY, total combined exposure is 3.76%, and the four largest have five-year betas well below one, indicating less market volatility. Given these statistics, this is a sub-industry I want to lean into, not avoid. Besides, an equal-weight portfolio of these seven stocks, rebalanced quarterly, easily outperformed RSP since CTLT began trading in July 2014 and even beat SPY on total and risk-adjusted returns.
Portfolio Visualizer
There's also a clear downward trend in profitability as you scan through the S&P 500 Index. Those in the top 150 are generally solid, with 132 (88%) having an "A" Grade or better. However, that's only valid for 32 stocks (21%) in the bottom 150. This distribution makes sense, as the most profitable companies tend to rise to the top.
Of course, profitability isn't the only factor that matters. RSP has clear diversification benefits, and smaller companies might be cheaper and offer more significant growth potential. To assess this, consider the table below highlighting selected fundamental metrics for RSP's top 25 sub-industries, totaling 48.40%. That's about 20% less than SPY.
The Sunday Investor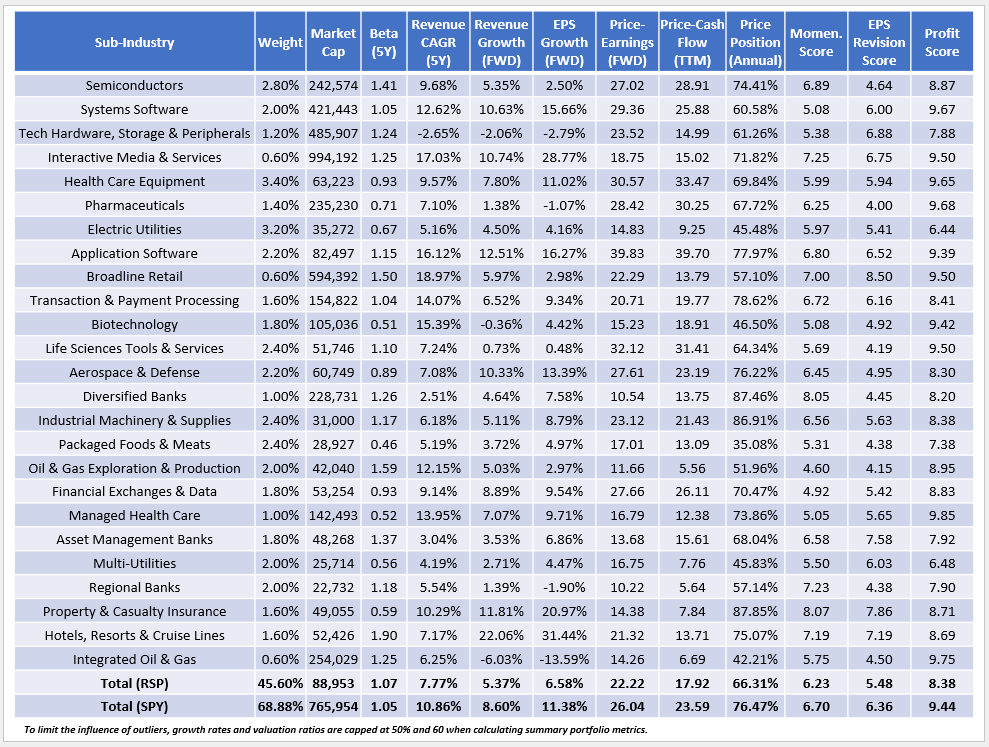
A few observations:
1. SPY's higher estimated sales and earnings growth rates of 8.60% and 11.38% reflect how the mega-caps still offer the best growth potential among S&P 500 Index stocks. SPY's earnings growth figure ranks #177/610 among all Size & Style ETFs I track compared to #365/610 for RSP. The reality is that SPY's growth rate is relatively strong, but if you want more without adding Magnificent Seven exposure, dedicated mid-cap growth ETFs are probably your best solution. Here are the average EPS growth rates for the nine Size and Style ETFs in my database.
2. RSP trades at 22.22x forward earnings and 17.92x trailing cash flow, or about 4-6 points cheaper on a weighted average basis. That's not enough of a discount for the growth and quality sacrifices. From a GARP perspective, RSP's price-earnings-growth ratio is 3.38 (22.22x / 6.58%), while SPY is much more attractive at 2.29 (26.04x / 11.38%), so a bet on RSP heavily depends on price multiple compressions, the timing of which is very challenging to predict.
3. RSP has a 5.48/10 EPS Revision Score compared to 6.36/10 for SPY, indicating Wall Street analysts are far more bullish on the larger companies in the S&P 500 Index. Still, recent sales and earnings surprise figures are relatively weak across the board. Historically, quarterly sales and earnings surprises were between 1-2% and 5-6%, respectively, and while SPY is within that range (1.23% / 5.66%), RSP is a bit worse off at 0.31% and 6.23%.
I agree that SPY's allocation to Magnificent Seven stocks is too high, but at the same time, RSP's is too low. A compromise is required, where exposure to these stocks is between 10-20%, but there are a few things I want to maintain. I've listed and explained them briefly below.
1. Minimum 9.10/10 profit score, which I previously determined to be the minimum before performance noticeably declines.
2. A growth/valuation combination at least as good as the average of SPY and RSP (2.84 price-earnings-growth ratio).
3. An EPS Revision Score at least as good as the 5.92/10 average between SPY and RSP. This should screen out many value ETFs whose prices are depressed because companies aren't performing well.
4. A below-average expense ratio (0.38%) and at least $1 billion in assets under management.
I must be too picky because only two ETFs passed these four screens:
I'm familiar with both, but let's add them to a comparison table with RSP and SPY to identify their strengths and weaknesses.
The Sunday Investor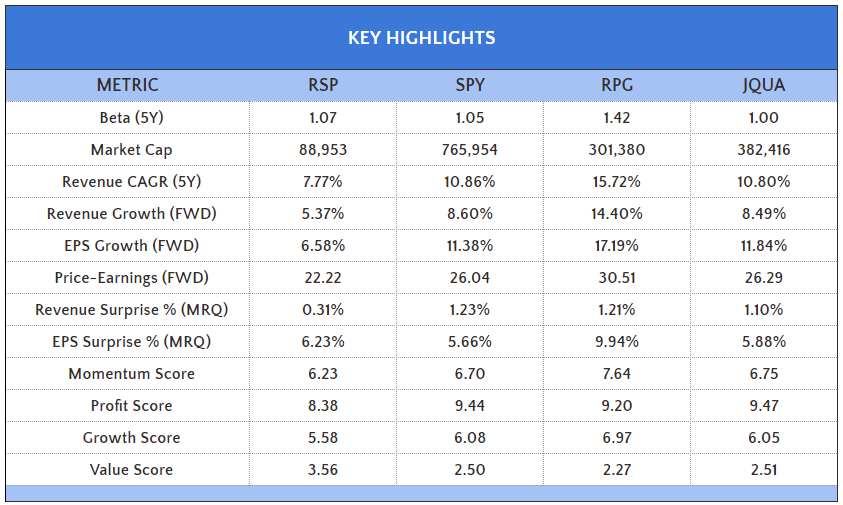
A few quick notes:
1. RPG and JQUA have 12.94% and 11.34% exposure to the Magnificent Seven stocks, respectively. Profit scores meet my 9.10/10 minimum score, and the weighted-average market capitalization figures confirm less reliance on mega-cap stocks.
2. JQUA and SPY have nearly identical growth/valuation combinations, but JQUA does it with less than half the Magnificent Seven exposure. RPG trades at an expensive 30.51x forward earnings, but it's at least partially justified with its 17.19% estimated earnings growth rate.
3. RPG has a high 1.42 five-year beta and has only 58 stocks across 31 unique GICS sub-industries. These aren't standard features for core holdings, so I firmly believe JQUA is the best option. You can read my latest analysis here.
RSP provides an equal-weight approach to S&P 500 Index stocks and allows investors to avoid concentration risk specific to Magnificent Seven stocks. However, this strategy sacrifices quality and results in an inferior growth and valuation combination, leading me to believe the equal weight strategy is not optimal. Instead, I recommend JQUA, as it has many features that make SPY a high-quality fund but with less than half the exposure to Magnificent Seven stocks. A compromise is the best solution, so I've rated "RSP" a sell and JQUA a "buy," and I hope you'll read more about that solidly built ETF at the link above. Thank you for reading, and I look forward to your comments below.