RLTY: A Discounted CEF Providing Exposure To Beaten Down REITs
Summary
- The Cohen & Steers Real Estate Opportunities and Income Fund is trading at an attractive discount and provides exposure to the beaten-down real estate sector.
- The fund had a tough time shortly after its launch, but 2023 was much more kind to the fund, and the future looks brighter as well.
- RLTY's distribution rate comes to an attractive 9.32%, which is paid monthly to investors.
Khanchit Khirisutchalual
Written by Nick Ackerman, co-produced by Stanford Chemist.
Cohen & Steers Real Estate Opportunities and Income Fund (NYSE:RLTY) is trading at an attractive discount in the real estate sector, and it is also trading at attractive valuations. Real estate investments trust and preferred, which RLTY is invested in, took a significant hit when interest rates and yields rose. That caused rates for borrowings to rise, which is one of the main ways that REITs can use to grow.
Similarly, RLTY is also a leveraged closed-end fund that pays borrowings based on a floating rate. Therefore, this fund saw its own borrowing costs increase as well. However, a good portion of its borrowings were hedged with interest rate swaps.
With rates expected to be cut later this year and risk-free Treasury Rates that could also decline, that should bode well for the REITs and preferred portfolio that RLTY holds. RLTY's borrowings are still largely fixed for another 2 years, which should give them enough time to see interest rates move down materially from where they are now - at least based on the latest projections and expectations.
Since our last update, the fund's total returns haven't done too much. It was mostly flat while the S&P 500 Index continued to rise higher on its march.
RLTY Performance Since Prior Update (Seeking Alpha)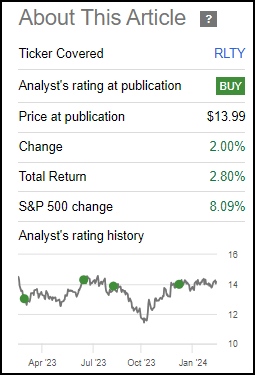
Real estate, at the time of this writing, is the only sector down in 2024 so far. It was joined by utilities, but it looks like those were able to slip into positive territory more recently. Therefore, seeing RLTY basically flat isn't a huge surprise during this time.
Sector Performance YTD Through March 8th (Seeking Alpha)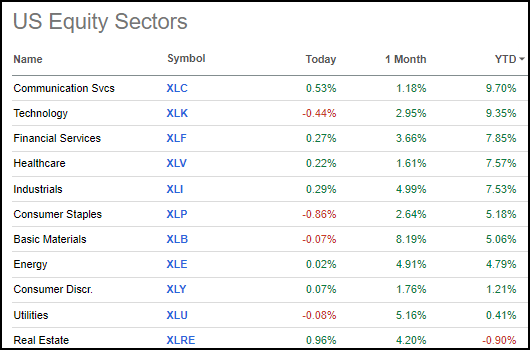
RLTY Basics
- 1-Year Z-score: 0.39
- Discount: -11.50%
- Distribution Yield: 9.32%
- Expense Ratio: 1.74%
- Leverage: 35.42%
- Managed Assets: $415 million
- Structure: Term (anticipated liquidation date February 23, 2034)
RLTY's investment objective is "high current income." The secondary objective is for "capital appreciation." To achieve this, the fund will invest "at least 80% of its managed assets in (i) real estate-related investments, and (ii) preferred and other income securities." This is pretty straightforward and quite similar to Cohen & Steers' other real estate-focused funds.
RLTY's expense ratio was 1.74% as of its last annual report. However, when including leverage expenses, the fund's expense ratio is 3.26%-up from 2.13% in the last partial fiscal year. That said, what isn't reflected is the fund's fixed-rate financing thanks to the interest rate swaps. The costs of the borrowings are still showing an increase, but that is made up on the capital gains side through these swaps. Nearly 90% of the fund's leverage is fixed for this reason.
RLTY Leverage Stats (Cohen & Steers)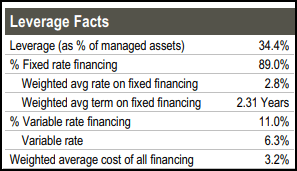
Performance - Discount Still Has Appeal
RLTY isn't as discounted as it once was, but the current discount is still substantial. I believe that it is quite appealing as well, as its sister funds trade at narrower discounts relative to RLTY. In fact, the Cohen & Steers REIT and Preferred and Income Fund (RNP) has seen its discount move to a premium.
YCharts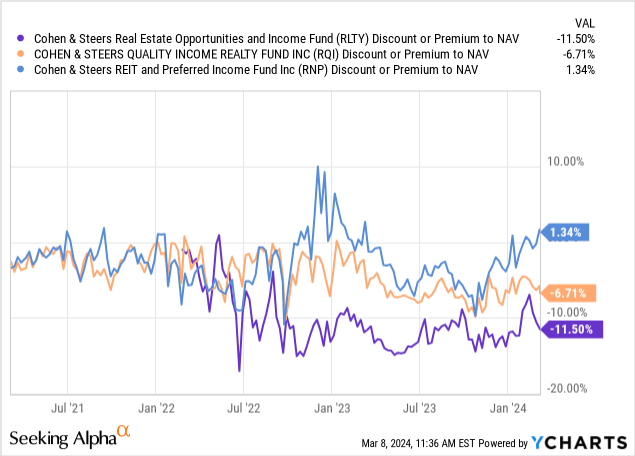
RLTY has traded at a deeper discount relative to its sister funds basically since its launch or shortly thereafter. The fund's higher leverage ratio and higher expense ratio could be some of the culprits. There is also no guarantee that the fund's discount will narrow anytime soon to reach the same valuations that its sister funds will. Though more recently, the fund made a sharp move higher in terms of narrowing that discount. It came to nearly the same level as RQI's discount before widening back out significantly.
The fund is also a term fund with an expected termination date. As it isn't until 2034, we have plenty of time before that becomes a factor, but it should mean that-at some point in the future-the fund's discount can be realized.
Further, these funds aren't exactly identical despite some considerable overlap. When we originally covered RLTY, we noted that it was the "in-between" fund. This was because RLTY runs with a common and preferred portfolio split of 70/30%. RNP is at around 50/50, and Cohen & Steers Quality Income Realty Fund (RQI) tends to be around 80/20%.
Even with these differences, the fund's total NAV returns over the last year were quite close. RLTY was the weakest, and that could be the higher expense ratio at play. On the other hand, the fund's total share price returns still came out on top due to some discount narrowing through this time.
YCharts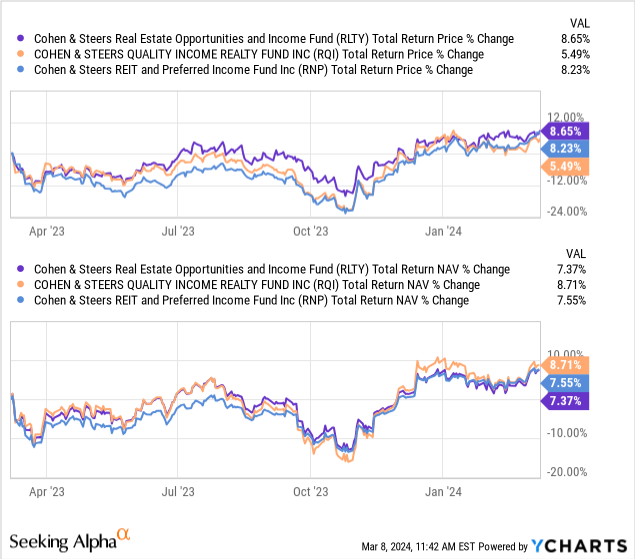
RLTY won't be the only fund that benefits from a lower-rate environment. RQI and RNP will similarly perform well. Over the last year, we can already see that performance was a bit more promising-and all three of these funds rallied significantly from the October lows in 2023. That's a good reflection of what can happen when risk-free rates fall.
The REITs and preferred in RLTY's portfolio would both benefit from lower Treasury Rates because they would become more attractive income alternatives once again. The Fed cutting its own target rate will see more opportunities for growth to open up in the underlying REITs as borrowing costs should decline, and particularly those that are paying floating rate-based rates currently should see some immediate relief.
Of course, that means the converse is also the risk for these funds as well. If rates need to increase or risk-free rates start to surge again, we'd see RLTY, along with its sister funds, fall. Being that these are leveraged funds, the falls would be that much more dramatic. The positive note is that with RLTY already having the widest discount, further significant discount widening could be fairly muted. It would be RNP that looks like it is set up for the greatest fall if it were to return back to discount territory.
Distribution - Attractive 9.32% Monthly Distribution
Despite the tougher environment for the fund's underlying portfolio, they raised their distribution last year. It went from a $0.1040 monthly distribution to $0.11, which is still the current level they are maintaining.
RLTY Distribution History (CEFConnect)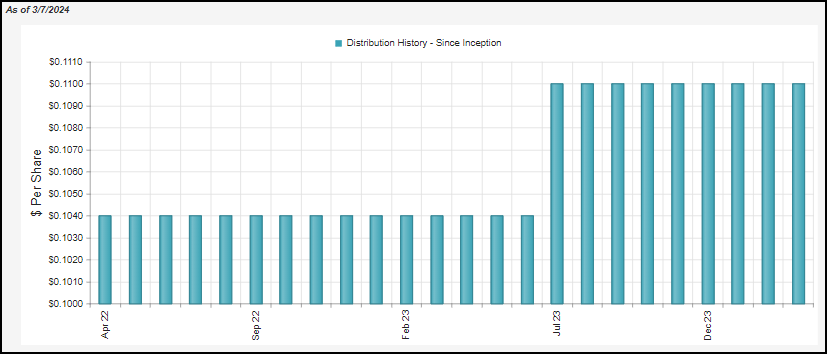
This distribution increase really didn't seem warranted, but we are also at an 8.25% NAV distribution rate. So we definitely aren't in red flag territory either based on that rate, in my opinion.
REITs and preferreds performing well going forward will also play a big role in the fund's distribution as well. That's because, like most equity-heavy funds, they will rely on capital gains to fund their distributions. For RLTY, NII coverage last year came to just 15.73%. For some context, RQI's NII coverage comes to 21.9%.
RLTY Annual Report (Cohen & Steers)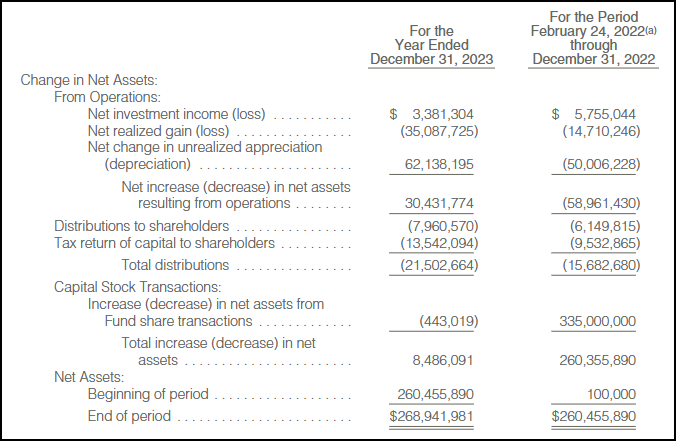
Despite 2022 being a partial period for the fund, the NII through that period was $0.40 per share, and that has now dropped to $0.20. That reflects some portfolio changes, but a significant factor would be the higher borrowing costs. However, as we noted above, where it was made up was taking in some gains from their interest rate swaps.
RLTY Realized/Unrealized Gains/Losses (Cohen & Steers (highlights from author))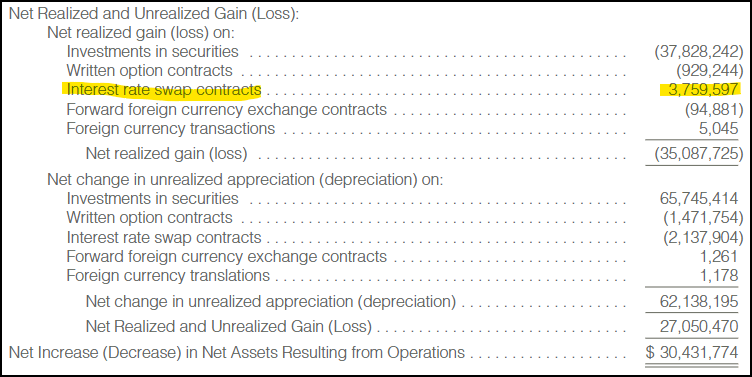
We can also see from the above that NAV increased through the year thanks to the unrealized appreciation in the portfolio. That was enough to offset the realized losses that the managers took through the year.
That's an important note because that's the sort of move that will result in the return of capital characterizations of the distribution.
RLTY Distribution Tax Classification (Cohen & Steers)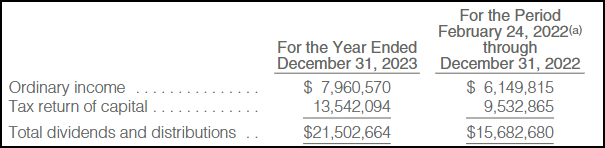
That's something we outlined previously regarding RLTY and its sister funds, RQI and RNP. Those funds have been around longer and had more embedded capital gains that they could rely on to realize capital gains. For RLTY, they launched in 2022, right when the market was taking a tumble and never got the opportunity to see those unrealized gains really materialize. Instead, they just took on a boatload of realized and unrealized losses. At the end of 2023, they were still sitting on nearly $52 million of carryforward losses. That can be used to offset realized gains in the future and keep return of capital distributions coming for several years.
At the same time, last year, the NAV rose. The fund's total NAV returns for 2023 came to over 12%. Therefore, it's always a good reminder to watch the NAV for distribution coverage rather than the tax character. Taxes are, of course, quite important. However, they are more important for tax consequences and the impacts they'll have when you file your taxes. They are not usually a good sign when trying to tell distribution coverage.
This is one of the other things I have seen mentioned when covering RLTY, so I feel it is important to continue to outline and show what is going on here on the tax characterization front. This could be another reason why RLTY also trades at a wider discount relative to its sister funds, which wouldn't seem to be an appropriate reason. ROC distributions can actually be quite beneficial as they aren't taxed in the year received; instead, they reduce an investor's cost basis. That means no taxes are potentially due until the position is sold.
RLTY's Portfolio
The fund's 70/30% split between common and preferred/fixed-income holdings is only a slight change from the 67/33% weighting that the fund carried in our prior update. In total, they've listed 175 positions for the fund-up only slightly from the 173 holdings previously.
Another common characteristic is that besides what seems like a high number of holdings, RLTY carries a fairly concentrated portfolio in its top ten. The latest top ten accounts for 44.5% of the fund's total assets, up slightly from the previous 42%.
RLTY Top Ten Holdings (Cohen & Steers)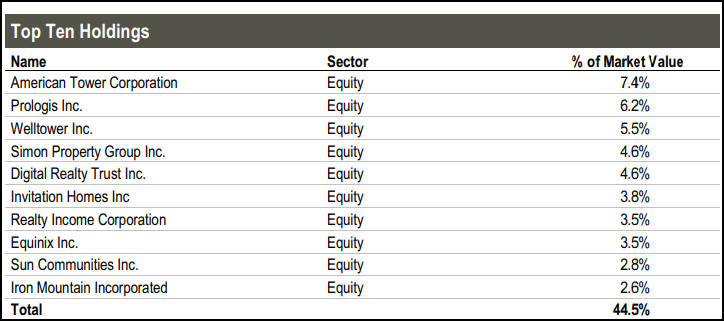
This isn't just RLTY but also from its sister funds, RQI and RNP as well. In fact, there is plenty of overlap within the top ten holdings on all three of these funds as well. The trio of funds all have the same managers, so it's quite clear that they have some strong conviction in these names. The higher the common equity positions of the fund, the higher the concentration, it would seem, as RQI's top ten comes to 50.6% and RNP's is at 31.6%.
Generally, these names are fairly consistent as well. American Tower Corp (AMT) has been a consistent name within the fund's top holdings since the fund launched. It's a regular in the sister funds as well.
Since our last coverage, Sun Communities (SUI) and Iron Mountain (IRM) are the only new names in the top ten. That saw Mid-America Apartment Communities (MAA) and SBA Communications Corp (SBAC) bumped out of the top ten. However, both of these names are still included in the fund's total holding list. It was simply that their percentage weighting in the fund slipped.
Conclusion
RLTY is the youngest closed-end fund offering from Cohen & Steers, the real estate specialist firm. It is also one of their more attractive funds in terms of valuations. The fund got off to a rough start when it launched in early 2022, and it was met with swift declines as rates aggressively increased from the Fed. They made this worse by leveraging this fund up significantly right at launch as well, which is one of the negatives I saw of this fund. Further, a year or so after CEFs launch, they often go to wide discounts - which also occurred for RLTY. So, this fund was hit with a double-whammy shortly after launch.
That said, those who waited until the end of 2022 to pick up a position in RLTY are looking at a much different story. The returns have been quite respectable, and the outlook for the fund is still rather bright. Interest rates are expected to be cut over the coming years, which should bode well for the fund on a couple of different fronts. That includes its own borrowing costs starting to ease in time for its fixed rates to start waning. It should also help out its underlying REIT holdings as they can benefit from lower borrowing costs. If we can get some further discount narrowing, that could be another potential catalyst for much better positive total share price results going forward as well.