
Khanchit Khirisutchalual
Khanchit Khirisutchalual
Cohen & Steers Real Estate Opportunities and Income Fund (NYSE:RLTY) is a closed-end fund, or CEF, incepted on Feb.24, 2022. The fund has a very short history of just two years, but the fund group (Cohen & Steers) is a well-respected name in the real estate sector. The fund primarily invests in common equity of real-estate companies and REITs (Real Estate Investment Trusts) and, to a lesser extent, in preferred and fixed-income securities. The fund is mandated to invest at least 70% of the assets in the common equities issued by real-estate companies and the remaining 30% in fixed-income securities, including preferred securities. Nearly 90% of its assets are invested in the U.S. and North America, and the rest from the developed markets, including Europe, the U.K., and Australia.
As per the fund's literature, "The Fund's primary investment objective is high current income. The Fund's secondary investment objective is capital appreciation. There can be no assurance that the Fund will achieve its investment objectives. The Fund seeks to achieve its investment objectives by investing, under normal market conditions, at least 80% of its managed assets in (i) real estate-related investments and (ii) preferred and other income securities. The Fund's real-estate related investments may include, for example, public equity, debt, and preferred securities issued by real estate investment trusts ("REITs") and other companies that invest in or provide services to real estate."
Other salient features of this fund are as follows:
Let's look at the Fund's Financial health and performance. The fund has already released its 2023 annual report covering the past 12 months for the period of Jan. 2023 – Dec. 31. 2023. We will analyze the financial data in detail in Table-1, which is presented below.
Net Investment Income:
The net investment income (or NII in short) is the net income that a fund earns from its investment in the form of dividends, distributions, and interests or derivatives like options, minus all of the fund's expenses, including management fees, operating expenses, commissions, and interest on leverage, if any. For equity-based funds, especially in high-growth sectors like technology, the NII is not very relevant. However, for fixed-income or bond funds, it is highly relevant. In the case of RLTY, currently, it has close to 70% allocation to equity and 30% to preferred and bond securities. Many of the equity stocks and REITs that it invests in provide generous yields. So, it does generate a substantial amount of income. However, in 2023, more than 75% of it was spent on expenses, including interest and management fees. This fund carries 35% leverage, so there is a substantial amount of interest expenses. This should improve in the future when the interest rates do come down significantly. In the last two years, after all expenses, the NII paid about 34% of the fund's distributions.
Here is what it looks like in terms of NII, Distributions, and Net Assets at the beginning and end of the statement period.
(all amounts are in US $ (except Shares Outstanding); negative amounts are shown inside parentheses, per the annual report, 12-months ending Dec. 31, 2023).
Table-1:
Author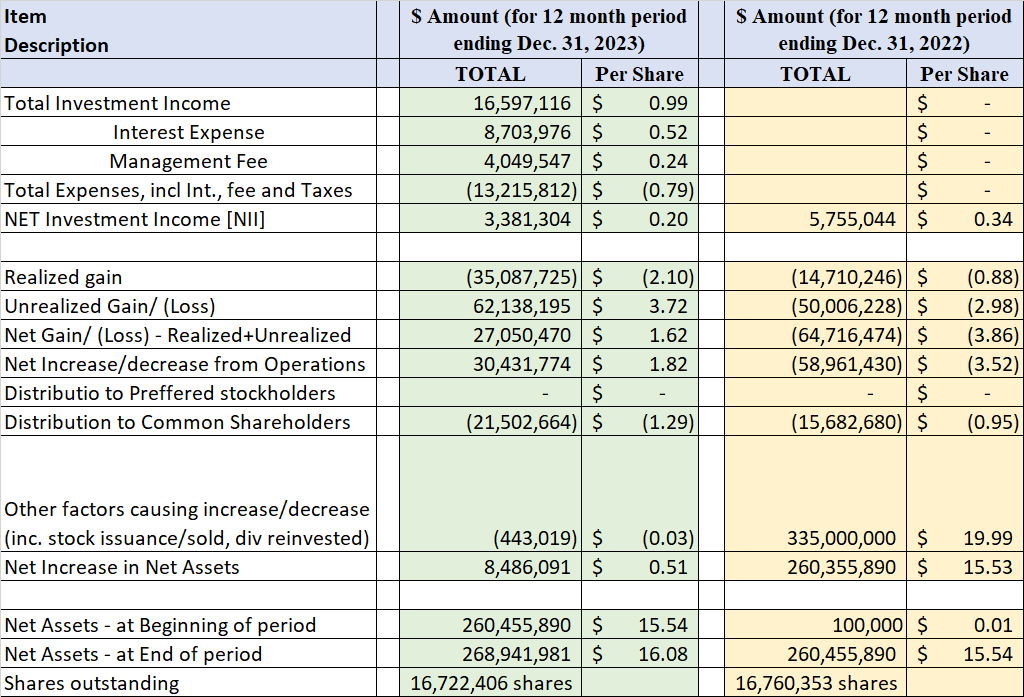
Data source: RLTY's 2023 12-Month Annual-report.
RLTY provides a monthly distribution of $0.11 per share, which comes out to be a yield of 9.30% at current prices (as of 03/13/2024) and 8.33% on the NAV. The fund follows a 'managed' distribution policy. That means it tries to keep the distribution rate fairly consistent. In fact, it started with a distribution amount of $0.104 per share but has increased it since to $0.11 a share (nearly a 6% increase). Even though the fund has a very short history, it is very similar in nature to RQI, another fund from the same managers. There are some subtle differences between the two funds in terms of allocations for common equities versus fixed-income.
So, is the distribution covered?
Table-2: Distribution (from 2022-2023)
Author (Data source: Fund's website)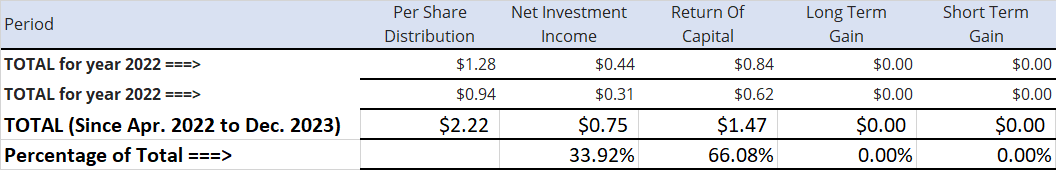
The regular forward distribution amount is $1.32 for the year ($0.11 a month), which was increased in July 2023. The fund started at a time just when real estate was peaking and a downcycle was about to start. In 2022, the Fed embarked upon the high-interest rate journey, and that hurt all income-producing assets, especially the real-estate sector. So, during the last two years, the fund had very little chance to capture any capital gains, and 2/3rd of the distribution was paid as ROC (return of capital). The remaining 1/3rd was supported by the investment income. In contrast, RQI (which has 22 years of history) paid zero ROC in the years 2022 and 2023.
The fund generates a substantial amount of investment income, but a large majority of it is consumed in expenses. This is more true right now as the interest expenses alone were $0.52 a share, roughly equal to five months' worth of distributions. This is due to the fact that the fund uses almost 35% of leverage, which does not help in a high-interest rate environment.
All that said, the high-interest rates have peaked and will likely decline from here. There is no certainty of the pace at which the rates would fall, but in all probability, we should see 2 or 3 rate cuts in 2024.
Even then, the fund has to depend on good years to generate enough capital gains to sustain the current level of distributions. As long as the down cycles are not prolonged multi-years, this fund would probably do just fine. Also, the real estate sector's outlook has improved recently, and that's why we have seen positive NAV movement in 2023.
The fund is currently trading at a discount of -10.4% (to its NAV), which is slightly below its one-year average.
Below is the history of premium/discount since inception. The fund has stayed in the discount area for the entire time. Also, the majority of the time, the discount has been from -6% to -12%. The current discount is slightly lower than its 52-week average of -12%. However, discount/premium is not the only factor that we should look at. We should also look at the overall valuation of the fund as well as its sector.
Chart-1: RLTY– Premium/Discount Chart (two-year period)
CEFconnect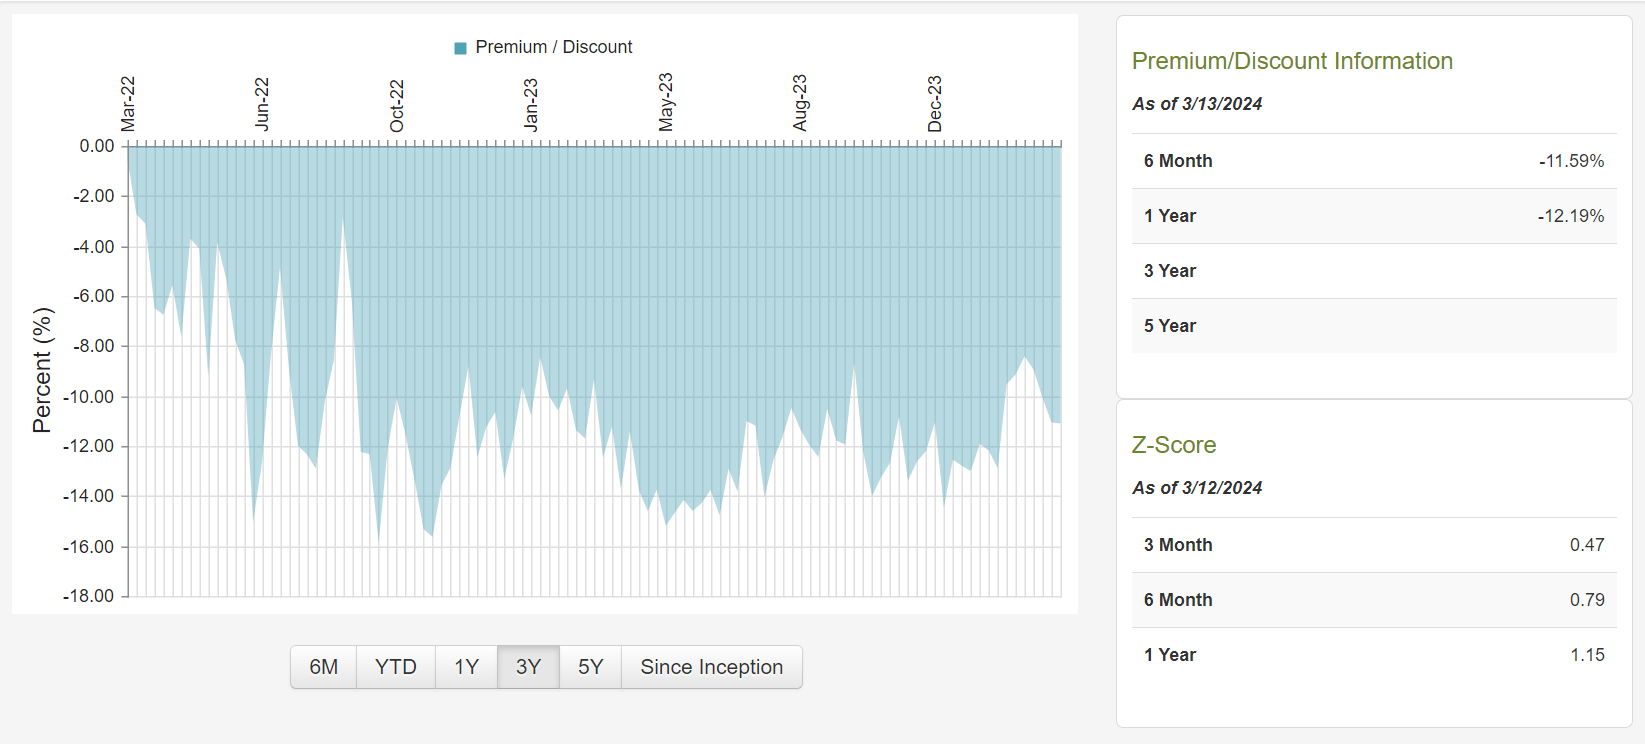
The fund is fairly diverse in terms of number of holdings, which stood at 175 on Dec. 31, 2023. At the same time, it is a bit concentrated in the top 10 holdings as they account for nearly 45%. But at the same time, it should be kept in mind that many of its holdings are REITs, and they themselves may be diversified in their underlying assets. The top 10 holdings as of Dec. 31, 2023, and sector allocations are presented below. Some of the top holdings are American Tower (AMT), Prologis (PLD), Welltower (WELL), Simon Property (SPG), Digital Realty Trust (DLR), Invitation Homes (INVH), Realty Income (O), Equinix (EQIX), and Sun Communities (SUI).
Table-3: (Top 10 Holdings as of Dec. 31, 2023)
Source: Fund's Fact sheet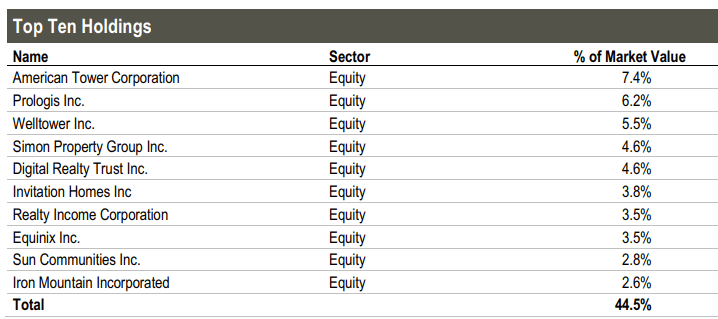
Chart-2A:
Source: Fund's Fact sheet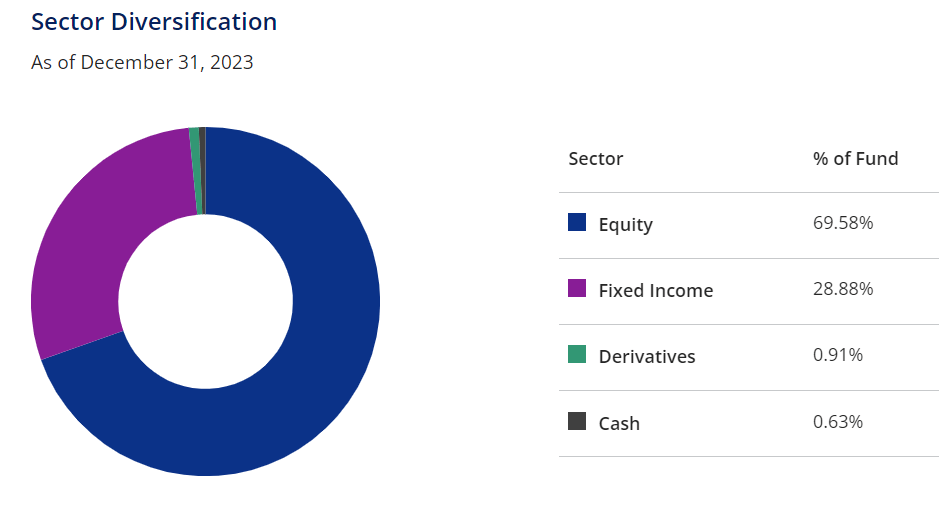
Chart-2B:
Source: Fund's Fact sheet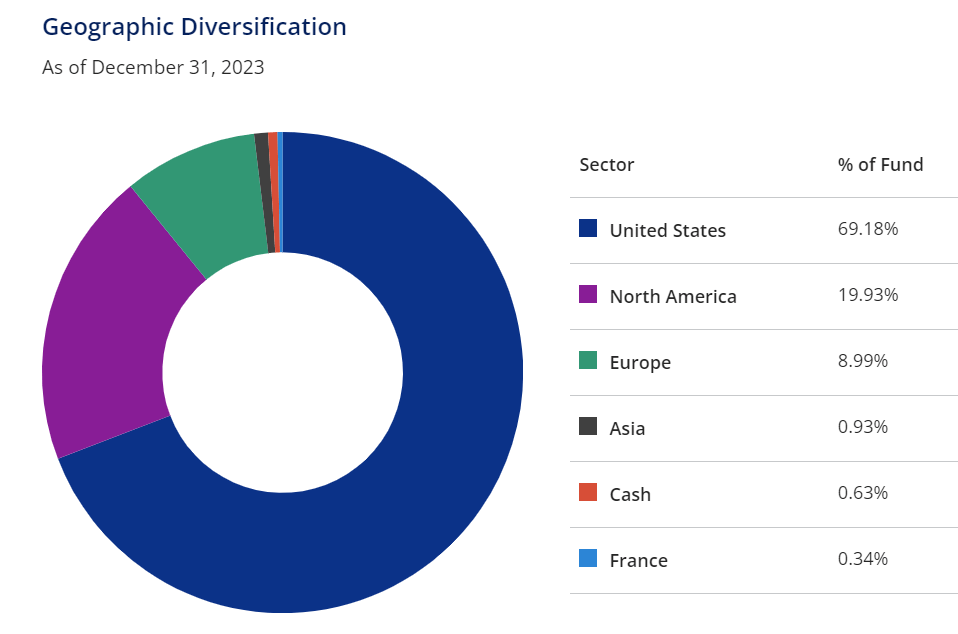
If you are looking for consistent and relatively reliable high-income and decent total returns over the long term, this fund is worth the look. This fund is only two years old, so there is not much to look at in terms of past performance. The best we can do is to look at its sister funds from the same fund family, which are quite similar in nature. You could also look at our recent articles on these two sister funds here and here. These funds are:
In addition to real estate, all the above three funds have some allocation to preferred and fixed-income bond securities. We will compare the following funds to explain their relative attributes.
Table 4: Comparison of 7 funds
Author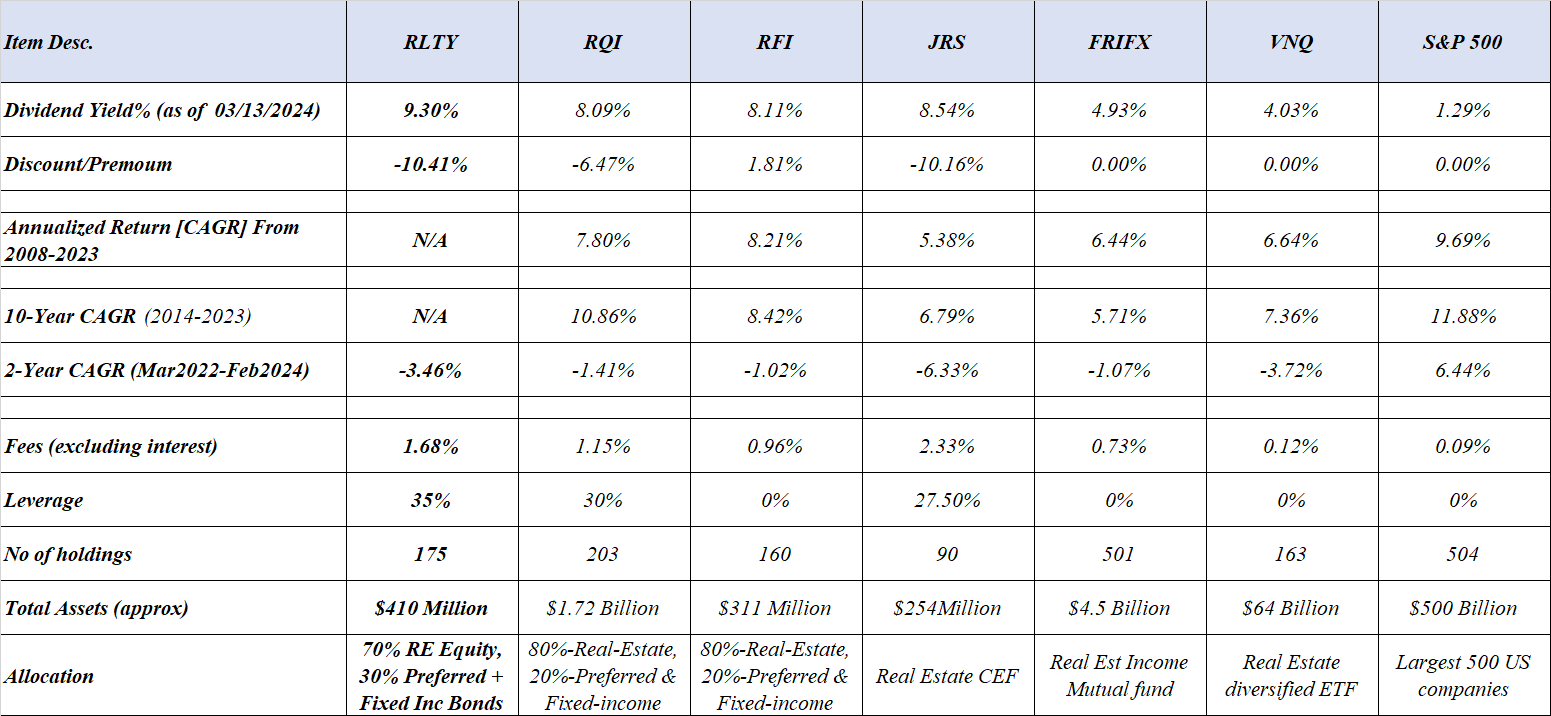
Note: Some of the data (e.g., number of holdings and leverage) may not be current.
What about the future performance? In the last two to three years, we have had high inflation and a high-interest rate regime. As stated before, the high interest rates suppressed the valuations of most income assets. The real estate and preferred securities were especially hit hard. Since the RLTY fund has 35% leverage, it will magnify the positive or negative impacts that much more. The million-dollar question is when will we see the normalization of interest rates. The Fed has been giving mixed signals. The market has pushed back the expectation of rate cuts somewhat but still expects at least two rate cuts this year (if not three). Nonetheless, it is a question of when, not if. So, when the rates start declining, most real-estate assets will get a boost.
Investors need to be aware of certain risk factors that are associated with this fund and CEFs in general. Risk factors could be summarized as follows:
If you are looking to diversify your portfolio and add some allocation to the real-estate sector, you could invest in some of the REITs. You could also earn roughly 4% income (on average) from such a portfolio of REITs. However, you will probably need several REITs to sufficiently diversify your real-estate holdings. Also, if you were to need income higher than 4%, you may be better served investing in just a couple of Closed-end funds and done with it. An additional benefit you may seek is the discount that may be available on the NAV.
RLTY is one such fund that is offering an attractive discount in excess of -10%. In addition, the entire real-estate sector is selling relatively on cheaper valuations. However, please be aware of the leverage that this fund uses. Leverage generally causes higher volatility and magnifies the gains or losses depending upon the direction of the market or the asset class. For folks who do not like leveraged funds and the higher volatility that comes with them, they could look at RFI, a similar and older fund with zero leverage from the same fund family.
Currently, the fund's performance in the last two years (its entire history) looks awful, but that is more due to the beating the real-estate sector has taken.
The new buyers could open a partial position. The existing owners should hold the shares as most of the pain is in the rearview mirror, and it should do well when the interest rate cycle changes.