
small smiles
small smiles
Investors in Columbia Seligman Premium Technology Growth Fund (NYSE:STK) have enjoyed terrific returns in the past 1 year or so. The chart next shows the price return of STK, in comparison with two peer funds: Global X NASDAQ 100 Covered Call ETF (QYLD) and Nuveen NASDAQ 100 Dynamic Overwrite Fund (QQQX) since March 2023. As seen, STK has significantly outperformed both QYLD and QQQX over the period. STK has gained 23.10%, compared to QYLD's 5.83% and QQQX's 2.01%.
Seeking Alpha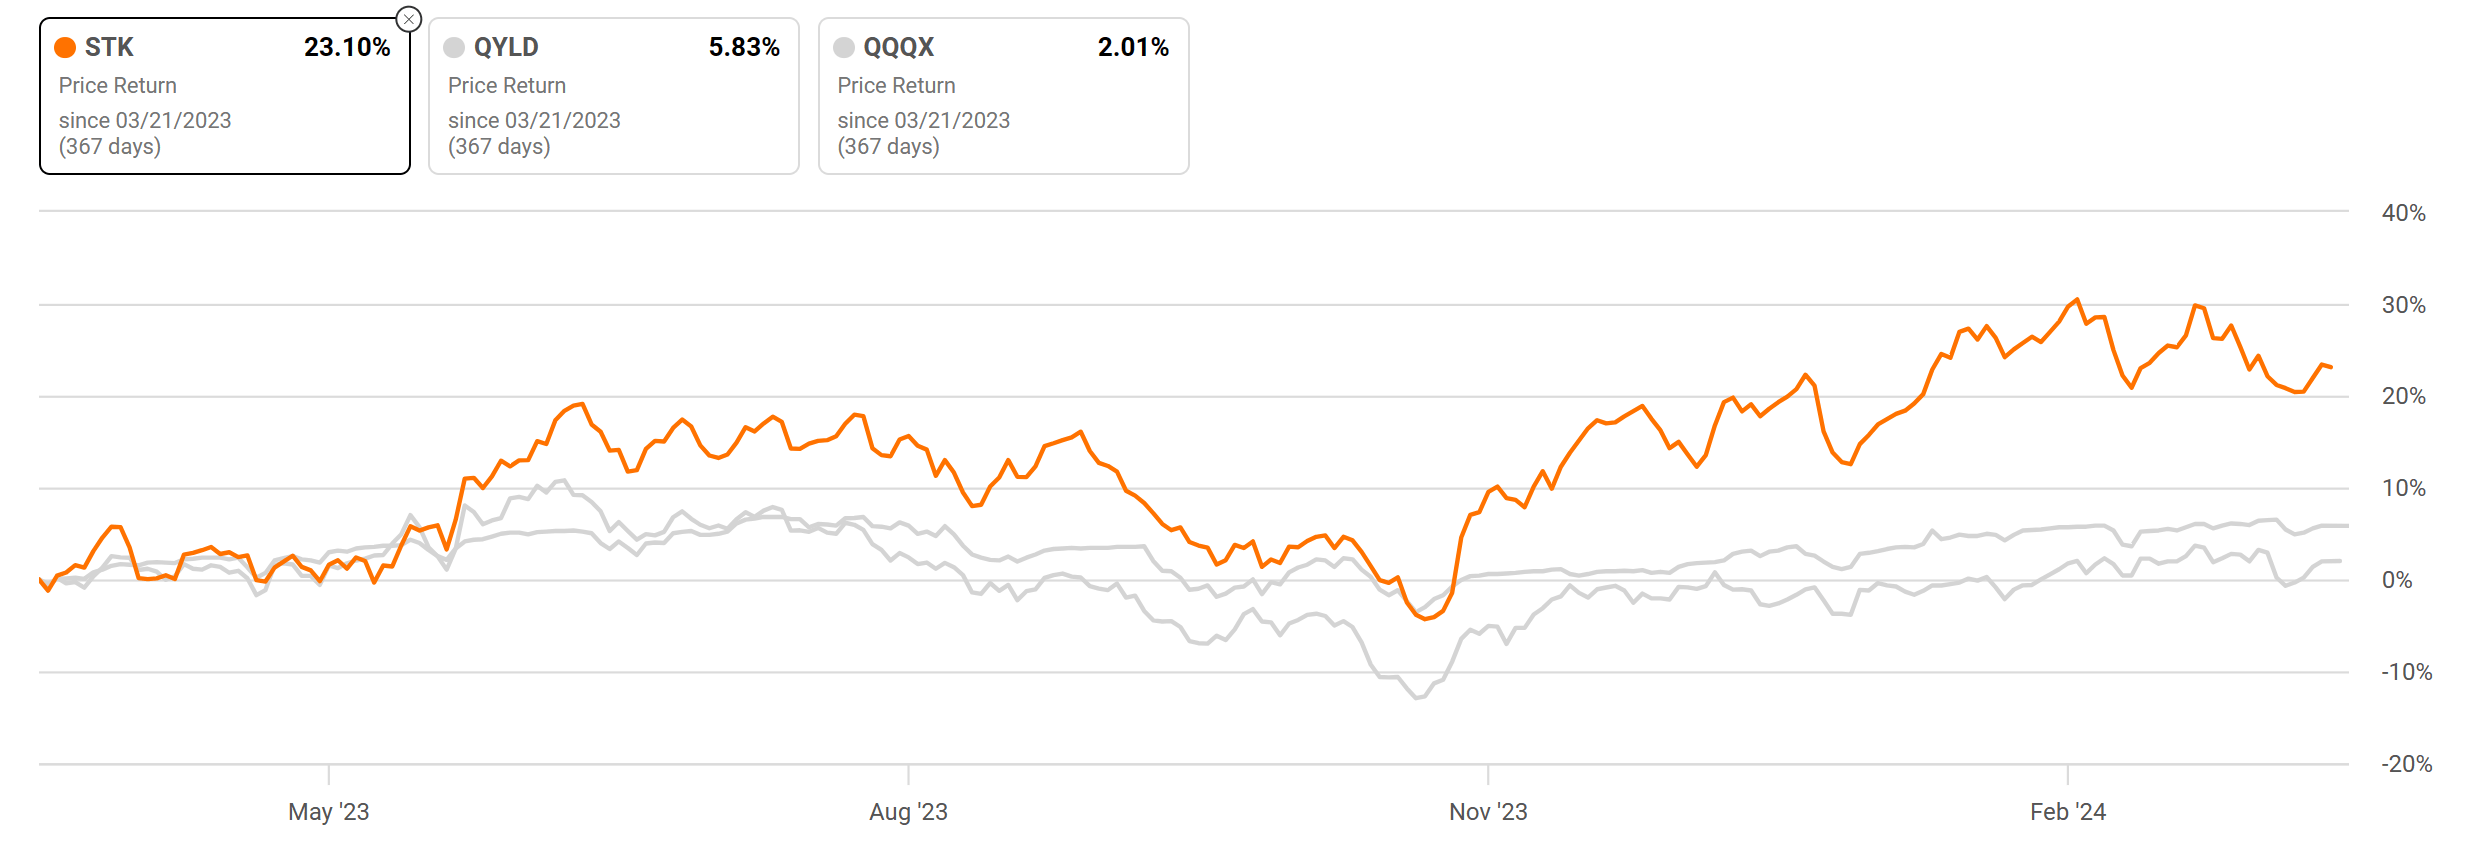
However, as the sayings go, past performance is not necessarily indicative of future results. And the thesis of this article is precisely to argue why STK's lead so far is unlikely to continue. In the remainder of this article, I will make my argument on a few key factors including the valuation of the tech sector, the impact of rising interest rates, and also the implication of its use of covered calls.
Before diving in, it's important that I first provide some basic information about the fund. Assuming readers are already well versed in the basics (a quick summary is provided below), I will focus only on the features that are key to my subsequent analyses.
STK fund description: Under normal market conditions, the Funds investment program will consist primarily of (1) investing in a portfolio of equity securities of technology and technology-related companies that seeks to exceed the total return, before fees and expenses, of the S&P North America Technology Sector Index and (2) writing call options on the NASDAQ 100 Index… with an aggregate notional amount typically ranging from 25% to 90% of the underlying value of the Fund's holdings of common stock.
The first key feature is that STK uses call options as an overlay to generate extra income as highlighted above. This is what makes the fund comparable to QYLD and QQQX, which both use this strategy (although to different degrees). However, note that STK charges the highest expense ratio out of the three at 1.26% and also has the smallest assets under management ("AUM"). The implications of these features for its future return projections will be elaborated immediately next.
Seeking Alpha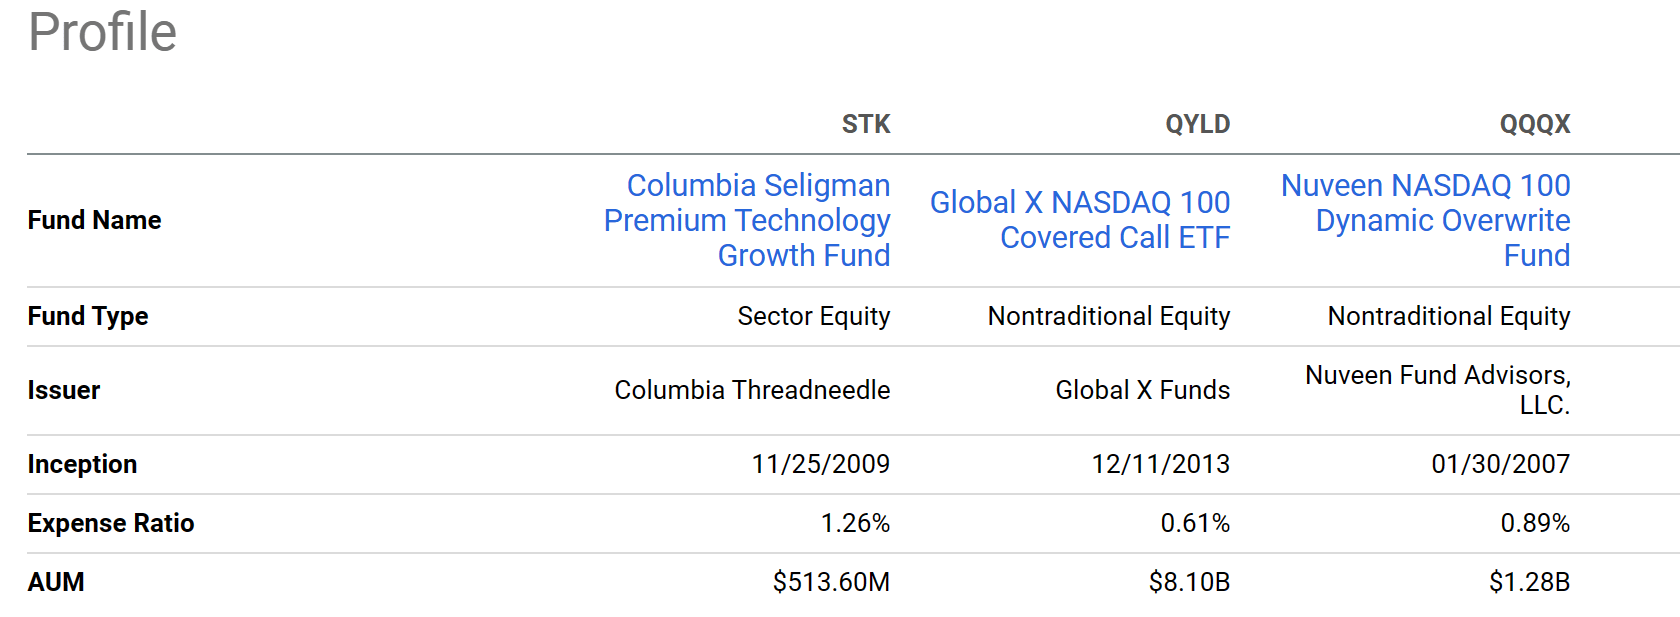
Let me start with the most obvious risk in my view: the valuation risk. The P/E ratio for the Nasdaq index currently stands at 29.45x as of Mar 21, 2024. To put this level in a broader context, the next chart shows the historical P/E of the index in the past 10 years. As seen, ignoring the outlier data point in 2016, this level of valuation is the second highest in 10 years, only slightly below the peak of 29.55x observed in 2018. I could find historical for STK's valuation multiples. But with its focus on the tech space, I assume its valuation multiples correlate closely with the Nasdaq index and is also near a peak level in multiple years. As such, if the technology sector experiences a slowdown or correction, STK's price could respond very sensitively.
Source: Fullratio.com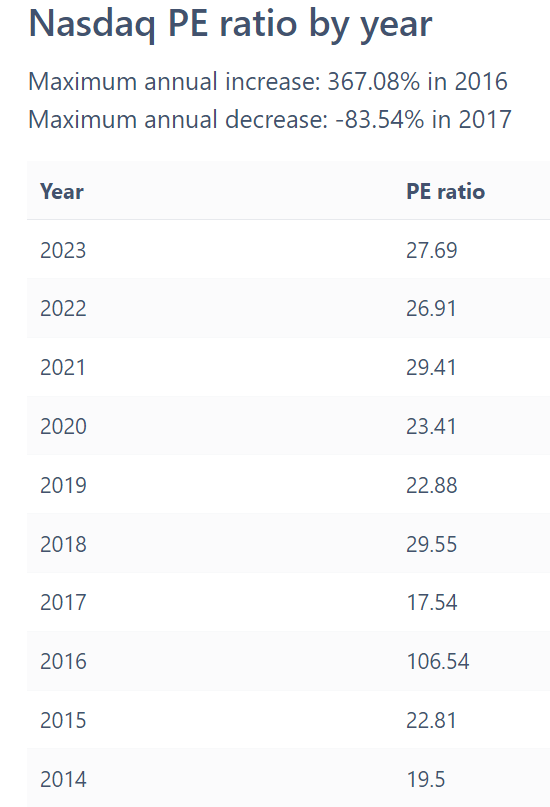
The next top concern in my mind is the risks associated with STK's use of covered calls. As shown in the chart below (taken from its most recent fund fact sheet), the fund currently has a call overwrite percentage of 25% (see the last line in the table). Note that the percentage could be even higher as management typically uses an overwrite percentage between 25% and 90% of the notional value of the fund's holdings.
STK fund fact sheet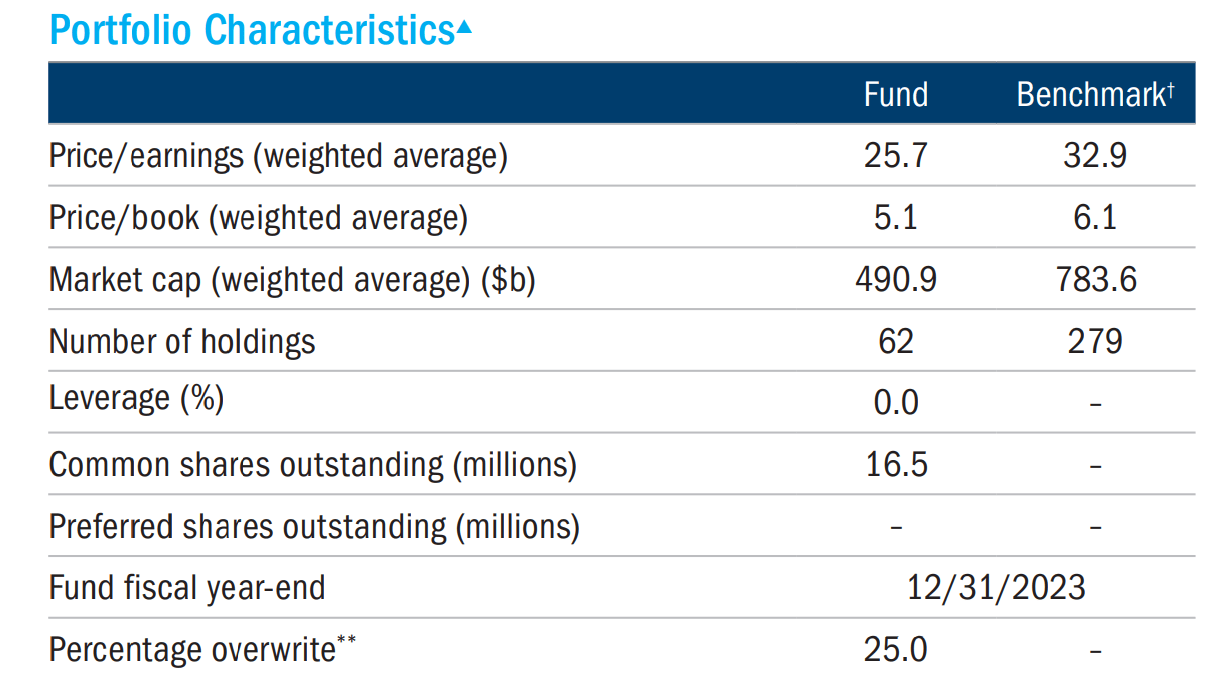
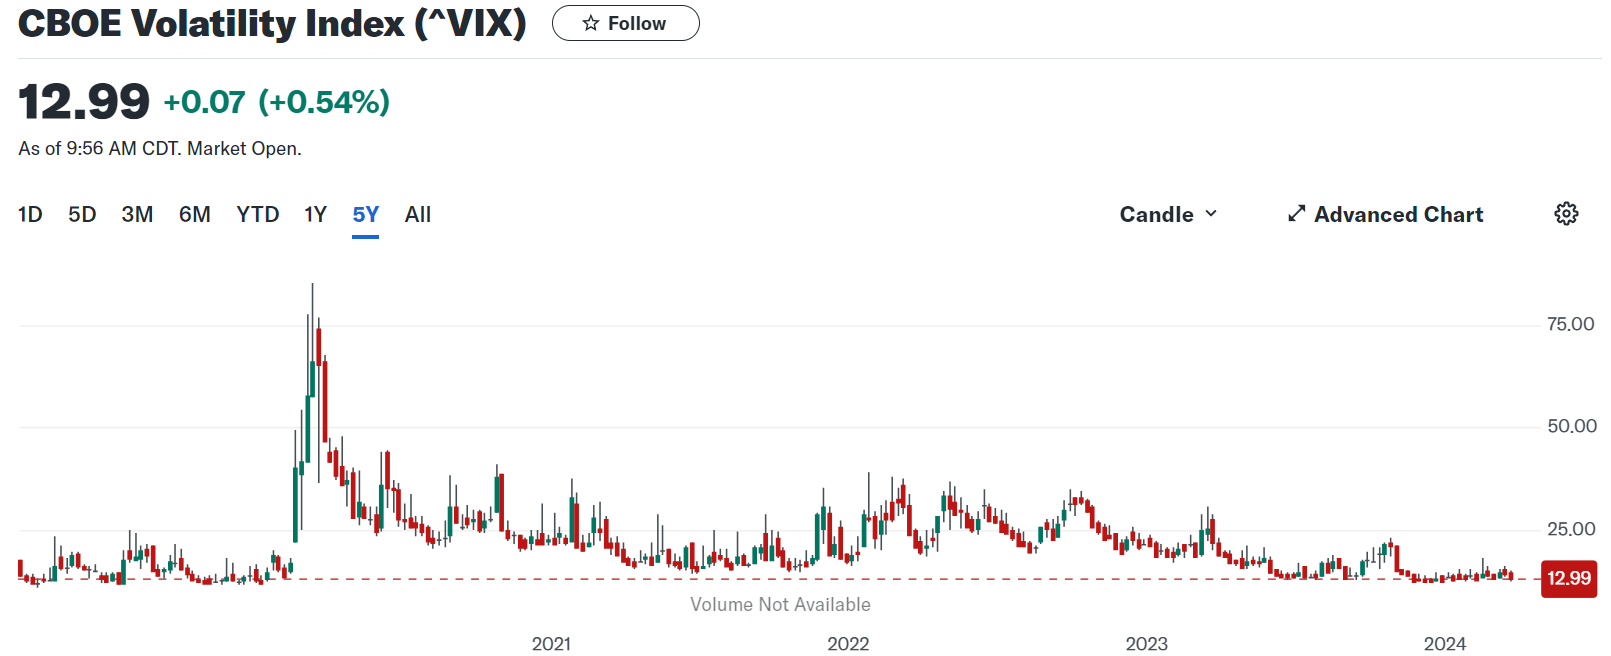
This strategy has worked beautifully for funds like STK in the past few years given the relatively low interest rates (see the first chart below) and also moderate volatilities (see the second chart below) in that period.
However, now the interest rates have climbed up quite a bit and could stay at this elevated level given the persisting inflation. A high-rate environment could hurt STK in at least two ways. First, it automatically makes the income generated from the call strategy less attractive. Secondly, it acts as a pulling force for the valuation of riskier assets like technology stocks in the downward direction.
In the meantime, the volatility profile has also changed dramatically. In my experience, covered call strategies tend to perform best in moderately volatile markets. Under such market conditions, it serves as an ideal balance to generate income without losing too much upside potential in my view. Now the market has become very calm with a volatility index hovering around 13x, among the lowest levels historically. Thus, I anticipate STK's income generation from selling call options to be less efficient going forward.
Yahoo Finance Yahoo Finance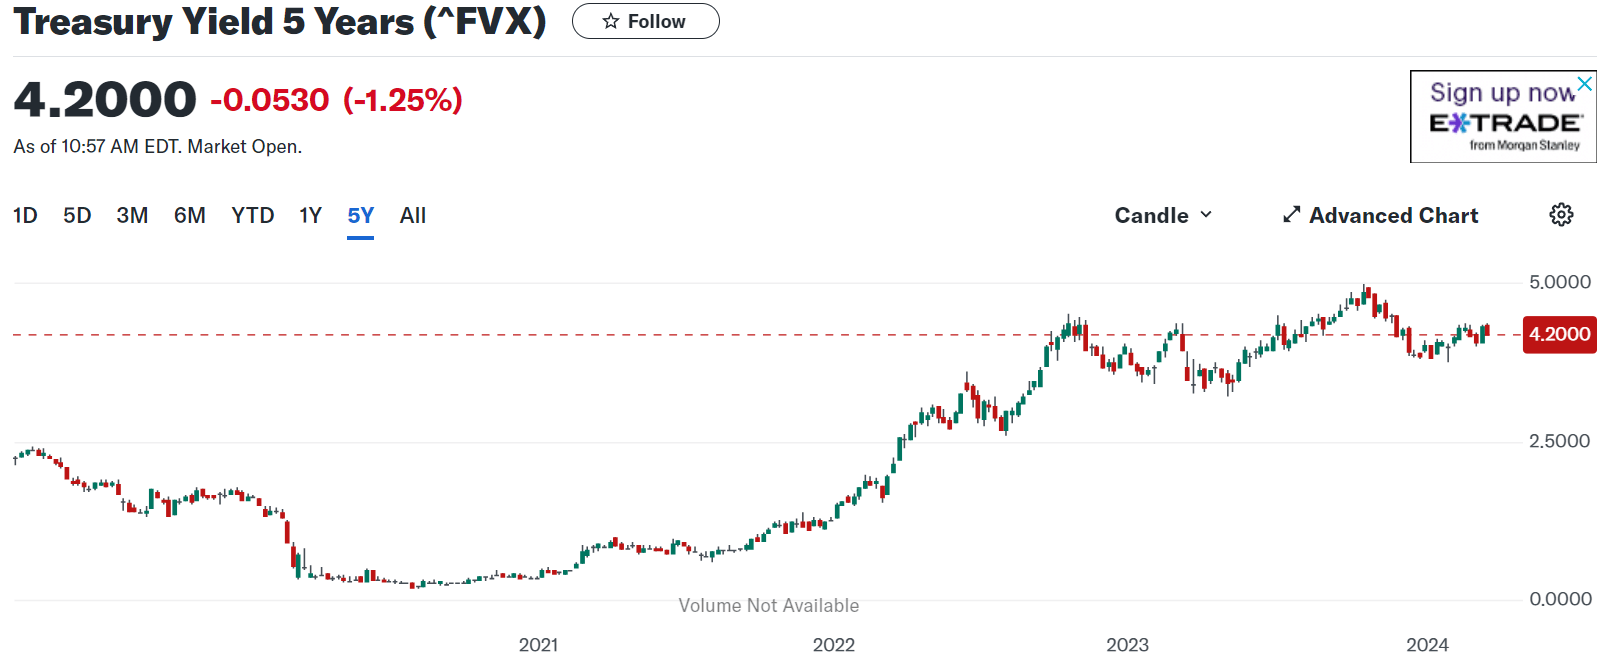
Before closing, there are a few other concerns worth mentioning. First, for income-oriented investors, STK's dividend yield is not as high on the surface. As seen in the chart below, its current yield of 5.75% (on a TTM basis) is both below peer funds and also below its historical average (8.97%) by a large margin (another indication of the valuation risks in my view). Second, STK has shown no dividend growth in the past 5 years. Again, this is fundamental to the option strategy, which generates most of the dividends and is not indicative of the fundamental profitability of the holdings. You can see this issue is common to QYLD and QQQX as well.
Finally, as already mentioned earlier, the higher prevailing treasury rates automatically discount the income provided by other assets more heavily. Here is also a good place to revisit STK's fee of 1.26%. As noted earlier, this is substantially higher than other similar funds. Even though 1.26% may not seem like a lot in absolute terms. But in relative terms, it's more than 20% of the dividend income it generates.
Seeking Alpha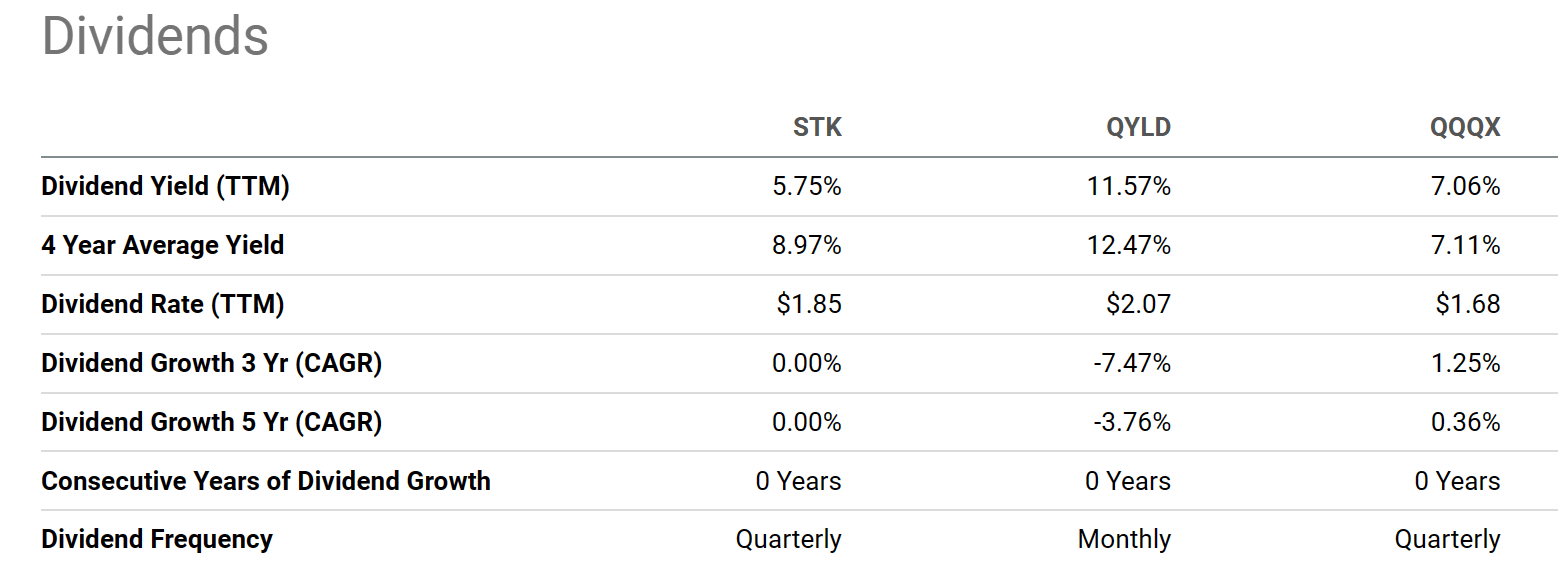
The upside risks are twofold. One is common to all covered-call funds. While the covered call strategy puts a cap on potential gains from rising stock prices, it can also offer some protection on the downside during a major market correction. The second one is more particular to the STK fund. The fund holds selected stocks from the tech sector and thus features a lower P/E compared to tech indices. If you recall from an earlier chart, its P/E (weighted average) is 25.7x, a bit lower than the Nasdaq index and substantially lower than the S&P North American Technology Sector Index (with a P/E of 32.9x). This feature could make STK's valuation risks relatively lower compared with these indices. But again, my feeling is that the valuation risk is still substantial in absolute terms.
To conclude, my thesis is that the terrific performance provided by Columbia Seligman Premium Technology Growth Fund in the past 1~2 years is unlikely to continue. My overall feeling is that the risks outweigh the rewards. To recap, the key risks I see are valuation risks and the headwinds to its covered-call strategy created by interest rates and market volatilities. Finally, income-oriented investors should be aware that the dividend yield is not as high as on the surface considering the lack of growth, fees, and risk-free rates.