
Ratana21/iStock via Getty Images
Ratana21/iStock via Getty Images
This article series aims at evaluating ETFs (exchange-traded funds) regarding past performance and portfolio metrics. Reviews with updated data are posted when necessary.
Vanguard Russell 1000 Growth Index Fund ETF Shares (NASDAQ:VONG) started investing operations on 09/20/2010 and tracks the Russell 1000 Growth Index. It has 443 holdings, a dividend yield of 0.70%, an expense ratio of 0.08%, and is also available as a mutual fund (VRGWX). It is a direct competitor to iShares Russell 1000 Growth ETF (IWF), which tracks the same index. IWF has higher trading volumes, and also a higher fee.
VONG | IWF | |
Inception | 9/20/2010 | 5/22/2000 |
Expense Ratio | 0.08% | 0.19% |
AUM | $23.79B | $88.79B |
Avg Daily Volume | $78.07M | $495.82M |
As described by FTSE Russell, the underlying index...
... includes those Russell 1000 companies with relatively higher price-to-book ratios, higher I/B/E/S forecast medium term (2 year) growth and higher sales per share historical growth (5 years).
I/B/E/S is the Institutional Brokers' Estimate System, which compiles estimates made by stock analysts on future earnings. The fund’s turnover rate in the most recent fiscal year was 14%. This article will use as a benchmark the parent index Russell 1000, represented by iShares Russell 1000 ETF (IWB).
The portfolio is overweight in the technology sector (53% of asset value), followed by consumer discretionary (18.6%), healthcare (10.3%) and industrials (10.1%). Other sectors are below 3%. Compared to the parent index, VONG significantly overweights technology and consumer discretionary. It massively underweights all sectors that are not in the top 4 listed above. The next chart lists sectors with a weight above 1% of assets. Vanguard sector classification is not GICS: internet services companies classified in the communication services sector by GICS are aggregated with information technology.
VONG sector breakdown (Chart: author; data: Vanguard)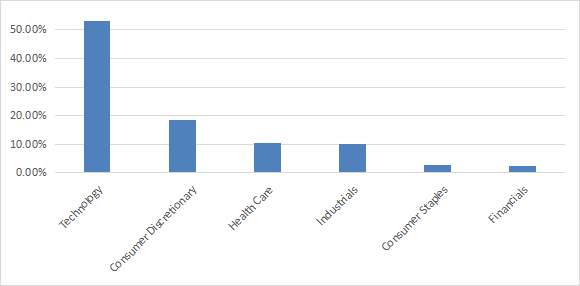
The portfolio is very concentrated: the top 10 issuers, listed in the next table with growth metrics, represent 53.3% of asset value. In fact, 313 holdings out of 443 are negligible, with a weight below 0.1%. The top two names, Apple and Microsoft, weigh about 23% together.
Ticker | Name | Weight % | EPS growth % TTM | EPS growth % 5Y | Sales Growth % TTM | Sales Growth % 5Y |
Microsoft Corp. | 12.16% | 22.94 | 35.37 | 11.51 | 13.98 | |
Apple, Inc. | 11.18% | 9.20 | 15.55 | -0.47 | 7.59 | |
Alphabet, Inc. | 6.35% | 27.47 | 21.56 | 9.36 | 17.53 | |
NVIDIA Corp. | 6.01% | 585.45 | 48.41 | 125.85 | 39.06 | |
Amazon.com, Inc. | 5.75% | 1162.74 | 23.55 | 11.83 | 19.80 | |
Meta Platforms, Inc. | 3.55% | 73.52 | 14.46 | 15.69 | 19.29 | |
Eli Lilly & Co. | 2.25% | -16.40 | 13.74 | 19.56 | 9.69 | |
Tesla, Inc. | 2.12% | 18.64 | 67.74 | 18.80 | 35.15 | |
Broadcom Inc. | 2.09% | 25.65 | 2.37 | 7.88 | 11.43 | |
Visa, Inc. | 1.79% | 22.06 | 13.80 | 10.48 | 9.64 |
* The two shares series of Alphabet Inc, listed as distinct holdings by Vanguard, have been grouped on the same line.
The next table confirms that VONG is more expensive than the benchmark regarding valuation ratios and has better growth metrics, in line with the underlying index description. The largest relative gaps are in price/book and cash flow growth.
VONG | IWB | |
P/E TTM | 32.79 | 23.45 |
Price/Book | 10.86 | 4.04 |
Price/Sales | 4.48 | 2.6 |
Price/Cash Flow | 22.72 | 16.22 |
Earnings growth | 20.29% | 15.87% |
Sales growth % | 12.36% | 8.64% |
Cash flow growth % | 16.06% | 8.54% |
Data source: Fidelity.
In my ETF reviews, risky stocks are companies with at least 2 red flags among: bad Piotroski score, negative ROA, unsustainable payout ratio, bad or dubious Altman Z-score, excluding financials and real estate where these metrics are unreliable. With this assumption, risky stocks weigh only 7% of asset value, which is a good point. According to my calculation of aggregate quality metrics (reported in the next table), portfolio quality is significantly superior to the benchmark. The return on assets is especially impressive.
VONG | IWB | |
Altman Z-score | 11.50 | 3.77 |
Piotroski F-score | 6.83 | 6.03 |
ROA % TTM | 17.75 | 6.03 |
Since 10/1/2010 VONG has outperformed IWB by 2.7% in annualized return, as reported in the next table. Risk metrics are mixed: volatility is higher than the benchmark, but the maximum drawdown is a bit shallower. A cautionary note: this time interval mostly covers a powerful bull market. This excess return may not represent the real potential of the strategy over a full market cycle.
Total Return | Annual Return | Drawdown | Sharpe ratio | Volatility | |
VONG | 671.66% | 16.44% | -32.72% | 0.95 | 15.91% |
IWB | 462.20% | 13.73% | -34.60% | 0.86 | 14.71% |
The growth fund has outperformed by a stunning 15% over the last 12 months:
VONG vs IWB, last 12 months (Seeking Alpha)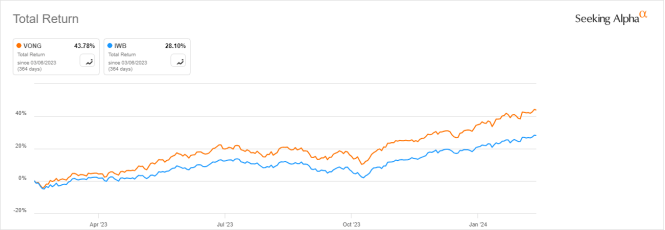
The next table compares characteristics of VONG and five popular growth ETFs mostly focused on large cap companies:
VONG | QQQ | SCHG | IUSG | SPGP | ILCG | |
Inception | 9/20/2010 | 3/10/1999 | 12/11/2009 | 7/24/2000 | 6/16/2011 | 6/28/2004 |
Expense Ratio | 0.08% | 0.20% | 0.04% | 0.04% | 0.34% | 0.04% |
AUM | $23.79B | $258.35B | $26.42B | $16.64B | $4.66B | $2.09B |
Avg Daily Volume | $78.07M | $19.80B | $133.94M | $63.04M | $38.95M | $4.18M |
Holdings | 443 | 102 | 251 | 476 | 76 | 397 |
Top 10 | 53.30% | 47.07% | 55.30% | 54.49% | 19.95% | 53.32% |
Turnover | 14.00% | 22.00% | 9.00% | 36.00% | 49.00% | 28.00% |
The next chart compares total returns, starting on 6/20/2011 to match all inception dates. The Nasdaq 100 ETF is the best performer by far. VONG comes in third position, shortly behind SCHG.
VONG vs competitors, since 6/20/2011 (Seeking Alpha)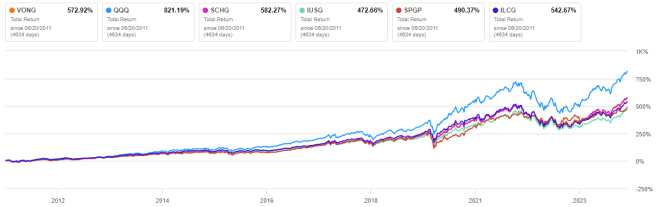
Over the last 12 months, VONG is in the middle of the pack and SCHG is leading:
VONG vs competitors, trailing 12 months (Seeking Alpha)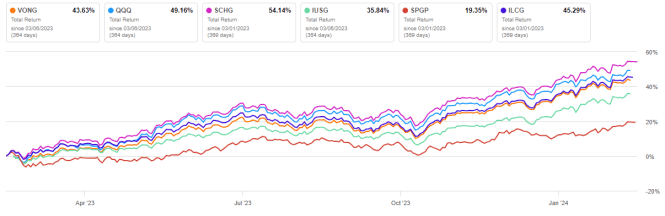
Vanguard Russell 1000 Growth Index Fund ETF Shares holds 443 stocks of the Russell 1000 Index with relative high growth and valuation. It tracks the same index as IWF. The portfolio is very concentrated in technology and in its top holdings. Quality metrics and historical return are significantly superior to the Russell 1000. Nevertheless, performance is average compared to peers. Invesco Nasdaq 100 ETFs (QQQ, and also QQQM) are ahead of the competition in the growth ETF category. VONG has gained 59% since January 2023 and 22% in the last 4 months. It’s far above the historical average. Even with a bullish view, it is not a good time to go "all in," but rather to consider risk management strategies for existing positions.