da-kuk
da-kuk
Leverage is a hedonistic approach to trading or investing, as the risk-reward profile results in overwhelming pleasure or incredible pain. Leveraged derivative market tools use options and swaps to create the gearing, which comes at a price, time decay. If the price of an underlying asset moves contrary to expectations, the losses can quickly mount. Stable markets also lead to pain as leverage suffers from static price action. Meanwhile, the profits are magnified when the underlying asset performs according to expectations.
Technology stocks and the NASDAQ-100 (NDX) composite are more volatile than the diversified S&P 500 (SP500) and Dow Jones Industrial Average (DJI). The monthly historical volatility of the SPDR® S&P 500 ETF Trust (SPY) that tracks the S&P 500 was at the 13.87% level on November 14, while the DIA that follows the DJIA was 12.95%. The QQQ following the tech-heavy NASDAQ was higher at 18.26%. Since the Ultra QQQ 2X ETF (NYSEARCA:QLD) leverages the QQQ, its monthly historical volatility was 37.45%, reflecting the higher risk and potential for oversized rewards. Possible rewards are always a function of the risks.
Technology stocks are volatile and can experience extreme price variance.
Twenty-Year Chart of the NASDAQ Composite Index (Barchart)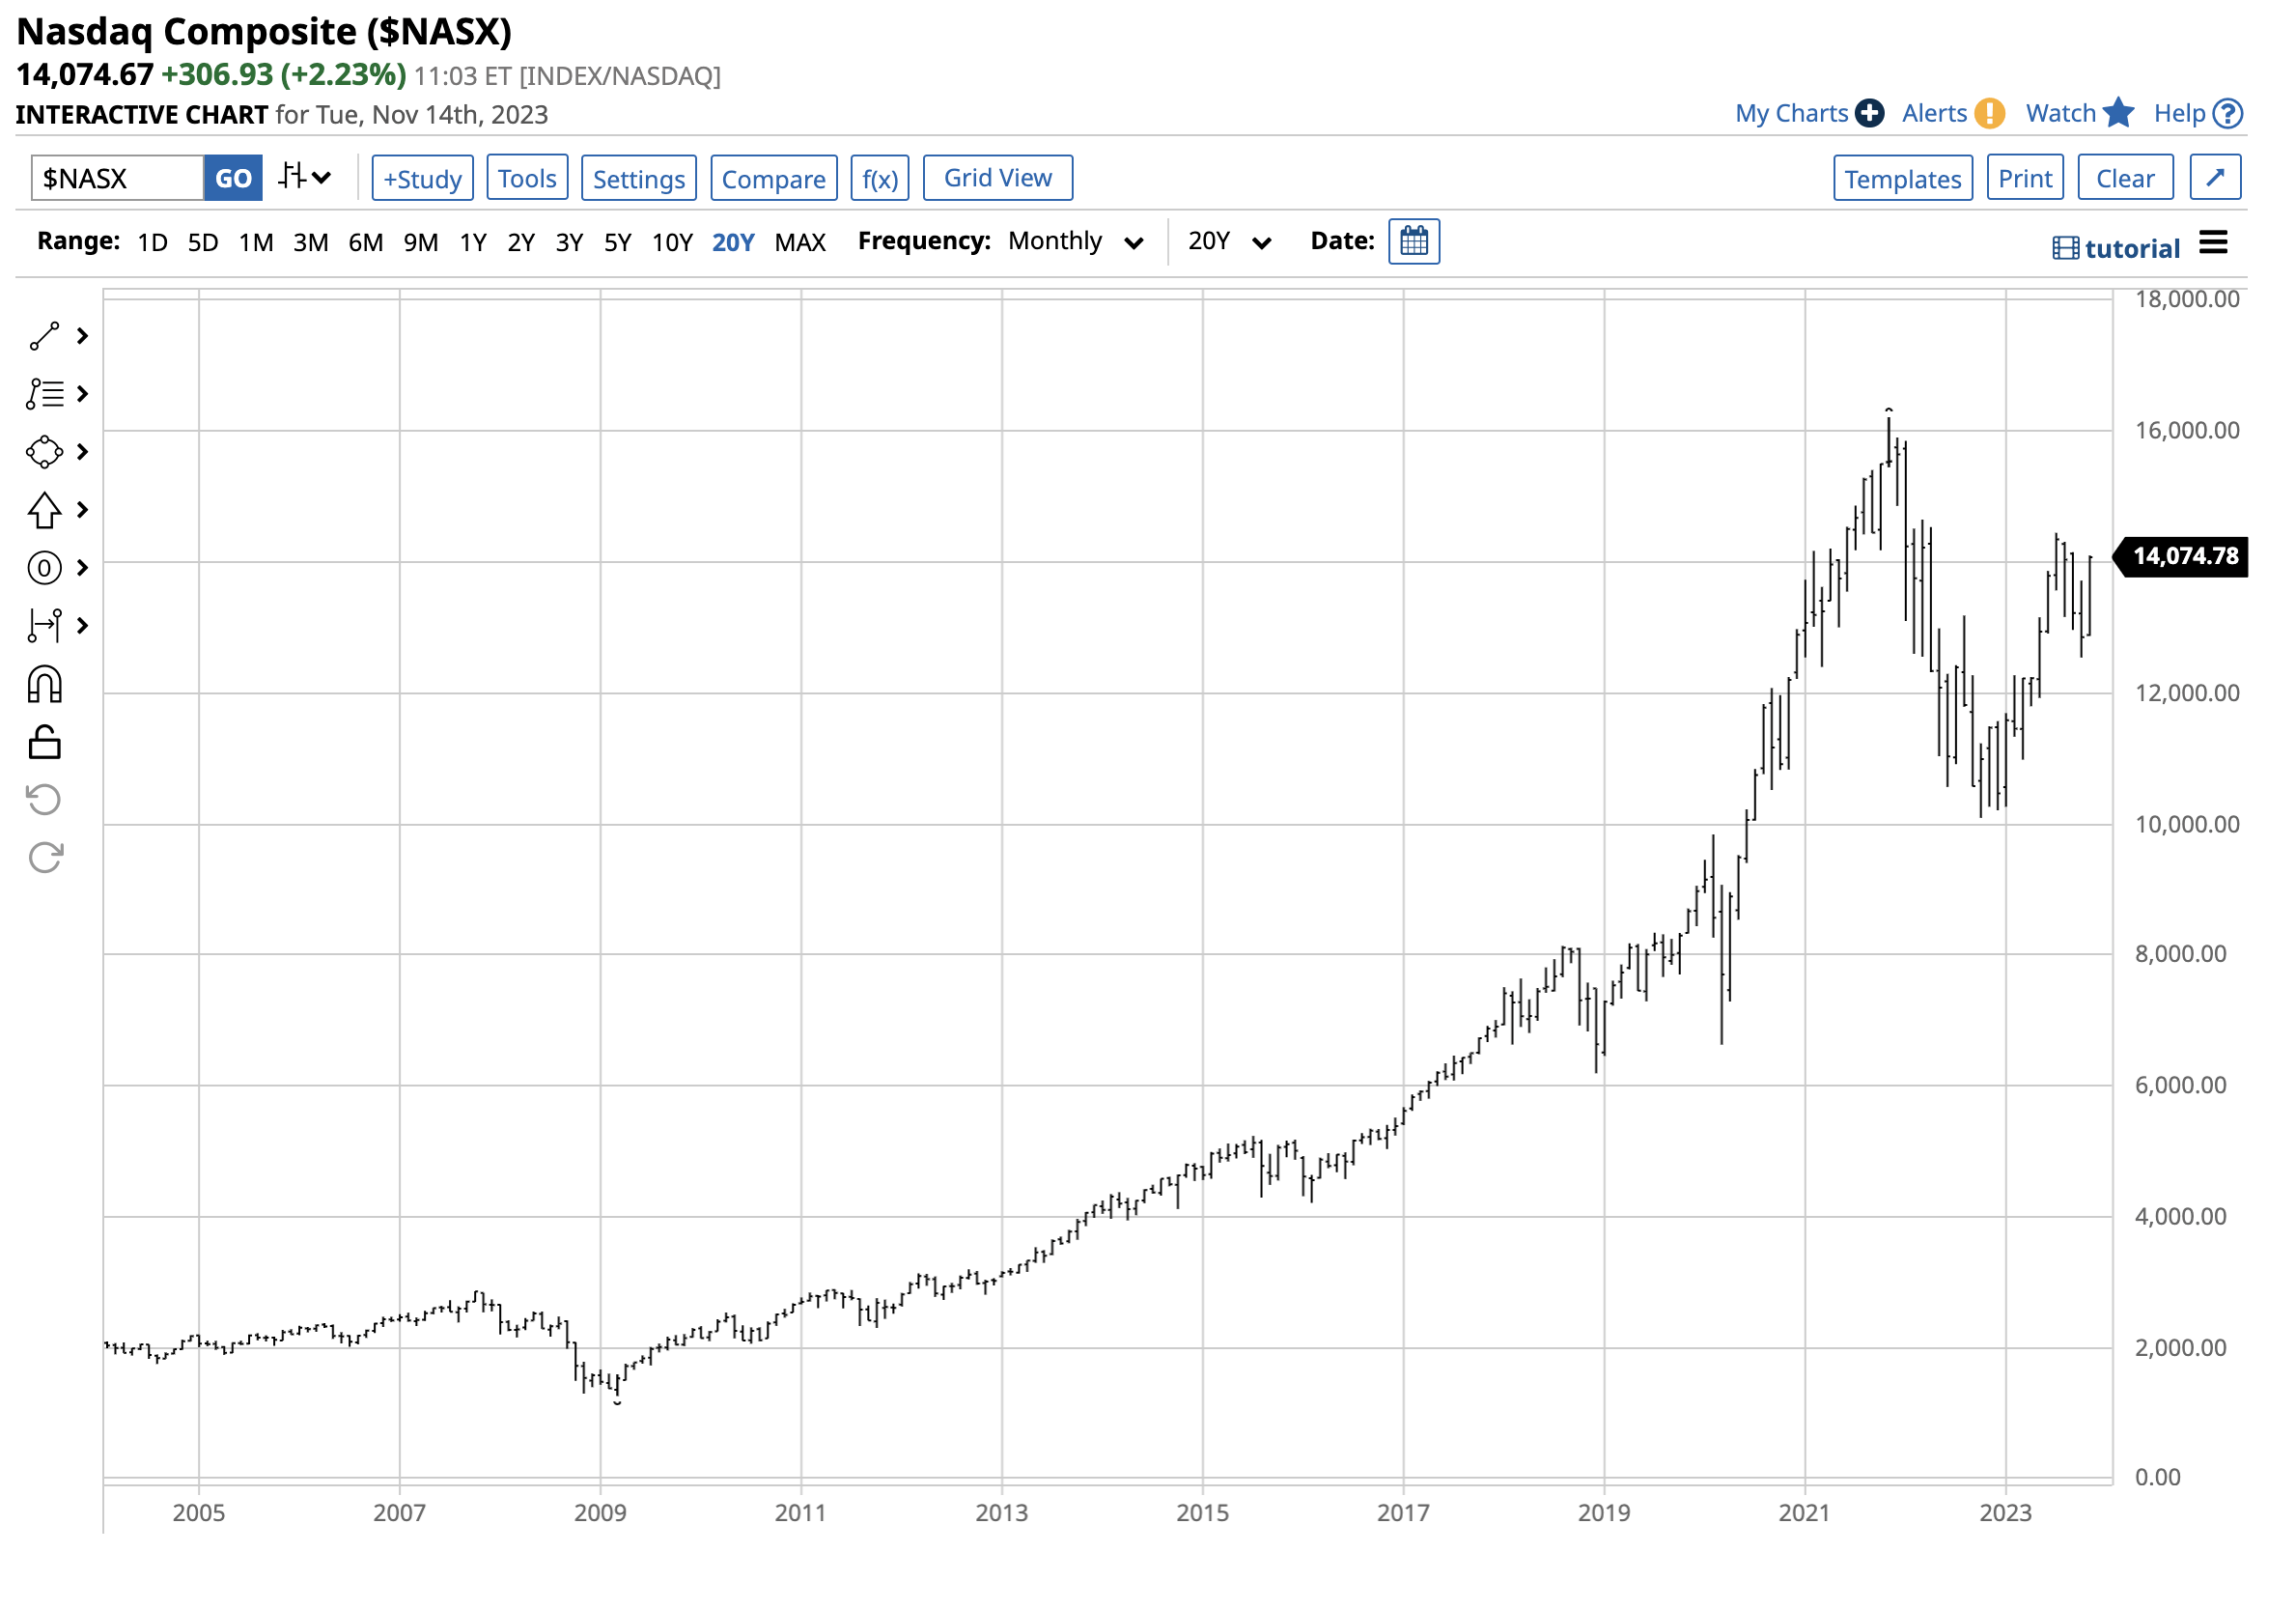
The monthly chart of the tech-heavy NASDAQ index shows the following downdrafts over the past years:
The diversified S&P 500 also experienced significant downdrafts over the period but were less dramatic on a percentage basis in two of the three selloffs.
The overall trajectory of recoveries in the NASDAQ beat the S&P 500 on a percentage basis.
Recoveries in the NASDAQ have outperformed the S&P 500 over the recent years as investors have embraced technology stocks.
Buying technology stocks on price weakness during corrections has been the optimal approach to the stock market for decades.
Long-Term NASDAQ Composite Chart (Barchart)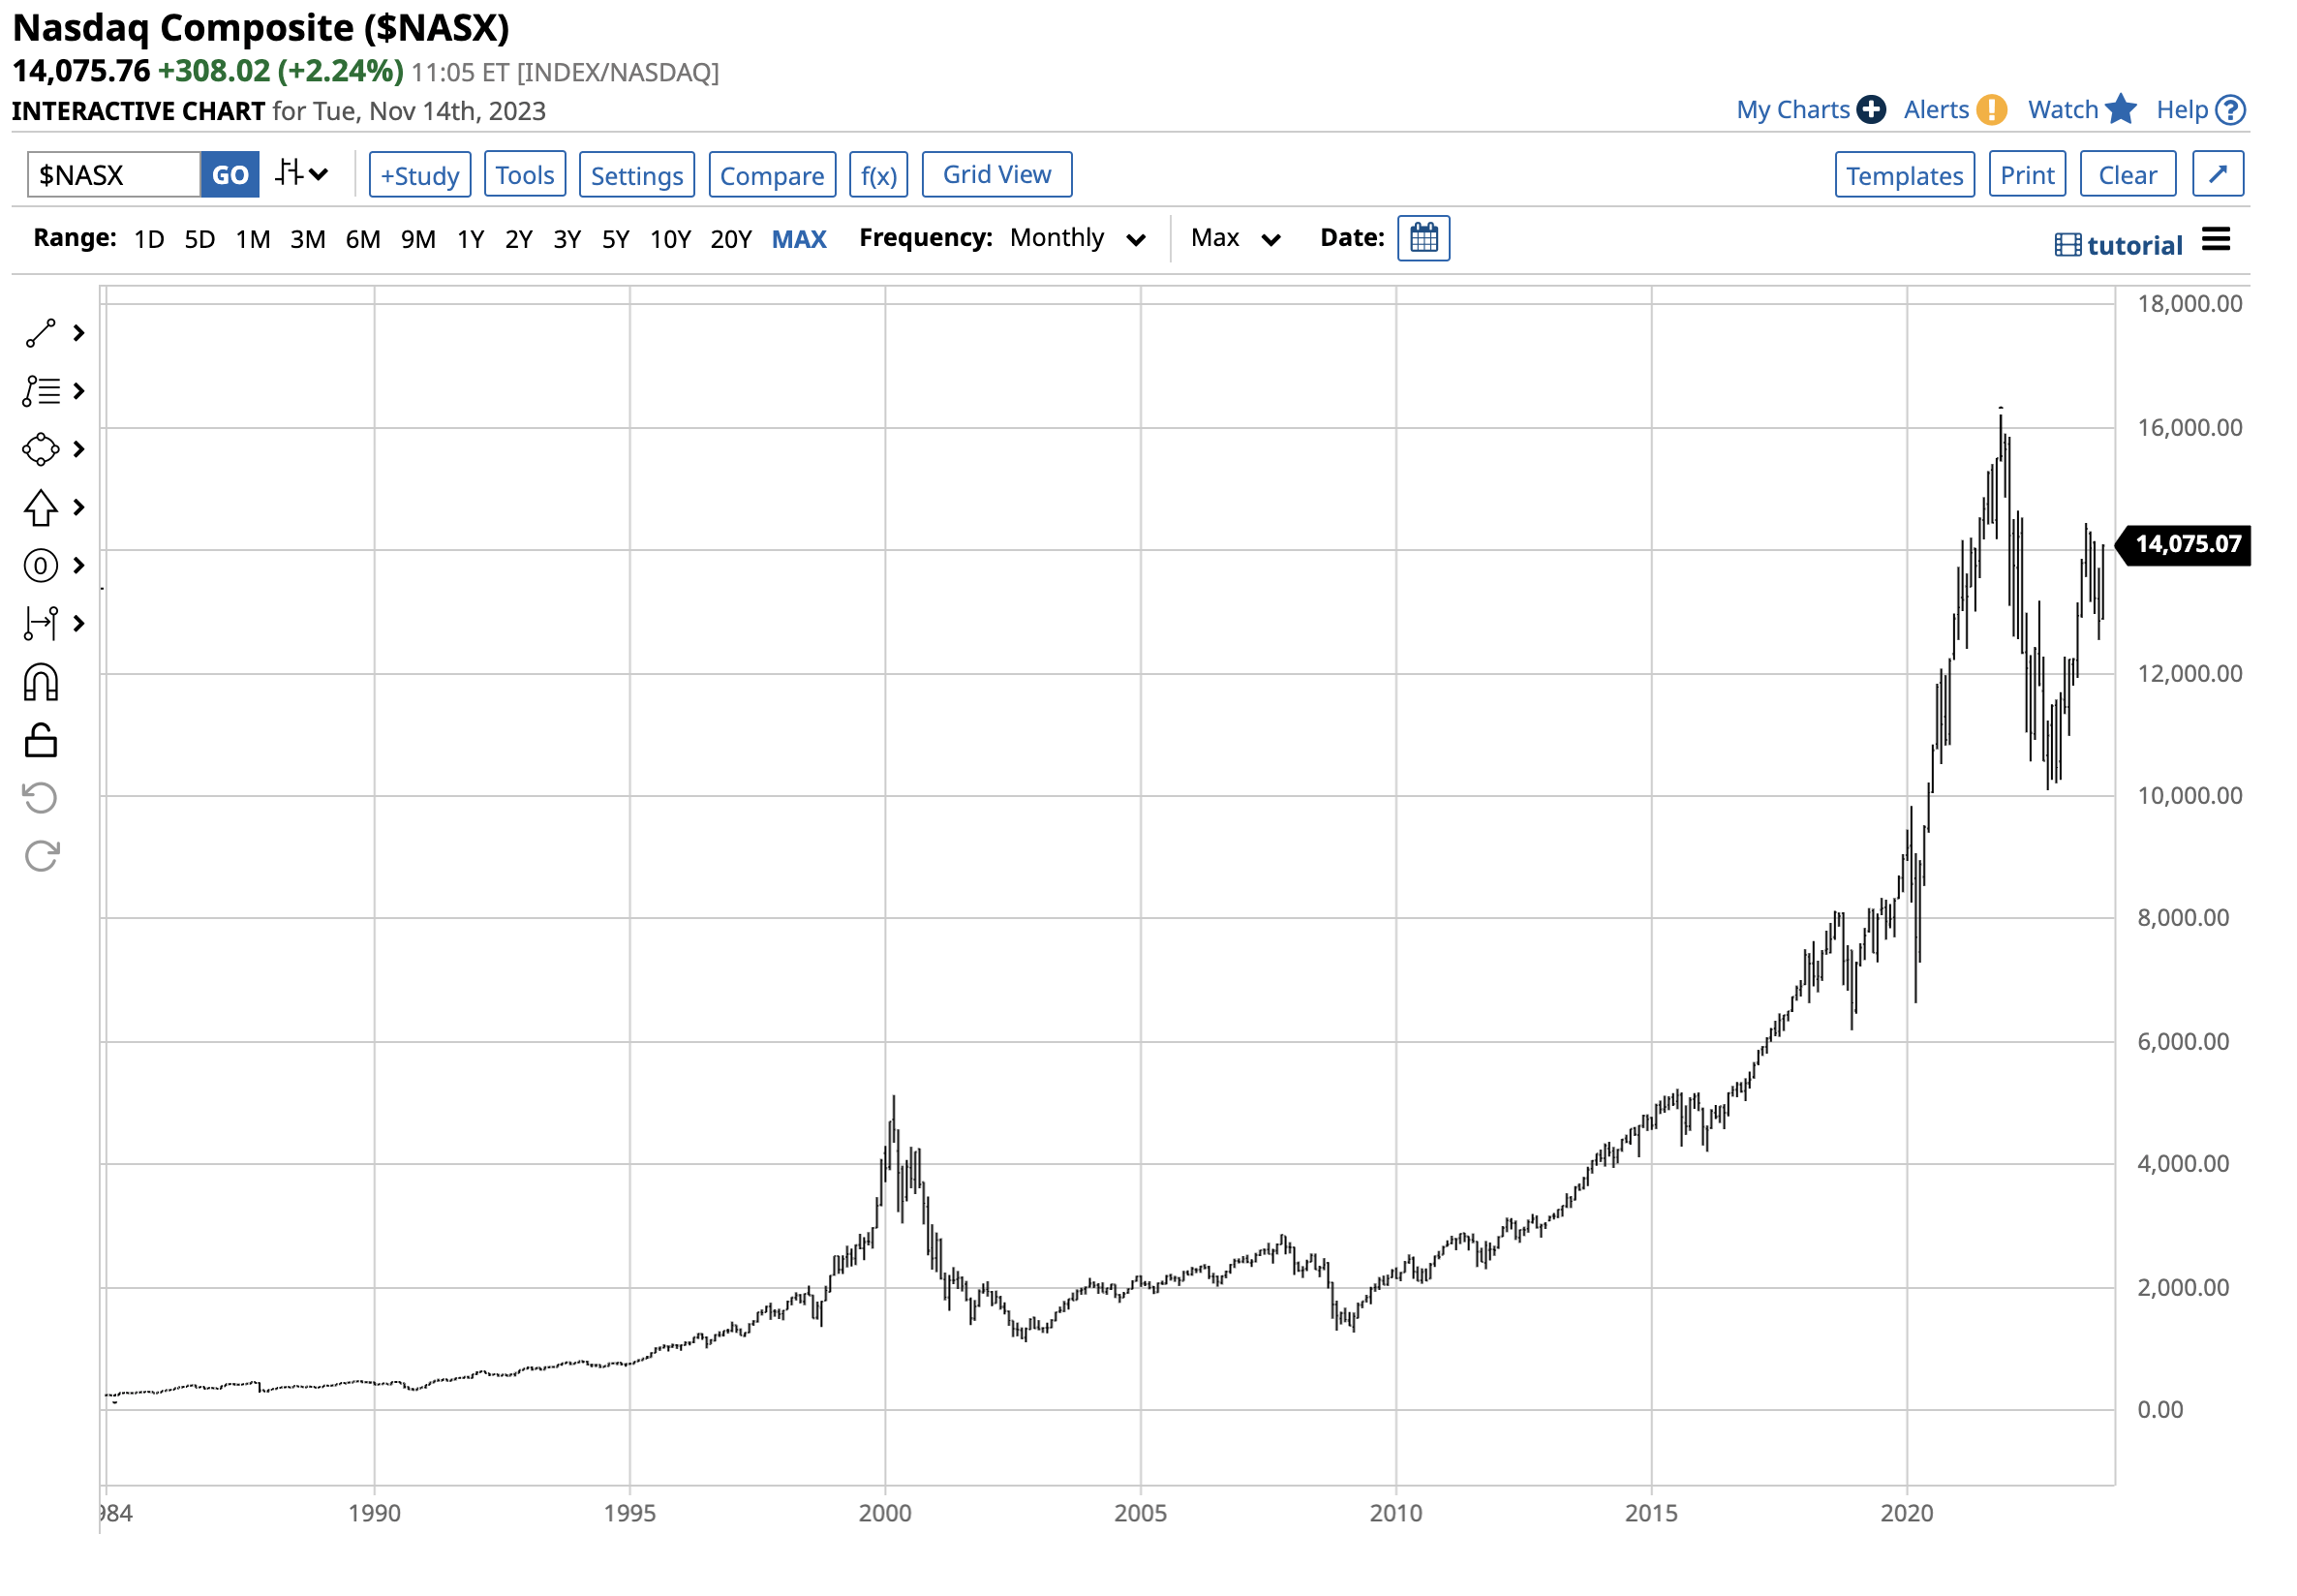
The chart dating back to the mid-1980s shows a pattern of higher lows and higher highs in the technology index.
The Invesco QQQ ETF began trading on March 10, 1999.
Long-Term Chart of the QQQ ETF Product (Barchart)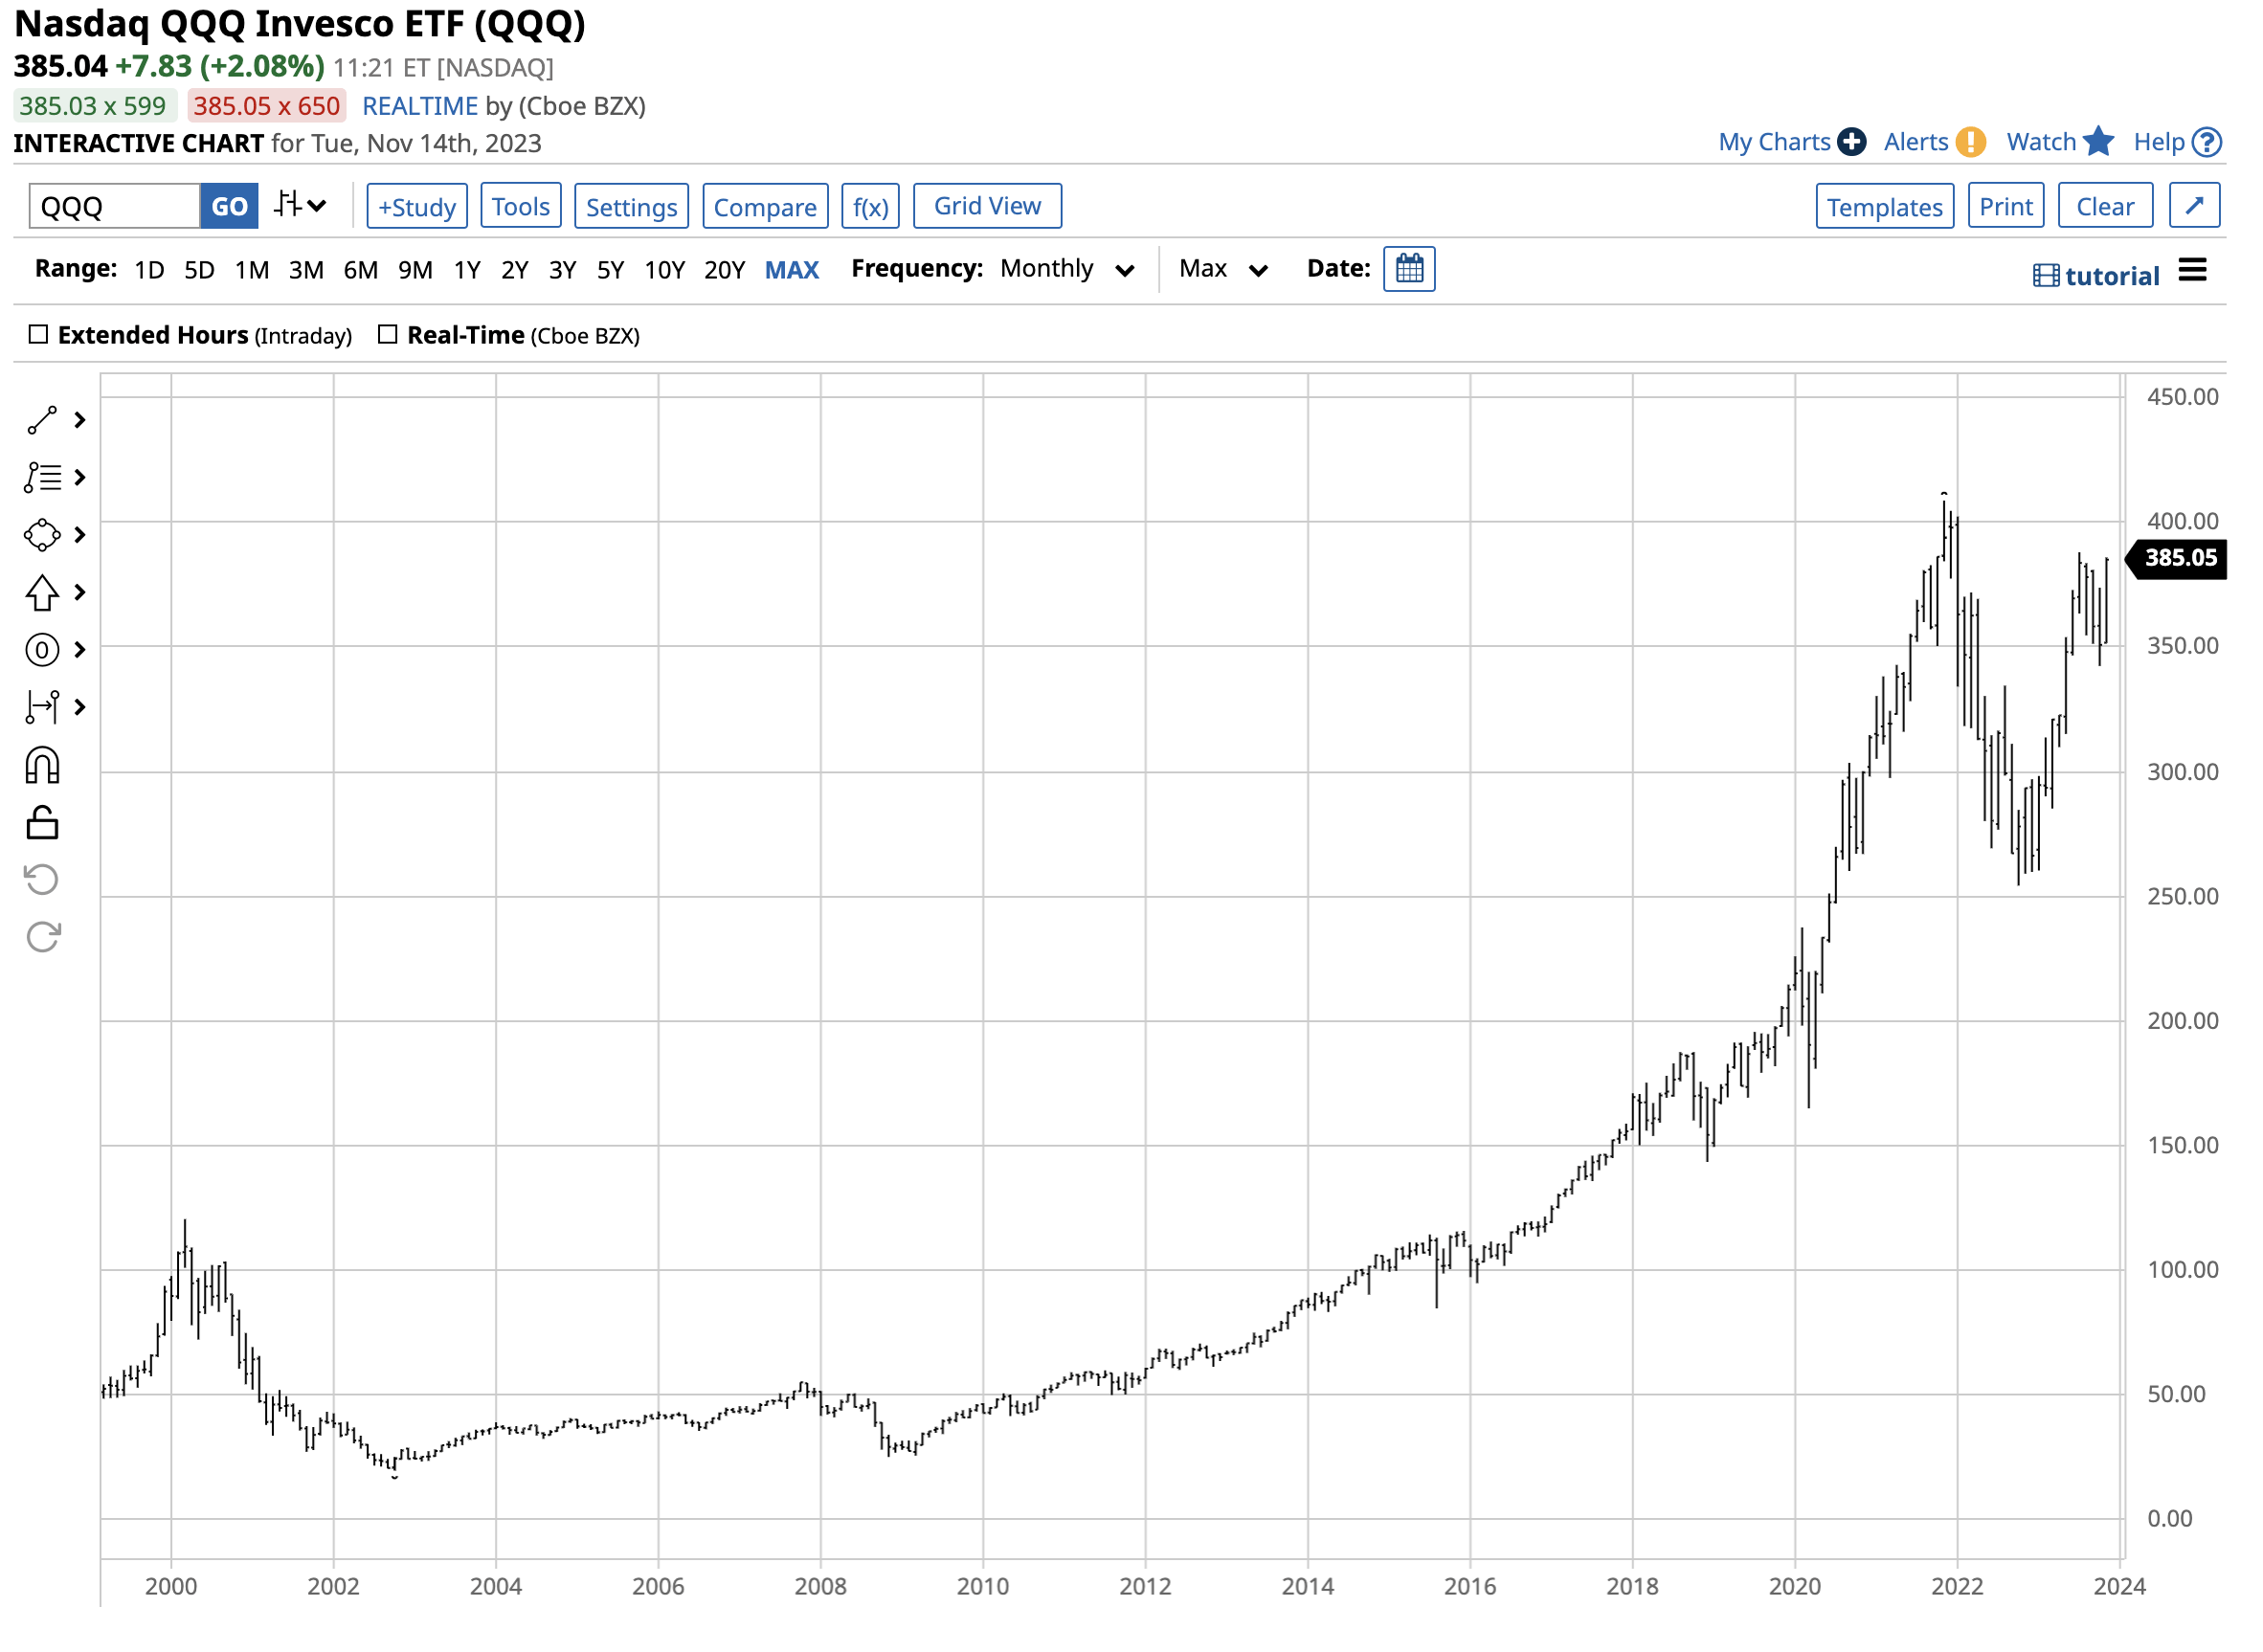
The chart shows that over more than two decades, QQQ has made higher lows and higher highs, following the NASDAQ-100 index.
At around the 13,780 level on November 14, the NASDAQ-100 remains in a long-term bullish trend. The following factors favor a continuation of higher lows and higher highs in the technology sector:
While the past price performance never guarantees the future, the NASDAQ’s higher volatility and historical trading patterns suggest it will lead a future stock market rally.
QQQ is more volatile than SPY, and the ProShares Ultra QQQ ETF provides double exposure than QQQ. QLD’s profile states:
Fund Profile for the QLD ETF Product (Seeking Alpha)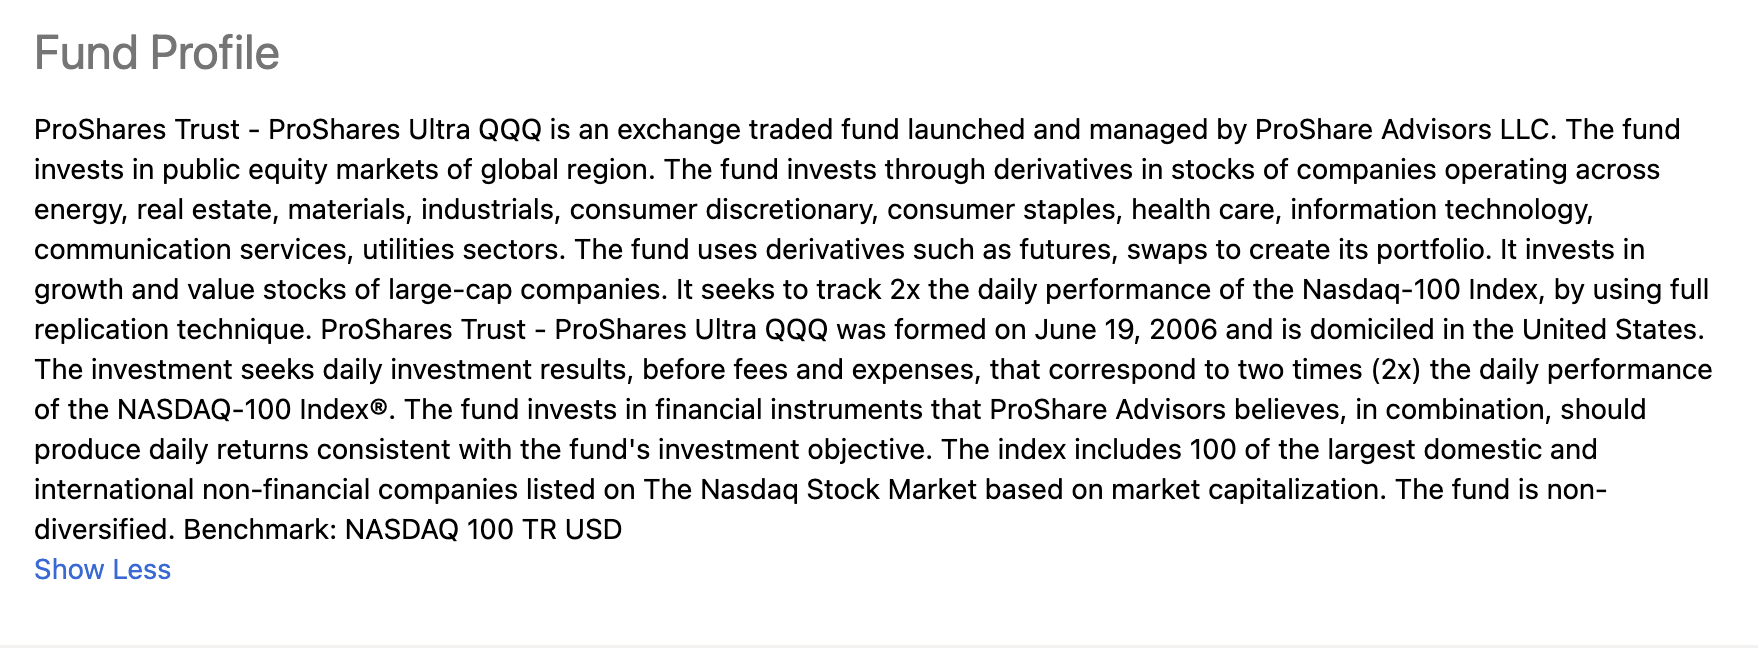
The latest Seeking Alpha ETF grades are:
ETF Grades for the QLD ETF Product (Seeking Alpha)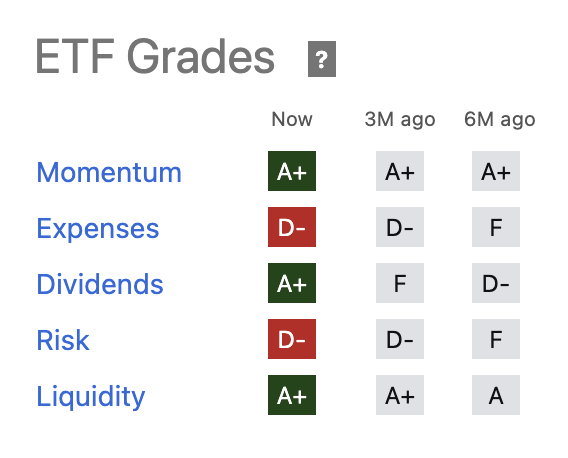
QLD receives the highest possible grades for momentum, dividends, and liquidity. However, D- grades for expenses and risk reflect the ETF’s relatively high cost and that time is its greatest enemy.
At the $67.60 per share level on November 14, QLD had over $4.5 billion in assets under management. QLD trades an average of around 6.166 million shares daily and charges a 0.95% management fee.
QLD is a trading and not an investing tool. QQQ can be effective for medium to longer-term investment positions, but timing is everything when approaching the NASDAQ with the leveraged QLD. If the NASDAQ moves lower or remains static, QLD will lose value as it employs options and swaps to create its gearing.
Meanwhile, QLD will turbocharge rallies in the NASDAQ and QQQ ETF. During the most recent rally that took the NASDAQ-100 43.1% higher from the October 2022 low to the July 2023 high, the QQQ ETF rose from $254.26 to $387.98 per share or 52.6%, as the QQQ outperformed the index.
Two-Year Chart of the QLD ETF (Barchart)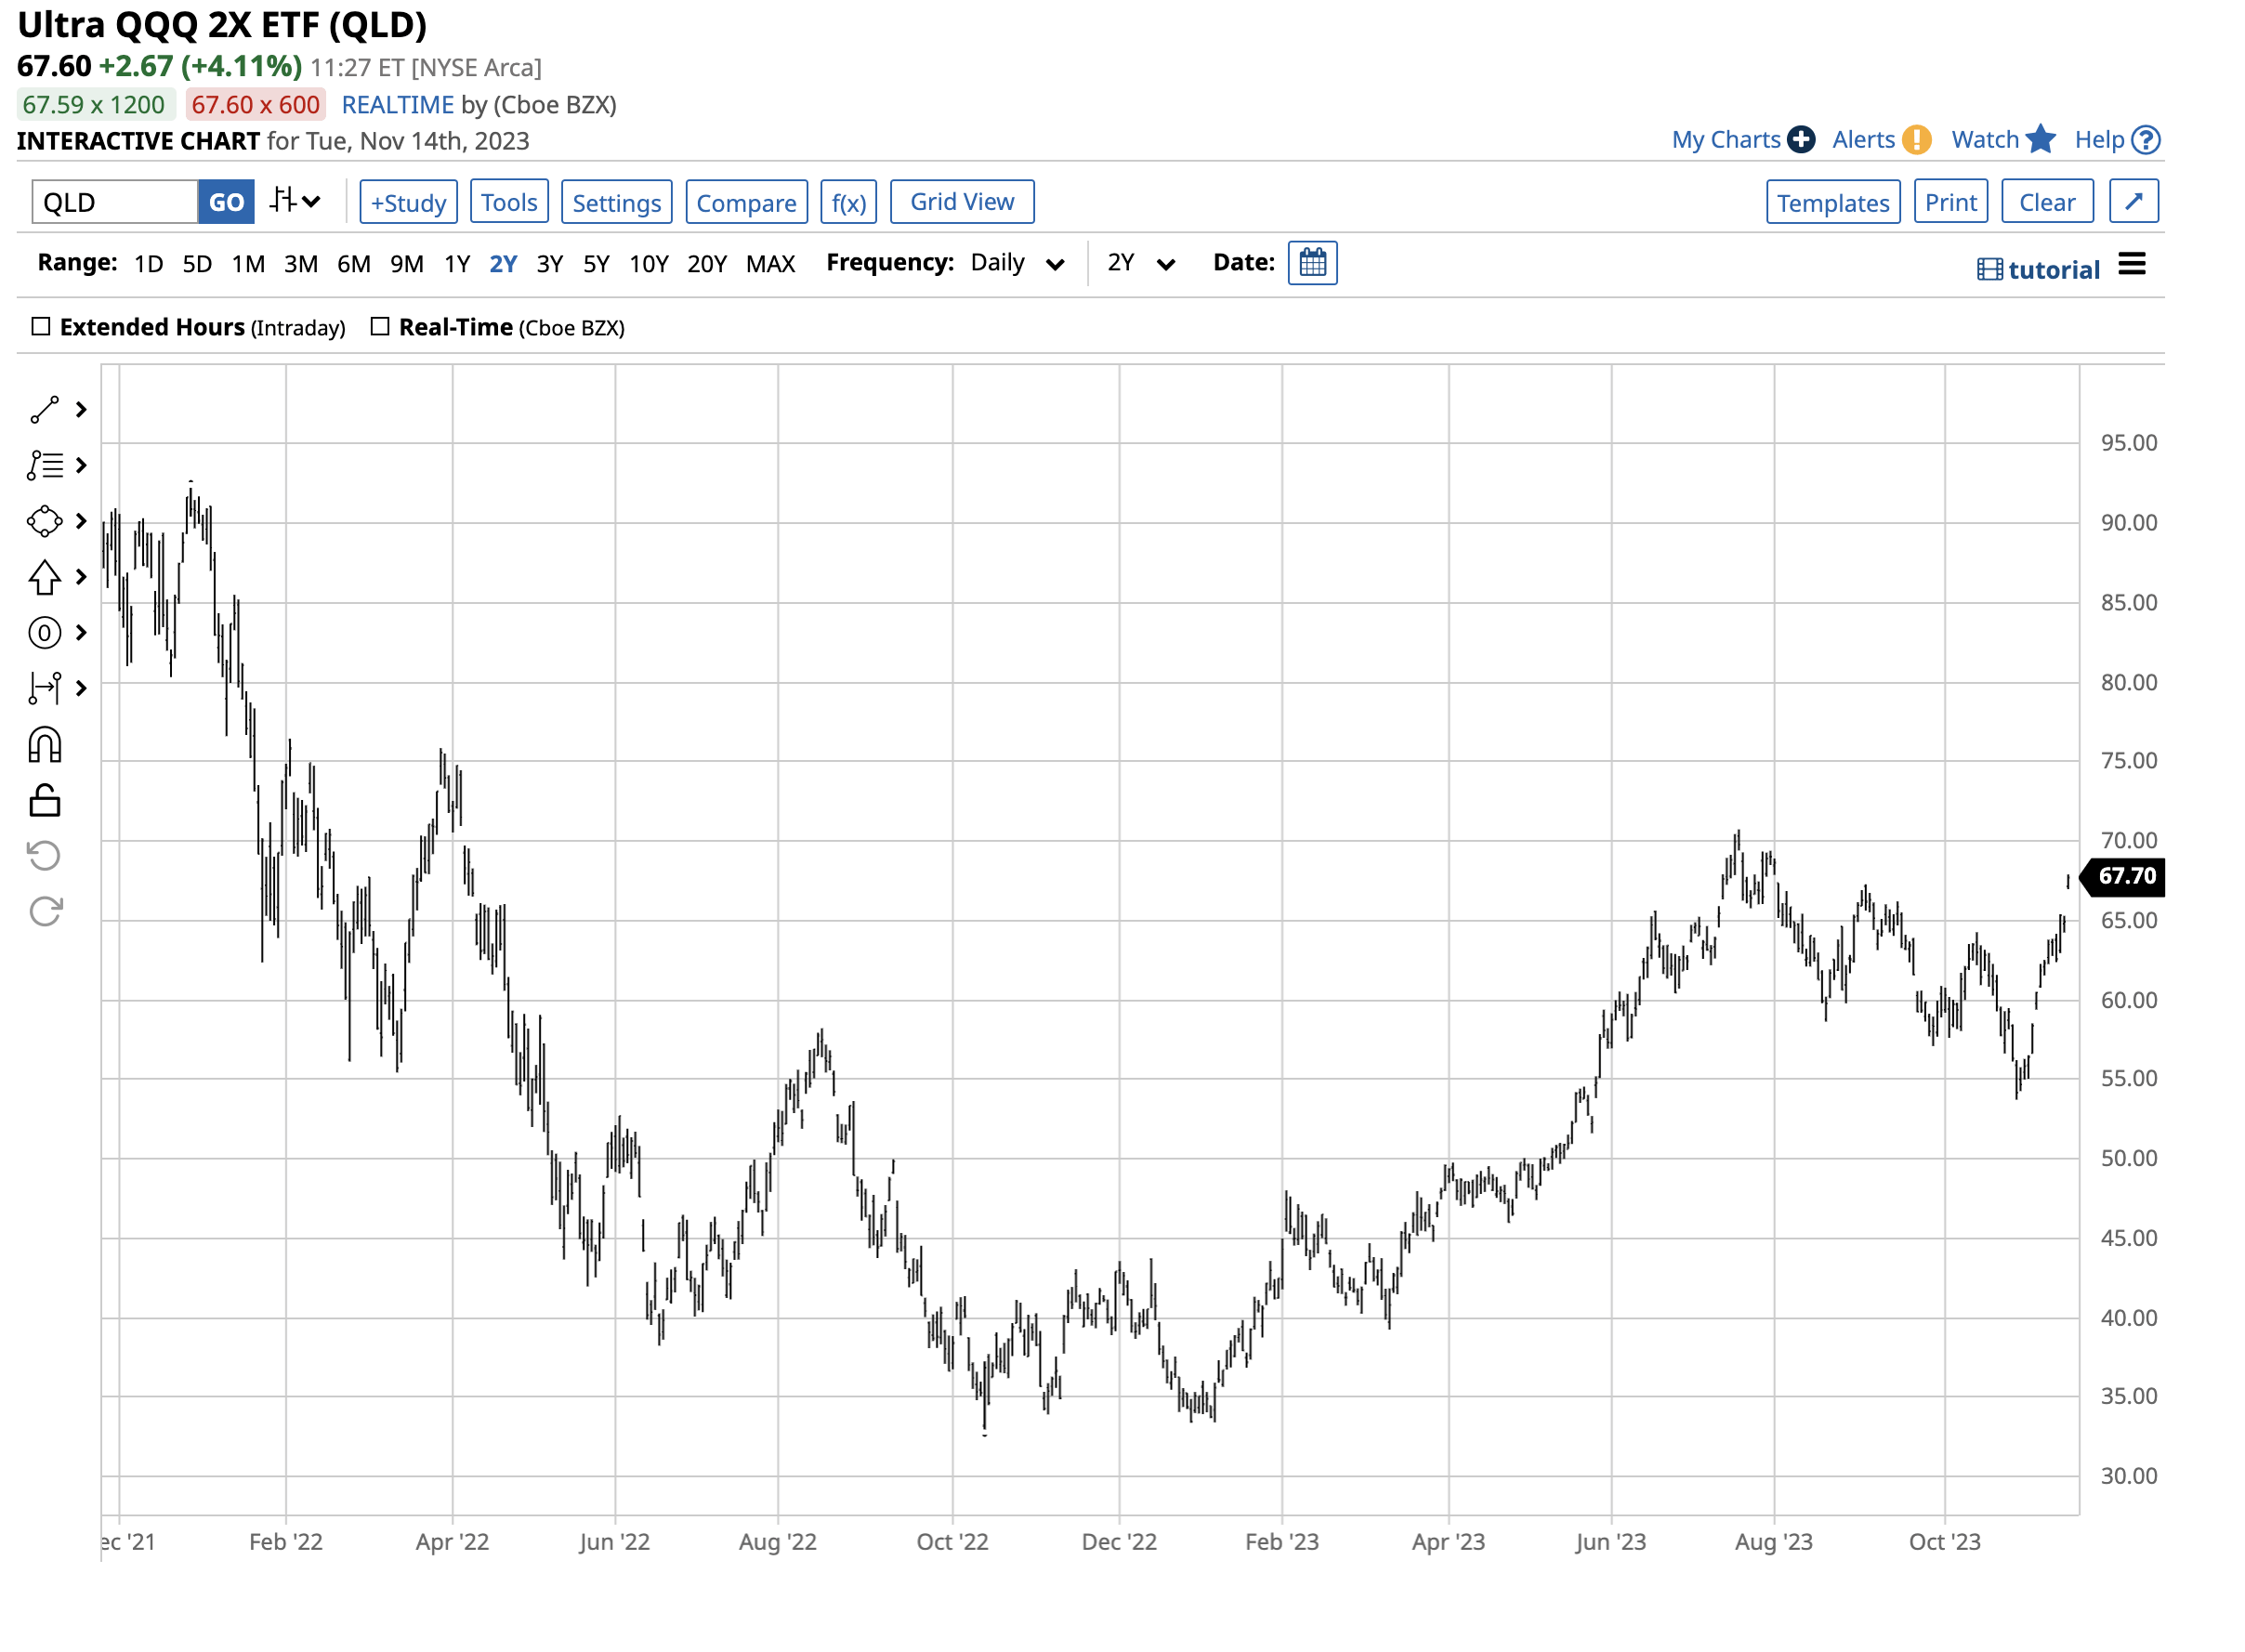
The chart shows that QLD rose from $32.98 to $70.74 per share over the same period or 114.5%. QLD delivered over double the percentage gain of QQQ.
Leverage exchanges more potential risk for greater potential rewards. QLD can be a valuable tool for market timing in the technology sector, but time and price stops and careful attention to risk-reward dynamics are necessary for success.