
Ivan-balvan
Ivan-balvan
BC Partners ("BCP") created Portman Ridge Finance Corporation ("PTMN") by purchasing several underperforming BDCs to sell off the Legacy investments and replace them with Core MM Loans to borrowers with EBITA between $25m - $50m (“Portfolio Optimization Process”); The Portfolio Optimization Process is almost completed with Legacy investment only making up 27% of its investments. The process hasn’t come without pain – over the last two years, PTMN incurred realized and unrealized losses of $4.49/share and $2.76/share. Most of the losses were related to its Legacy Investments. As we will go into greater detail, PTMN originated Core MM Loans are performing well. PTMN trades at a 15% discount to NAV and a sustainable dividend yield of 14.5%; If BCPC successfully builds out its Core MM Loan platform and its loans continue to perform well, PTMN could be an attractive investment opportunity.
Roughly two years ago, I wrote an article on PTMN and Logan Ridge Finance Corporation (“LRFC”), two BCP, a $40b international private equity fund with a $8 billion private credit platform specializing in originating core middle market senior secured floating rate loans to borrowers with EBITDA between $25m - $50m (“Core MM Loans”). BCP’s private credit business (“BCPC”) is led by Ted Goldthorpe, CEO, and Patrick Schafer, CIO, who previously ran Apollo’s BDC.
BCPC created PTMN by acquiring four underperforming BDCs (“Legacy BDCs”) over the last few years. At Q3 2023, PTMN had $500m of investments. As I outlined in my previous article, I believed that PTMN was a potential “buy” because it was almost done selling off its legacy investments acquired with the Legacy BDCs (“Legacy Investments”) and replacing them with Core MM Loans from its active origination platform (“Portfolio Optimization”). While I believe my overall thesis was right that once the Portfolio Optimization process is completed, it will be a strong new entrant in the BDC space, with access to an active origination platform and a strong risk-adjusted investment portfolio, however, I underestimated the amount of credit risks still in the Legacy Investments portfolio, and (y) how long it would take BCPC to complete the Portfolio Optimization process.
BCPC’s Portfolio Optimization process is almost completed. Legacy Investments are only 27% of total investments, and PTMN sold or wrote off much of the troubled Legacy Investments. With the stock trading at 85% of its NAV, and a sustainable dividend of $0.69 (14.5%), PTMN presents an interesting investment opportunity.
In this paper, I will look at PTMN’s performance over the last two years and try to explain why:
You can’t read Bloomberg, WSJ, or any private credit trade paper without reading about some large established investment firm completing a capital raise of a $1 billion or more. I get confused about the total capital raised because the number is so large, but I believe the industry has raised roughly $1.7T, which the vast majority is allocated to large middle-market loans. As I understand it, a limited amount of capital has been allocated to Core MM Loan platforms over the last few years. The lack of new capital in the space limits the competition among lenders. These large investment firms, Ares, BlackRock, Blue Owl, etc., have so much money to invest they need to concentrate on the larger MM loan sector since the Core MM sector is too small. Golub states that they can commit to originating loans up to $2b and hold up to $700m.
I think Michael Forman, CEO & Chairman of FS KKR Capital Corp (“FSK”) summarized the status of the large middle market sector in the Q3 2023conference call:
“At the same time, we are seeing some pressure on spreads in the upper end of the middle market, as spreads have tightened by 25 to 50 basis points during the quarter. With private equity funds holding more than $2 trillion of dry powder, we continue to believe sponsors will utilize private credit solutions to finance transactions.”
The Core MM Loan market gives investors a better risk-reward than larger middle-market loans. Core MM Loans have stronger credit protections (Chart 2), lower leverage levels (Chart 1), higher yields (Chart 1), lower default rates (Chart 3), and higher recoveries than larger middle-market loans. The downside with Core MM Loans is the limited liquidity in the names. To highlight the benefits of Core MM Loans, PTMN originated loans in Q3 had an average spread over SOFR of 9.12%. A 14% return on senior secured loans is not bad.
Chart 1 - Pennant Park Q3 2023 Investor Presentation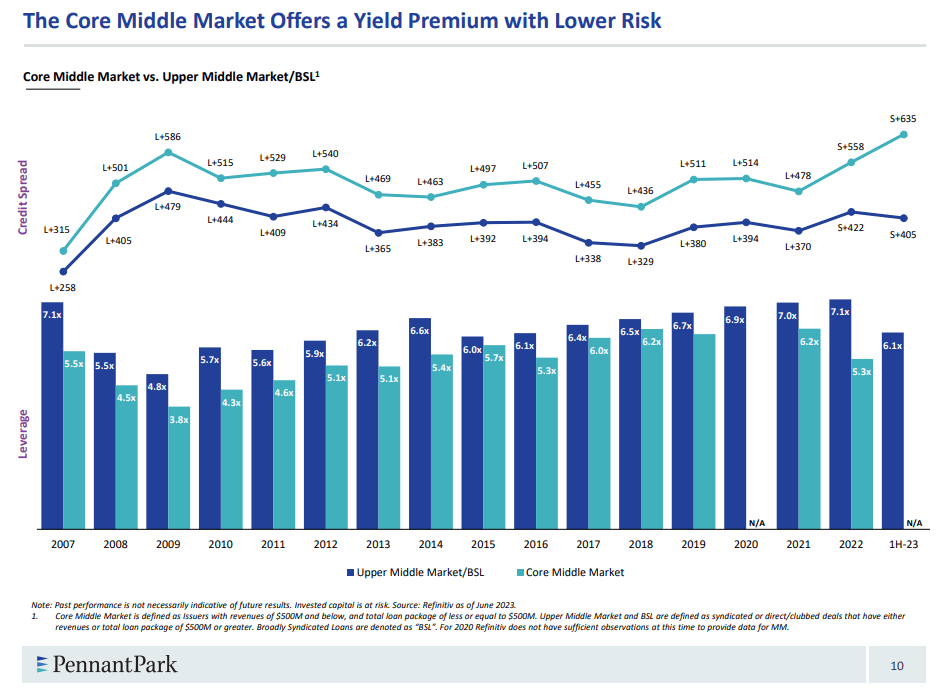
Chart 2 - Covenant Review, a Fitch Solutions Company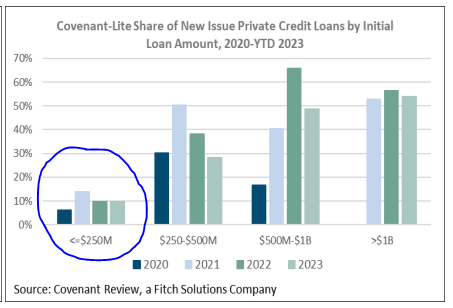
Chart 3 - Source LRFC's Q3 2023 Investor Presentation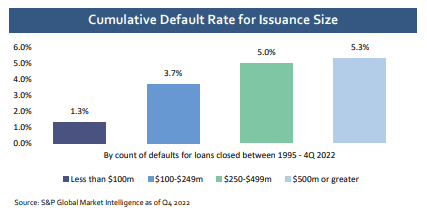
PTMN’s Financial Performance:
I will detail most of the line items below, but I wanted to point out a few things first. Let’s start with the positive - PTMN’s YTD Q3 2023 Core NII of $2.32/share represents a return on NAV of 13%, which is significantly above the average return of other BDCs of 9% (according to BDCinvestor.com). However, the Optimizations Process hasn’t been without pain, PTMN’s NAV has decreased from $28.88 at the end of 2021 to $22.65 in Q3 2023, a reduction of $6.20 or 20%. PTMN’s stock fell approximately 26% during the same period. I am sure that PTMN’s NAV contraction during the period played a major role in its stock performing so poorly.
The two main drivers of the NAV losses over the period were realized losses of roughly $42.2m or $4.39/share and unrealized losses of $26.4m or $2.76/share, which total $68m or $7.15/share. See Chart 5 below for more information.
I detailed the realized losses to better understand what was driving them. Then, I will examine the unrealized losses and try to determine how much of them may be recouped. Finally, I will attempt to analyze the credit quality of PTMN’s investment portfolio.
Chart 4 - produced by the author using information in PTMN's 10Ks and 10Qs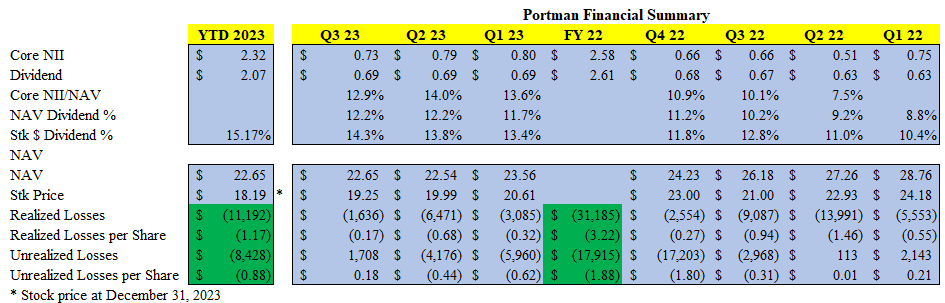
Chart 5 - PTMN Q3 2023 10Q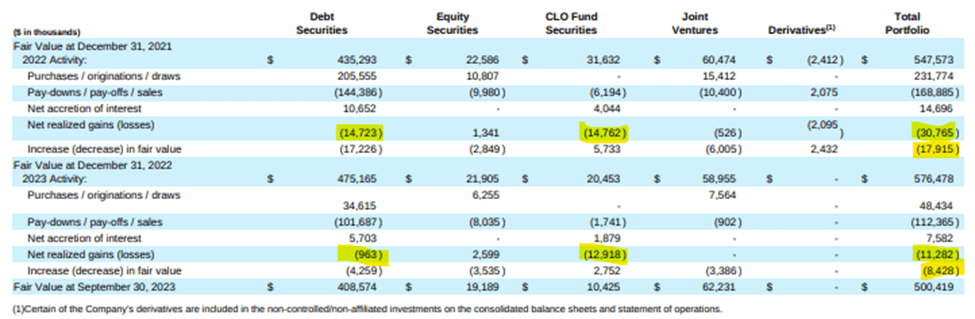
PTMN has actively optimized its investment portfolio, reducing its Legacy Investments, especially the CLO equity portfolio. PTMN has added to its BCPC’s originated Core MM loans and JV Funds. The percentage of Legacy Investments went from 52% at the end of 2021 to 27% in Q3 2023. The JV Funds went from $31m or 6% of the portfolio at Q4 21 to $62m or 12% at Q3 23. The JV Funds invest in Core MM Loans and Unitranche Loans. The JV Fund 2023 yield was around 15%.
Chart 6 - Produced by the author using PTMN's investor presentation materials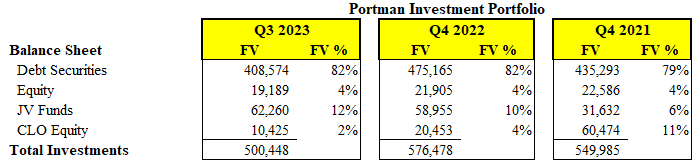
Most of PTMN’s CLO equity portfolio was included in the KCAP acquisition. PTMN did make an opportunistic investment in two CLOs (JMP Credit Advisors IV & V CLOs – (“JMP CLOs”)) in Q4 2021, paying $18.1m, $1.4m in cash and the remainder in PTMN stock. The portfolio went from 11% of total investments in Q4 2021 to 2% in Q3 2023. All the CLOs are past their reinvestment periods and are paying down the rated notes. The CLO equity portfolio will continue to dwindle over the next year or two as the CLOs are paid down and ultimately terminated.
The sales, write-offs, and paydowns of the CLO Equity investments that occurred in 2022 and 2023 (Q3) caused PTMN to incur realized losses of $14.8m and $13.0m, respectively (see Chart 7 below) or a combined $27.8m. The realized losses were mainly related to a few CLOs, Catamaran 2013-1 and 2014-1 and the JMP CLOs. It appears that BCPC’s decision to invest in the JMP CLOs was not a very good decision.
Losses on PTMN's CLO Equity Portfolio (Chart 7 - Produced by the author using information in PTMN 10K & 10Qs )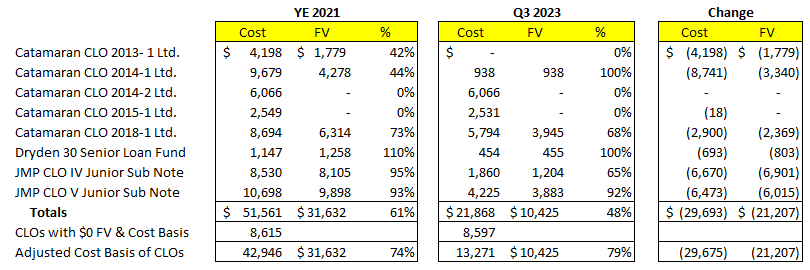
At Q3 2023, the cost of the CLO equity was $21.8m, and its fair value was $10.4m, or 48% of cost; however, most of the difference between the cost and FV is related to two investments (Catamaran 2014-2 and 2015-1) that have a cost basis of roughly $8.6m and a fair value of $0. PTMN wrote these investments down before 2022. The remaining investments trade at 79% of their amortized cost. Doing a back of the envelope calculations, the remaining CLO portfolio is earning roughly 20%. While incurring over $27.8m in realized losses over two years is not good, the CLO portfolio is now only 2% of the fair value of PTMN’s investments. So, any future losses on these investments will have little impact on PTMN’s overall performance.
In addition to the $27.8m in realized losses in its CLO equity portfolio, PTMN had realized losses on its Debt Securities of $14.7m in 2022. Most of these losses were due to sale/write-off a non-performing Legay Debt Security, Grupo Hima, originated by KCAP.
In Q2 2022, PTMN sold most of its non-performing loans. The following quote is from Patrick Schafer, CIO, Q2 2022 conference call:
“Turning to Slide 13. As previewed in our first quarter earnings call, during the quarter, we materially cleaned up our portfolio as a result of the exit of group Yakima (sic - Grupo Hima) in April, which represented 84% of our March 31 non-accrual portfolio on a cost basis. As of June 30, 2022, three of our debt investments were on non-accrual status compared to six as of March 31, 2022, and seven as of December 31, 2021.”
KCAP initially originated the Group Hima Loan, a Brazilian pharmaceutical company, in 2013. At Q1 2022, these loans had a cost basis of $10m and a fair value of $0.54m. Of the $14.7m of realized losses on its Debt Securities incurred in 2022, roughly $9.5m or 65% were related to Grupo Hima. Since the loans had such a small fair value at the time of their sale, PTMN’s NAV was not materially impacted. The unrealized losses were incurred in prior years.
To summarize, PTMN had roughly $42.5m of realized losses since the end of 2021. These losses were related to the CLO equity portfolio ($27.8m) and the sale of a few distressed Legacy Debt Securities (almost $14.7m).
The remaining balance of the Legacy Debt Securities portfolio is just over $100m, or 27% of PTMN’s investment portfolio. PTMN is still having credit issues with some of the Legacy portfolio. In Q3 2023, they put a $7.8m (cost) Legacy Debt Security (GARS originated), HDC/HW Intermediate Holdings, on non-accrual. This one investment represents a third of PTMN’s non-accrual loans. I will dive deeper into PTMN’s underperforming and non-accrual loans later in this paper.
In Q3 2023, PTMN’s cost basis on its investment was $584.6m, and its fair value was $500.4m (86%), creating a total unrealized loss of almost $84.2m or almost $9.00 a share. When I first saw how large the unrealized losses were, I thought something was amiss, either the investment portfolio was under significant stress or something else was causing the large variance. I analyzed each investment to determine which ones had a fair value significantly lower than its costs. I summarized my findings in Chart 8 that follows. PTMN includes the cost basis of investments that it wrote off (zero fair values). The total cost basis of these investments was $49.1m, which reduced the Adjusted Cost Basis of PTMN’s investments from $584.6m to $535.5m.
Of the $49.1m adjustment in unrealized losses associated with the written-off investments:
My accounting skills are certainly not as sharp as they once were. Still, I don’t understand why PTMN didn’t officially write off these investments and recognize the realized losses. PTMN's balance sheet would be cleaner and more clear, and future realized losses will not be related to losses incurred years ago.
Using the Adjusted Cost basis, unrealized losses are $35.0m, or $3.67/share. Using the Adjusted Cost Basis, which only includes performing investments against their fair values, gives an investor a much more accurate view of the portfolio’s health. Also, it makes comparisons between PTMN’s 93% fair/cost figure and other BDC’s investment trading levels much more useful. PTMN's senior secured loans trade at 95% of cost. Finally, it accurately identifies the amount of unrealized losses that may be recouped in future periods.
Chart 8 - Produced by author using information in PTMN's Q3 2023 10Q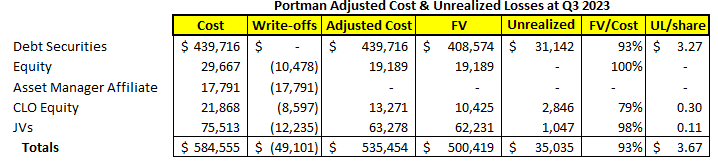
Given the increase in spreads, it is unsurprising that PTMN’s Core MM Loans are trading at a discount of 5%. Since the discount is relatively small, it is hard to draw any conclusions about the credit quality of the Senior Secured Loan portfolio.
PTMN’s Debt Securities portfolio is marked at 93% of the Adjusted Cost Basis. Absent significant defaults, PTMN should be able to recover some of these unrealized losses either through credit spreads tightening or because of the pull to par as the loans age or mature.
Unrealized losses act as a loan loss reserve, as actual credit losses are incurred. As loans default, the fund’s NAV may not be negatively impacted since the projected losses were already baked into its NAV (assuming that the sale/recovery is close to the investment’s fair value). So, we need to determine whether the unrealized losses are sufficient to cover future defaults.
To understand how robust the loan loss reserve (unrealized losses) is, I did a quick analysis. At Q3 23, excluding the fair value and cost of the non-accrual loans of $8.2m and $20.1m, respectively, PTMN’s Debt Securities have a fair value of $400.4m with a cost of $419.6m. Assuming no additional defaults, the $19.2m of unrealized losses represents an incremental NAV of roughly $2.00/share. If PTMN had a 15% default rate with an average recovery rate of 70%, it would incur roughly $18.9m of credit losses, less than the unrealized losses of $19.2m.
Obviously, I don’t expect PTMN to incur a default rate of 15%, so a significant portion of the unrealized losses should be recouped over time.
PTMN has two investments in JV Funds, the Legacy KCAP Freedom 3 LLC (“KCAP JV”) and Series A-Great Lake Funding (“Great Lake JV”). The KCAP JV is a Legacy investment since KCAP originated the investment. As you can see below, most of the unrealized losses on the JV Funds are related to the KCAP JV. While it took me a while to figure out the KCAP JV’s structure, it owns 100% of the equity of Great Lakes KCAP F3C CLO (“KCAP CLO”). The CLO is outside its reinvestment period and is paying down the rated notes. It appears to be doing okay, but it has not made any distributions to equity over the last two quarters of 2023 and the first quarter of 2024. As the CLO continues to pay down, the value of the equity will continue to fall. If PTMN held the CLO equity directly instead of via the KCAP JV, the cost basis of the investment would be reduced as payments are received (sort of like a loan that is amortizes down as P&I payments are made). Therefore, most of the unrealized losses on this investment won’t be recouped.
The Great Lake JV is structured like most other BDC JV structures and performs well. Based on my back-of-the-envelope calculation, the JV Funds earned a combined 15% yield in 2023 (Q3).
Chart 9 - Produced by author using information in PTMN's Q3 2023 10Q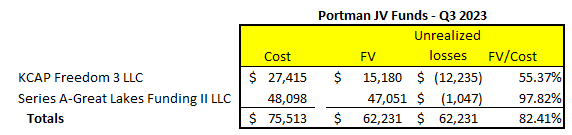
It is hard to underwrite a BDC’s investment portfolio since an investor has no information on each investment. An investor must look at the information the BDCs publish: their underperforming and non-accrual investments and the cost and fair value of each investment. This information, combined with a BDC’s performance history (realized losses), should give an investor a good feel for how the portfolio should do over time, especially going into a period of elevated defaults. I will analyze this information to determine the credit quality of PTMN’s debt securities.
Like many other commentators, I believe leverage loan default rates will pick up this year as higher interest rates start to take their toll on borrowers. S&P had the highest number of credit estimate downgrades since Q2 2020 (Covid), which pushed private credit CLOs to have 17% exposure to CCCs. While there is credit deterioration, defaults are still contained. According to S&P, the trailing 12-month default rate for borrowers with S&P credit estimates increased by 6bps to 4.6% (FY 2023), which is very similar to the BSL default rate. The report also noted that 8% of private CLO collateral is PIKing.
Chart 10 - PTMN's Q3 2023 Investor Presentation - slide 12
What does this mean for PTMN? PTMN has seen an increase in their underperforming loans over the last year, 4.3% in Q3 2022 to 6.5% in Q3 2023 and non-accrual loans, went from 0.3% to 3.6% (cost basis). I would expect this trend to continue. While there isn’t much information published on BDC’s non-accrual rates, I believe 6.5% is in line or slightly above other BDCs.
To understand the credit quality of PTMN’s Debt Securities, I created my own list of underperforming loans. My list of underperforming loans, which represents 6.0% of Debt Securities, aligns with PTMN’s reported 6.5%. I downloaded PTMN’s loan portfolio for Q3 2023 and identified all the loans (i) trading at less than 80% of cost, (ii) non-performing (iii) originator of identified loans (best guess), and (iv) that a majority of interest is accruing via PIK.
Chart 11 - Produced by the author using PTMN's Q3 2023 10Q Chart 12 - Produced by the author using PTMN's Q3 2023 10Q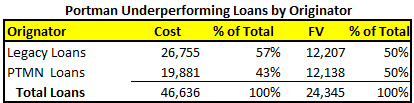
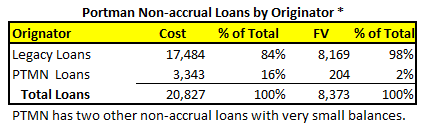
As you can see in Chart 12 above, most non-accrual loans are Legacy Loans; however, the PTMN-originated loans are nearly worthless, with a fair value of 2%. The underperforming loans are more evenly distributed, PTMN’s originated loans are 43% of cost or 50% of fair value. Again, the fair value of PTMN originated loans is lower than Legacy Loans. On a fair value basis, the underperforming and non-accrual loans represent 8% of its Debt Securities.
To complete my analysis of potential problems within PTMN’s loan portfolio, I looked at the loans that most of their interest is earned via PIK. The following loans are performing and trade at 92% of cost (see chart 13). Given their fair values, I can’t say these loans are underperforming, but they are worth tracking. I will review these loans when PTMN publishes its Q4 2023 results.
Overall, PTMN’s originated Debt Securities are performing well. Underperforming and non-accrual loans have been picking up over the last few quarters, but I believe this is consistent with most other BDCs. They haven’t reported any meaningful realized losses in 2023, but we will see what happens in Q4 2023.
Chart 13 - Produced by the author using information form PTMN"s Q2 2023 10Q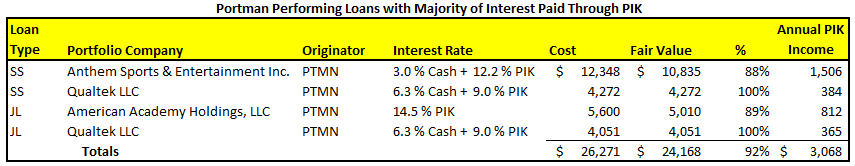
PTMN’s Core NII for the three quarters ending Q3 2023 was $2.32/share, compared to $1.92 for 2022, an 8.2% increase. Its quarterly dividend of $0.69/share also increased from its $0.62/share dividend for Q4 2021, an 11% increase. As stated before, PTMN has the highest dividend yield based upon stock price of 15.2% and one of the highest dividend yield/NAV of 12.2%, both calculated at year-end 2023. In this section, we will look at why PTMN’s dividend yields are so high and whether they are sustainable.
Given that the stock is trading at a significant discount to its NAV (20% at the end of 2023), it is no surprise that its yield was over 15%. PTMN’s 12.2% NAV yield can be explained by the fact that its investments are marked at 93% of cost. The dividend yield on an Adjusted Cost Basis is 10.5%. This figure gives the investor a better understanding of the return on performing investments.
Core NII has been increasing since Q1 2022, mostly driven by the increase in SOFR and the widening of credit spreads. PTMN’s Core NII for the first three quarters of 2023 was $2.32/share compared to $1.92/per share for the same period in 2022, an increase of 8.3%. PTMN has been able to do this while its NAV decreased by 21.65%.
PTMN’s Core NII/share was $2.32 for the first three quarters of 2023, and they paid out $2.07 in dividends. The dividend coverage ratio was 112.1%, which is up from 107.5% for 2022, a 4% increase. While PTMN has not declared any special dividends in 2023, they do have $0.25 available; plus any excess of Q4 Core NII over the Q4 dividend, to declare a special dividend. If PTMN can repeat its Q3 NII of $0.73, they would have $0.28 to declare a special dividend.
To get a better picture of the dividend coverage, I am going to look at how a decrease in SOFR will impact Core NII. Like most BDC’s, PTMN’s balance sheet is relatively interest sensitive. Since 90% of PTMN’s debt securities are floating rate, its interest income is highly dependent on fluctuations of short-term interest rates. The assets in its JV Funds and CLOs are also almost 100% floating rate. Unfortunately, most of PTMN’s debt is floating rate, except for its 4.875% fixed rate note.
Using PTMN’s interest sensitivity schedule in its Q3 2023, see Chart 14 below, for each 200bps decrease in SORF will reduce its NII by $3.4m a year or $2.6m for 3 quarters. Given PTMN’s Q3 YTD Core NII was $22.2m or $2.32/share and its dividend was $2.07, a 200bps increase in SOFR would reduce its Core NII to $19.6m or $2.06/share, which is almost the same as its dividend. So, all things being equal, PTMN’s current dividend would still be covered if interest rates decrease by 200bps.
Interest Rate Sensitivity (Chart 14 - From PTN's Q3 2023 10Q)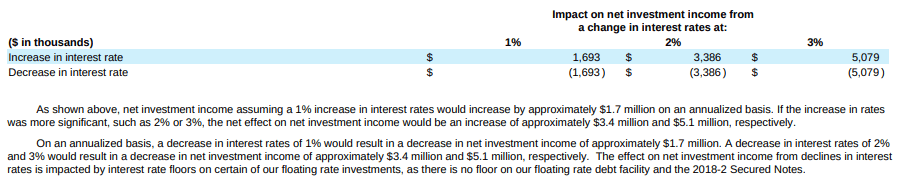
One thing investors should look at for all BDC’s is the percentage of interest income coming from PIK. For the 9 months ended at September 30, 2023, PTMN reported $4.9m of PIK interest, which represents 8.5% of total interest income of $58.5m.
The last thing I want to highlight is PTMN’s Stock Repurchase program. I have noticed that many BDCs with significant discount to NAV don’t have robust stock repurchase programs. Jadedly, I believe this is because managers get paid based upon assets under management, so they are incentivized to purchase new investments instead of deploying the capital in the most efficient manner possible, i.e., stock repurchases. So, I was pleased when I saw the details of PTMN’s robust stock repurchase history over the last two years.
While repurchasing almost 300k of shares over two years doesn’t make a huge impact on the share outstanding or the stock price, I do give BCPC credit for trying to reduce PTMN’s discount to NAV. There is still about $8m of cash available under the board’s stock repurchase program. Given the high spread on new investments, S + 9.17, I believe BCPC would rather invest in new loans than repurchasing stock at this point.
Chart 15 - created by the author using PTMN's Q3 2023 10Q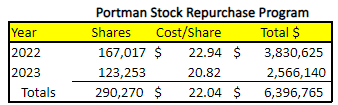
PTMN presents the classic choice between investing in BDCs with lower dividend yields, stable NAVs, limited stock discounts to NAV, and little chance of significant capital appreciation and with higher dividend yields, larger discounts to NAV, more NAV volatility, and a chance of capital appreciation. However, PTMN poses a slightly different choice. If PTNM’s Core MM Loan portfolio continues to perform well, and they can stabilize PTMN’s NAV and continue to have a strong dividend yield, the stock should start trading much closer to its NAV. As I have shown, PTMN’s realized and unrealized losses over the last two years are concentrated on Legacy Investments and its non-core CLO equity investments. So far, its originated Core MM Loans are performing well.
Investors still need to worry about the CLO equity portfolio and the KCAP JV Fund.
BCPC is building out a strong Core MM loan origination platform led by seasoned BDC investors with almost $10b in AUM, which will give it a competitive advantage over time. They are concentrating their efforts on the less competitive Core MM loan space, which allows them to originate loans with all-in yields of 14%, strong covenants, and low leverage. The sustainable dividend yield of 14.5% is very attractive, and the potential upside as the discount to NAV is reduced. Finally, once LRFC is merged with PTMN, the combined entity will have approximately $800m of investments and an improved economy of scale.
I believe PTMN’s success will be determined over the next year or two as the credit market experiences a strong uptick in defaults. If PTMN’s originated loans perform well through the cycle, then they may join the elite BDC managers, and the stock will trade closer to its NAV. Only time will tell, but with a sustainable 14.5% dividend, I am willing to wait.
Editor's Note: This article covers one or more microcap stocks. Please be aware of the risks associated with these stocks.