kynny
kynny
Following my articles on Materialise NV (MTLS) and The 3D Printing ETF (PRNT), I will continue my focus on the additive manufacturing industry by analyzing 3D Systems Corporation (NYSE:DDD). DDD is a US-based company that, despite continuing to generate more revenues than most competitors, appears to be losing its appeal in the market. In my opinion, the Management has carried out poor strategic decisions in recent years, resulting in almost no revenue growth and deteriorating margins. Furthermore, I carried out an analysis of multiples, including exclusively the EV/sales due to the non-profitability of 3D Systems, yielding a target price of $3.8, c.a. 30% below the current price. I believe therefore that DDD should currently be rated as a Sell. In the following sections, I will look at DDD’s business, recent M&A operations, and financial performance, to provide an insightful justification for my unfavorable outlook on the stock.
3D Systems is mainly engaged in four activities: the sale of 3D printers, design of printing materials, maintenance services on purchased printers, and consulting services to help customers optimize the output of their printers. However, almost all of the revenues are derived from 3D printers and printing materials, through two business units: Industrial and Medical solutions. Regarding the geographical origin of revenues, in 9M23 c.a. 58% comes from the Americas, 34% from EMEA, and 8% from the APAC region.
3D Systems achieved its highest-ever revenue of $688m in FY18; since then, it has failed to maintain consistent growth and recorded increasing losses (-$120m only in FY22). For this reason, the company had to look for new sources of liquidity.
In 2020 and 2021, DDD sold Cimatron (the on-demand manufacturing business unit) and Simbionix (its medical simulation business), losing two strategic business areas. The proceeds allowed the company to generate a profit of over $300m in FY21 and to acquire other companies, with a cumulated cash outflow of $272m between FY21 and 9M23. In particular, the management decided to invest $172m (including $103m in cash) in Oqton and $40m in Volumetric.
Both acquisitions, however, have already uncovered challenges: firstly, the Management in Form 10-Q for 9M23 announced the possibility of selling Oqton, given worse-than-expected results on earnings and CF generation. Secondly, I noticed that in the Volumetric acquisition contract, there is a detail to watch out for: the existence of bonuses of up to $355m, which will only be paid at the fulfillment of specific targets by 2030. I believe that, even if the acquisition turns out to be profitable, the achievement of such targets could significantly reduce its positive economic contribution to DDD's financial figures in the short term. Furthermore, Volumetric operates in an early-stage growth industry, and it may be difficult to obtain positive cash flow from this business soon.
If we look at the acquisition/revenue ratio of 3D Systems and its main competitors over the past six years, the results highlight that the strategy is not yielding favorable outcomes.
Companies SEC Filings and Author's Analysis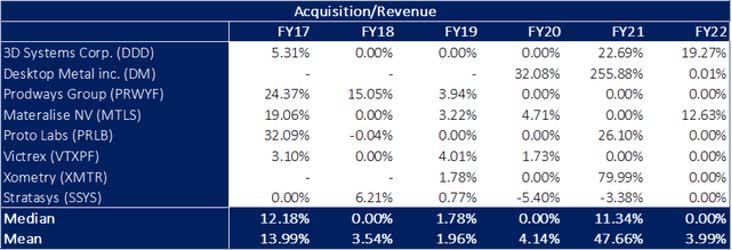
The average DDD acquisition in FY21 and FY22 was higher than the industry average. In particular, the only peers that spent more compared to their revenues are Desktop Metal (DM) and Xometry (XMTR), which are newly founded companies still in an aggressive growth phase. On the other hand, more established companies similar to DDD have reported lower numbers. This review shows that the best-performing companies in the sector mostly rely on organic growth, which is based on internal investments and R&D costs.
DDD SEC Filings and Author's Analysis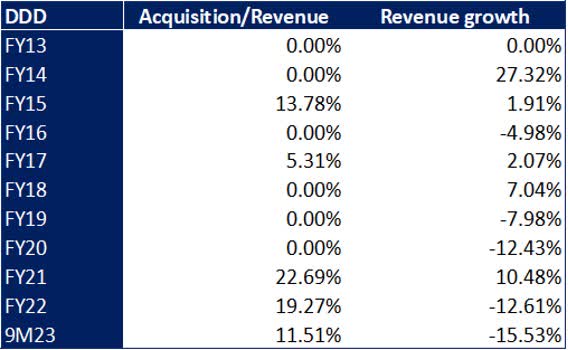
The table above shows that there is no correlation between DDD acquisitions and revenue growth, also taking into account the following year's revenues. This supports my theory whereby DDD's growth strategy is not achieving positive financial results, but rather, negative implications.
Companies SEC Filings and Author's Analysis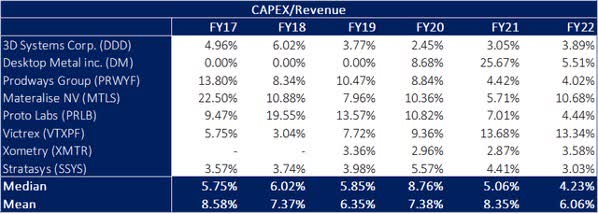
The comparison of Capex between 3D Systems and its peers is crucial as well for the aforementioned thesis. The companies experiencing higher revenue growth, such as Proto Labs (PRLB), Materialise NV, and Desktop Metal, are investing more than the average sample. The only exception is Xometry, which, due to its business model, does not require high capital expenditures, but still falls in line with those of DDD.
DDD SEC Filings and Author's Analysis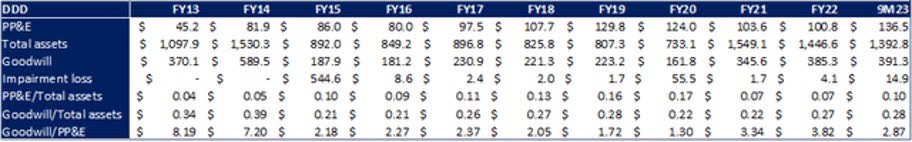
The negative impacts of the past three years M&A operations are once again highlighted by the analysis of DDD assets. The goodwill has increased significantly, almost reaching the FY14 levels, when it incurred a loss of c.a. $0.5B due to impairment. Goodwill currently accounts for 28% of DDD total assets, 6% higher than FY20. The acquisitions, in addition to failing to generate significant improvement in revenues or margins, they not even lead to a substantial increase in PP&E, thus not improving the production capacity of 3D Systems. To summarize then, in my opinion, the only two tangible consequences of Management’s growth strategy in recent years are: the excessive cash outflows and the substantial increase in goodwill, a non-productive asset often associated with overpriced acquisitions.
3D Systems revenues experienced a downward trend between FY17 and FY22, with two major drops: the first occurred in FY20 at $557m (-12.3% compared to FY19), and the second in FY22, at $538m, partially influenced by previous disposals.
According to estimates sourced from Refinitiv Eikon, revenues are expected to further decrease to c.a. $500m in FY23 (-12.3% vs. FY22). FY24 and FY25 are expected to record an upswing, mainly due to the integration of the aforementioned acquisitions. However, I believe that such a full recovery will not be achieved, and revenues will remain significantly below the peak recorded in FY18.
The operating results have also been decreasing since FY17, with a trough experienced in FY22 (EBITDA margin equal to -21.4%). The Management since FY23 has begun to undertake cost rationalization measures to improve marginality, such as the reduction in personnel expenses. These measures are expected to improve EBITDA margin, leading to a -14.0% in FY23 and a positive margin of 3% in FY25. It appears that my theory is supported by analysts' estimates, which suggest that we will not observe positive margins for DDD until FY25 at the earliest.
DDD SEC Filings, Refinitiv Eikon and Author's Analysis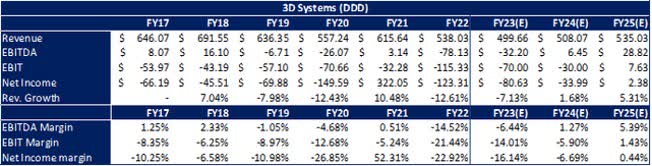
3D Systems had a higher level of debt compared with the industry average. However, in the FY22 annual report, it is reported that most of that (c.a. $460m) regards convertible notes, with an effective rate of 0.594% expiring in November 2026. In my opinion, this financing was a great move by Management, as it was carried out in November 2021, when the shares were trading at c.a. $22; hence, a conversion price of $35.9 per share has been granted. As the shares are currently trading below $5, and it is highly unlikely that the notes will be converted, they successfully secured financing at very favorable terms. Overall, I believe that DDD's balance sheet situation is currently not a major concern.
Companies SEC Filings and Author's Analysis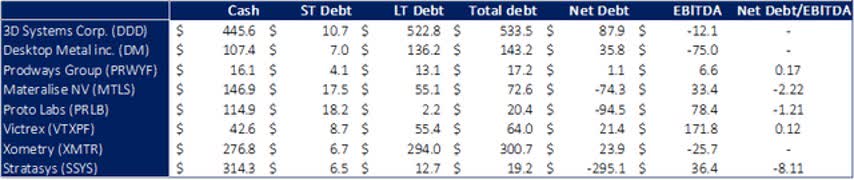
However, the cash outflows experienced in recent years could in my opinion be a concern in the medium to long term. DDD achieved a free cash flow of -$6m between FY21 and 9m23, despite a net monetary inflow of $148m from M&A operations and Capex of only $61m. I believe that such a large amount of cash burned, regardless of the several efforts undertaken to turn the situation around, is a sign of a lack of value-adding ideas.
DDD SEC Filings and Author's Analysis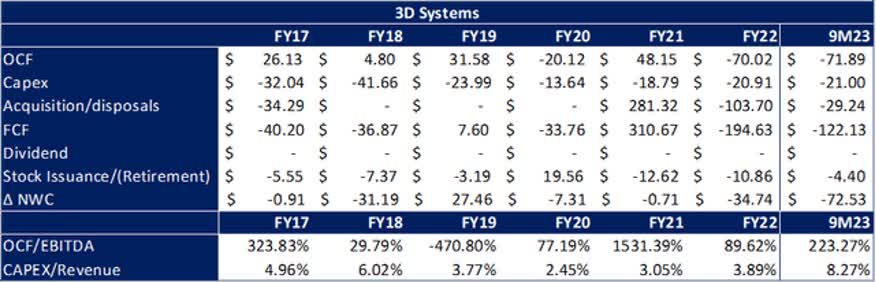
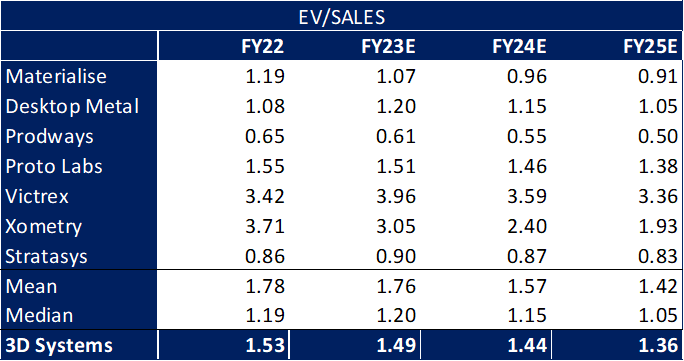
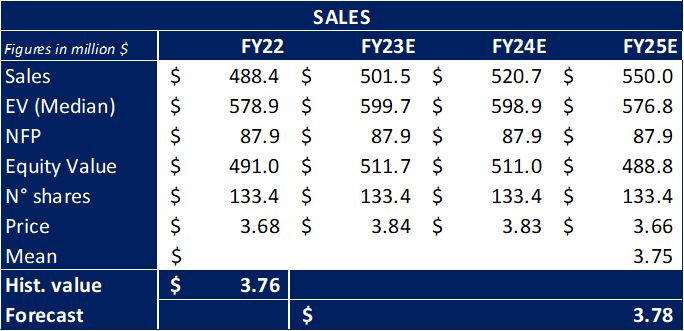
Due to 3D Systems’s current unprofitable state, I was not able to perform either a DCF analysis or a multiples analysis with conventional earnings-based ratios. I obtained therefore an indicative target price solely through the EV/Sales analysis of the companies in the sample. The result is a share value of $3.8, c.a. 30% below the current price. The relative valuation of its peers supports my belief that DDD is currently overpriced.
Companies SEC Filings, Refinitiv Eikon and Author's Analysis Companies SEC Filings, Refinitiv Eikon and Author's Analysis Companies SEC Filings, Refinitiv Eikon and Author's Analysis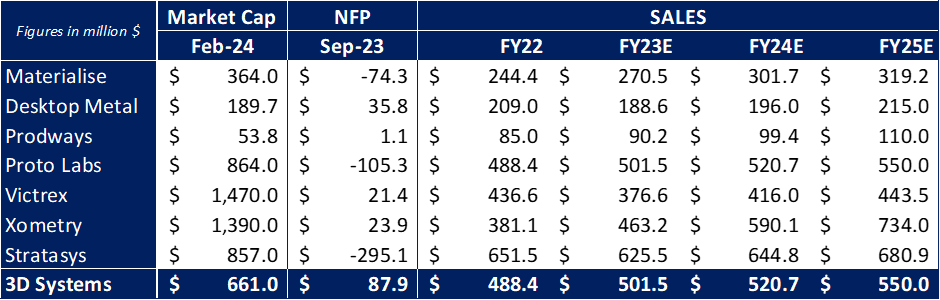
There are currently companies in the additive manufacturing industry that have experienced much stronger revenue growth and margin improvement than what DDD has recorded over the past decade. The M&A operations undertaken over the past 3 years have not produced the desired results, and to me, they do not seem likely to bring results in the coming years either. The Management, in the 9M23 financial results report, announced a restructuring plan to save c.a. $45/55m in operating costs, not enough to return to positive territory by the end of FY24. In my opinion, DDD will only be able to recover through adequate integration of recent acquisitions, higher CAPEX expenses, and a focus on specialization in a specific segment, as many competitors have done. Until these objectives are met, based on the analysis conducted, my rating for DDD would be a Sell
Editor's Note: This article discusses one or more securities that do not trade on a major U.S. exchange. Please be aware of the risks associated with these stocks.