
FilippoBacci
FilippoBacci
Thematic ETFs rose to power during the height of the pandemic era as investors piled in on broad-based bets on various sectors and/or industries. The party was short-lived, however. The hangover quickly set in at the beginning of 2022 and continued whilst equity markets endured their largest drawdowns in decades.
The highly correlated nature of these instruments also meant their diversified nature served no additional benefits to the protection of risk capital. This was especially true for highly concentrated tech EFTs spanning across all points of the technology/communications value chain. Many were simply quasi-replicas of each other, following similar if not identical benchmarks and offering no manager skill or asset diversification. In these names, you have a form of smart beta with a sector/thematic tilt, providing levered exposure to the underlying theme via portfolio concentration.
And in that case, those wishing to be long, "the internet", say, with tight risk parameters, will face greater price risk in market drawdowns. But the opposite is true when the market's character is risk on.
The Federal Reserve's decision to pause its policy rate hiking cycle has proven to be a bullish catalyst for equities in the short term. Benchmark indices have retaken October highs and continue to advance well into the fourth quarter.
If the Fed were to in fact pause rates at the current mark, markets would have a clear view of what kind of business to discount over the coming few periods. In the meantime, the market's character has shifted to risk on in response to the decision, with the stock market likely forecasting a period of better business in the coming 12 to 24 months at least.
With that in mind, it might be time for investors to start thinking of high beta, highly concentrated investment opportunities to capture the Q4 2023 risk premia being dominated by the momentum factor.
For investors seeking this kind of exposure, the Invesco NASDAQ Internet ETF (NASDAQ:PNQI) should be of consideration. The fund has a concentrated set of holdings invested across information technology, Internet and services, infrastructure, and software and services. It tracks the NASDAQ CTA Internet Index using full replication and has a 3-year tracking error of 16% to this benchmark, placing it in the 25th percentile of all ETFs. Annualised standard deviation is 26 percentage points, which may seem excessive at first, but we are unfairly penalising the fund for upside volatility here as well. Considering the YTD gains of the funds at c.42%, it is clear most of the volatility has been towards the upside.
Figure 1. PNQI long-term price evolution + beta to S&P 500 (note: Observe the periods of high correlation),
Data: Updata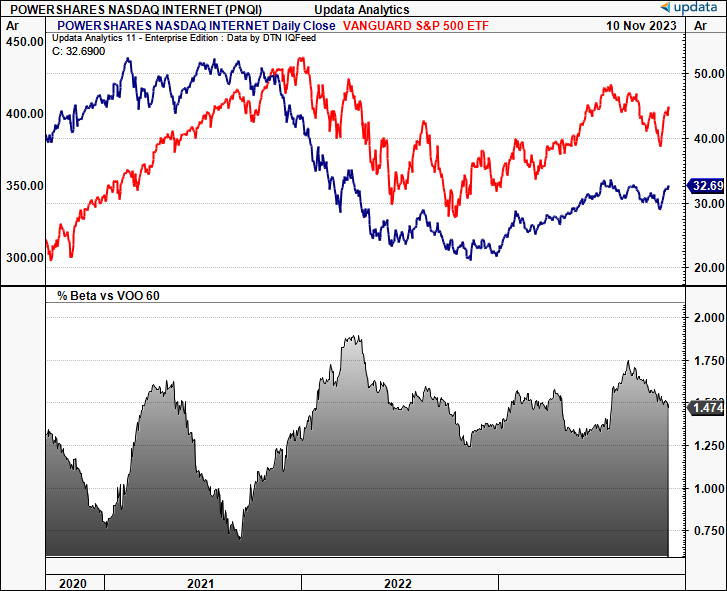
This is definitely a holding considered for more risk-tolerant investors who can manage or are mandated larger drawdowns on their book.
The fund's top 10 holdings comprise 62.5% of the portfolio, of which there are 84 securities. Sector-wise the fund is concentrated in technology and communication with 36% and 32.5% of holdings, respectively, with consumer cyclical and financials completing the remaining statistical weights. The overweighting to tech and communication services is a critical factor in the investment thesis here. If markets were to continue advancing over the next 12 months, then in my view, high beta segments are attractive plays.
Observing the fund's top 10 holdings by name, here you have a diversified tech portfolio that enables the investor to own many of the leading technology platforms in one single instrument. This in itself is constructive.
With those points in mind, my investment recommendations for all three investment horizons include the following:
Net-net, I rate PNQI a buy for the reasons discussed here today.
The debate on allocating to high beta/growth names boils down to 3 central components: Starting valuations, sector earnings + projections, and U.S. economic outlook.
(1). Starting valuations
PNQI trades at 24x forward earnings, which is marginally above the S&P 500 forward P/E of ~20-21x. It also has a weighted average book value multiple of 5.3x and a weighted average return on equity of ~15%. These are competitive prices to pay in this current market. Critically, however, whilst this is a near doubling of the category average of 15x earnings, it is actually below FactSet's segment average of around 35x. It also signals the market's expectations for this and other funds like it is higher than the averages.
So, there is already some relative value in owning PNQI at these starting valuations. Those wanting to add technology/Internet longs to their book may consider that the relative discount could be the more attractive play to bolster coming 12-month returns.
Figure 2. S&P 500 forward P/E
Source: UBS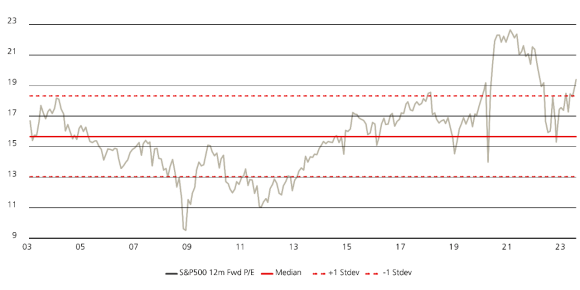
(2). Tech + communications clear leaders in earnings growth
Q3 earnings surprised many analysts and strategists on the Street, given the robust numbers that came in well ahead of estimates. Tech and communication services led the way. The blended revenue growth rate for the quarter was 2.1%, signalling the 11th consecutive quarter of sales growth for the S&P 500 constituents. Around 80% of companies have reported booked numbers that were above consensus estimates, versus 16% that reported below their mean estimates. According to FactSet, "[a]t the sector level, the Information Technology (95%) and Communication Services (91%) sectors have the highest percentages of companies reporting earnings above estimates...", which is highly significant for PNQI. It implies a fantastic period of business for many of PNQI's constituents.
Equally as important are the projections at the top and bottom lines moving forward. As figures 3 and 4 will show, both tech and communication services are in the top 2 to 3 segments with the highest projected revenue and earnings growth estimates for CY 2024. This has profound implications for the sector's outlook overcoming 1 to 3 years. The market has thrown a bid towards the tech/Internet/communications domain at the back end of 2023, and it may be that it is forecasting a period of better business and tangible growth looking out the next few years.
Figure 3.
Source: FactSet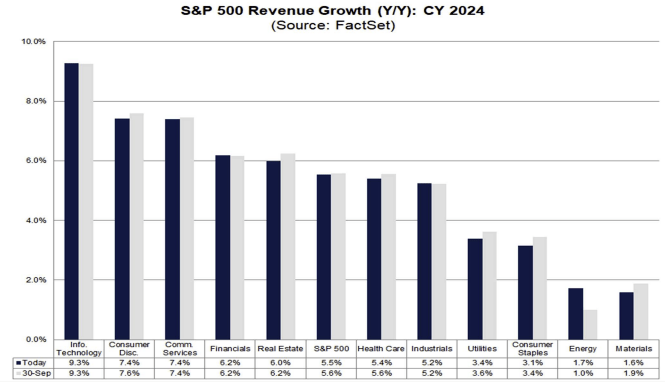
Figure 4.
Source: FactSet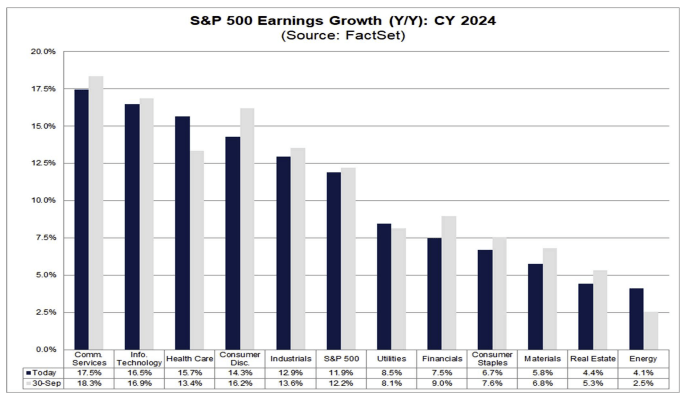
(3). US GDP can't be overlooked
The US economy still offers a compelling risk-reward profile and long-term growth outlook in my opinion. It would be unwise to bet against the speed of innovation, environment for strategy and growth, and efficient capital markets that the US possesses to perpetuate its economic machine. Q3 GDP was 4.9% in the US, the highest level seen since Q4 2021. This was driven by consumer spending, but exports were also up 6.2%, whilst inventories grew 1.3% for the first time in 3 quarters.
GDP is also in a state of normalcy after incurring a short-term derailing over the pandemic era and is showing exceptional resilience in real terms, even with inflation at multi-year highs. As seen below, real GDP is back above 10-year highs on average. The long-term outlook for PNQI and iterates the bullish view over this time horizon.
Figure 5. Growth of real GDP in the United States (Annualized), Q1 2013-Q3 '23
Source: Statista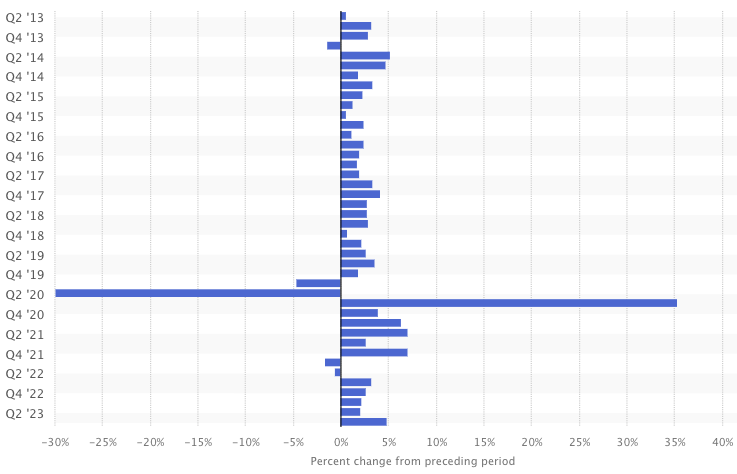
These are three constructive factors that support a bullish outlook on thematic ETFs such as PNQI. More so on the fact of its heavy weighting to tech and communications.
The reversal of October saw us gap higher twice and cross the 20-day moving average high and low. This accompanied a pivot point from the parabolic SAR, and a bullish cross in the MACD was a latent signal to signify the reversal. This is a constructive chart which is clear evidence of a rapid shift in momentum to the upside. A lengthening of the parabolic SAR indication, along with a separation of the 20-day moving average high and low lines, would be two points to watch out for in this regard. If the MACD pulls back but doesn't cross, this could also be a signal of a continuation to look out for.
Figure 6.
Data: Updata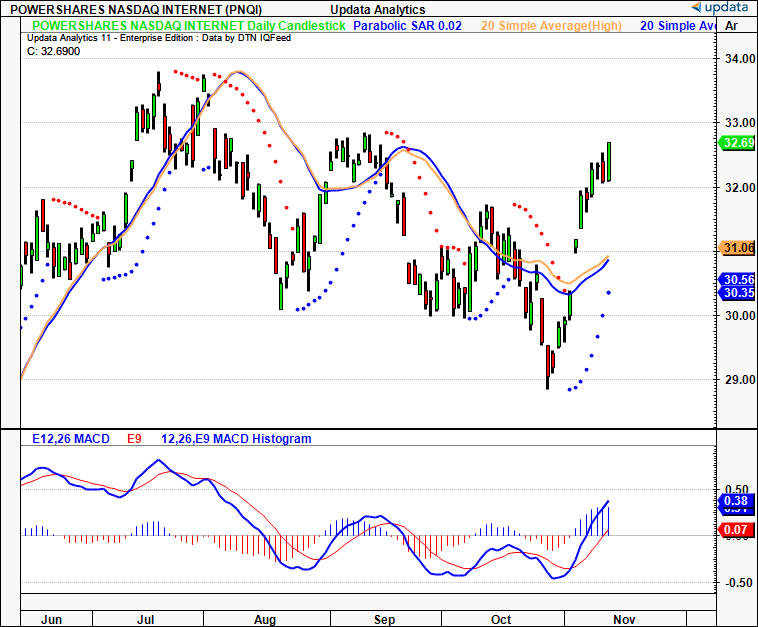
Observations: We compressed distribution in October with the bell curve completed by the month's end (see 3rd distribution from left in Figure 7). The major resistance was clearly at the $37s, and we are currently rotating about this level, as the price control is centred around this point. We have two ledges of high usage. Both seem appropriate support and resistance levels, one at $37 and one at $30. The critical fact is that we found balance last month, and expanded from the distribution as we opened in November, escaping to the upside. Because the price opened to the upside outside of the balance area, we should look out for price usage above the $30 support level. There is an unfinished auction in the $30-$31s, and one could look to these areas as support levels to allocate on as the price moves back into them to complete the auction. The price is also testing the auction high with several prints forming a shelf at the $37s, making PNIQ well positioned for a breakout to the upside.
Key levels: Watch out for pullbacks to the $30-$31 region if traders look to complete the unfinished auction there, any range extension above the $37s would be significant on the upside. Would need to see initiative selling below $30 to suggest we will expand the distribution lower.
Actionable strategy: Given the market was balanced in a compressed distribution last month, we have opened higher this month with a trending profile. There are clear areas of support at the unfinished auctions and previous POC, and the current POC is attracting plenty of competition to lineup for a breakout above the current auction high. Directional trade is therefore supported and entries below the current POC with secondary entries to lower the cost average at $30-$31 could be justified.
Figure 7.
Data: Updata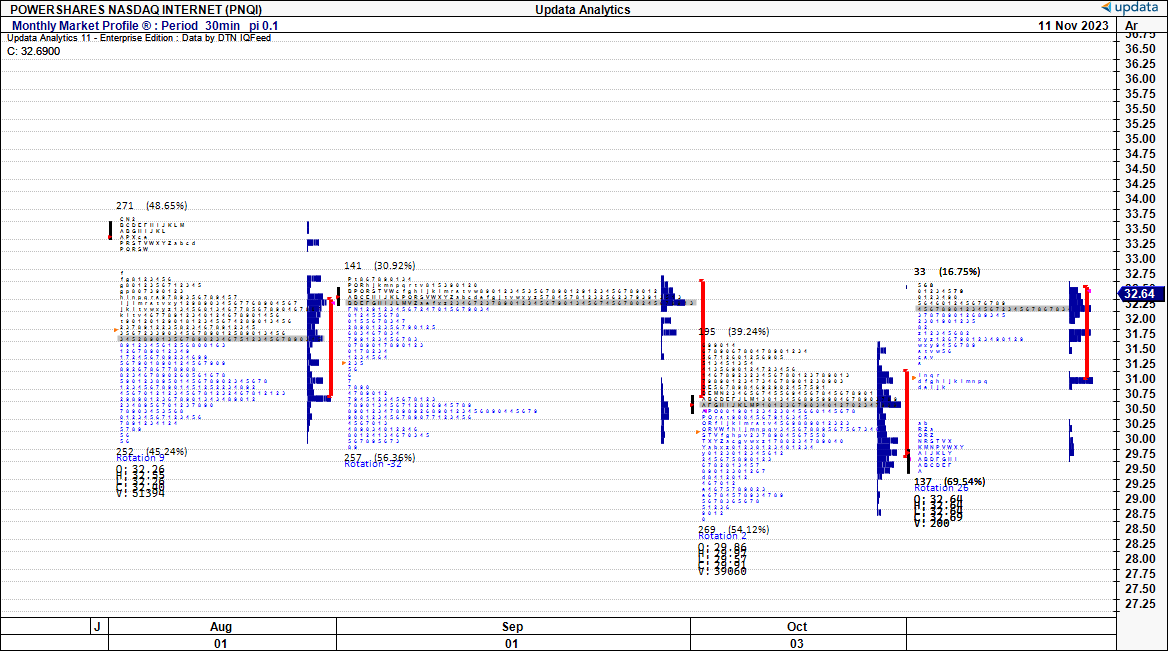
It is unsurprising therefore that we have upside targets to the $36-$37 region based on the latest price action. I would be looking to this range over the coming weeks as the price structure begins to rotate around the $36-$37 point and potentially break higher to confirm the signal. If this doesn't eventuate then we may compress into range further sideways.
Figure 8.
Data: Updata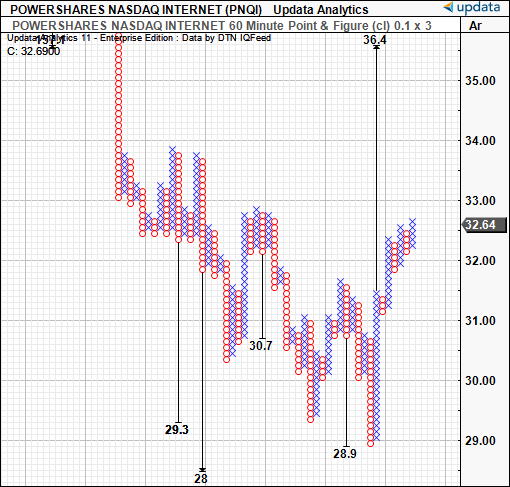
Meanwhile we have several potent indicators on the directional bias of trends for PQNI across multiple timeframes.
On the hourly chart, that looks to the coming days (short term), we are bullish above the cloud with both price and lagging line in situ. Turning line and conversion lines are also upward facing and provide key support levels.
Key levels:
Figure 9.
Data: Updata.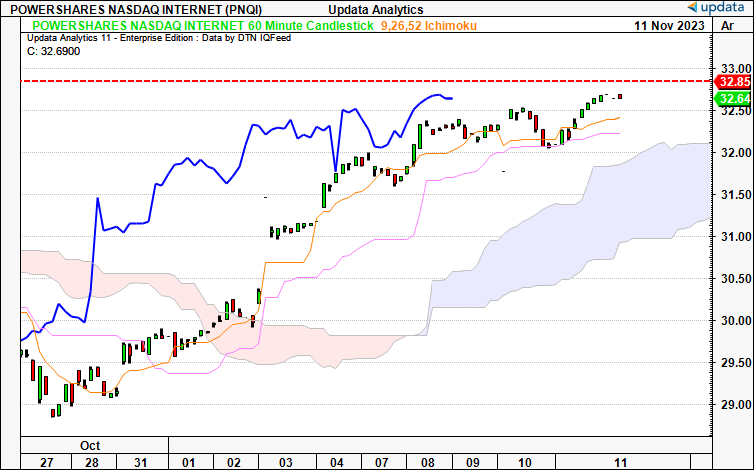
On the daily chart, looking to the coming weeks (medium term), we have just broken out of three waves down move, poking above the cloud top last week. This came after two gaps higher after a morning star formation to finish October. The 2nd gap reclaimed the Marabuzo line in September. We have since had 3 bullish Marabuzo candles that extended the range each session as evidence of the continuation. The lagging line is also above the cloud after its near vertical move off October lows. The turning line has just crossed above the conversion line to corroborate the short-term momentum.
Key levels:
Figure 10.
Data: Updata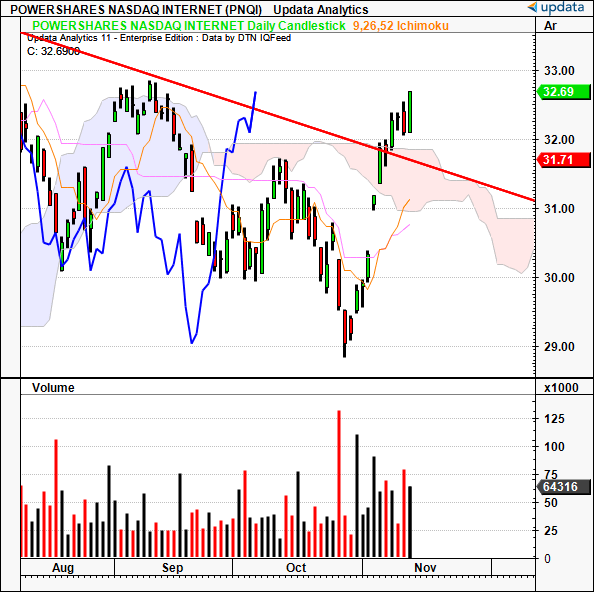
Finally, on the weekly chart that looks to the coming months, the price line has crossed the clouds to the upside around three months ago. Critically the lagging line is pushing towards the cloud top as well. Both turning line and conversion lines are in bullish territory and we have just crossed them both within the last two weeks' price range.
Key levels:
Figure 11.
Data: Updata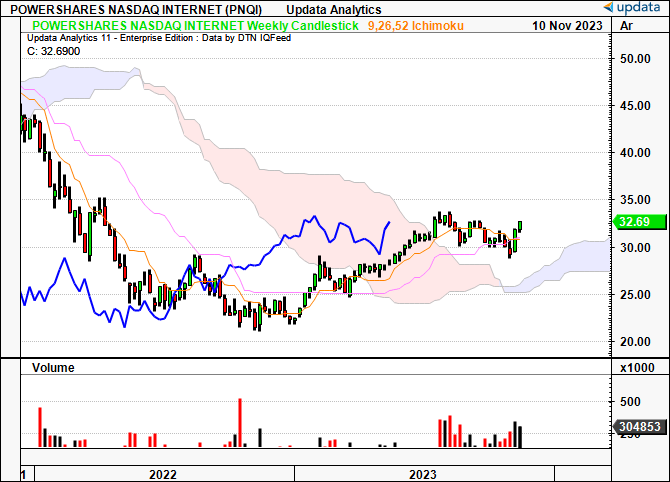
In short, there is compelling evidence that PNQI sits within the buy zone for investors with higher risk tolerance and moderate risk parameters. The fund's concentrated exposure to tech and communication services provides it with the scope to rally alongside highly correlated markets. investors have lifted the bid on all the broad indices since the Fed held its hiking cycle earlier this month. This is corroborated by PNQI's fundamentals across all three investment horizons and the emerging technical picture that lays weight to today's market as the entry points. Net-net, I rate PNQI a buy.