NurPhoto/NurPhoto via Getty Images
NurPhoto/NurPhoto via Getty Images
Based on my evaluation of PNC Financial Services Group (NYSE:PNC), the bank appears to be a very average bank that does not really stand out at being particularly good or bad, fundamentally when taking in the full picture. PNC has shown slow growth in revenue and an average net interest margin through the last decade. However, it stands out in terms of credit risk management as it consistently maintains a net charge off ratio above industry average. The efficiency ratio does have room for improvement when it comes to cost management falling below industry standards. Nevertheless, my valuation suggests that PNC Group has the potential to deliver a 10.6% compound growth rate in its stock price over the next five years. While its business fundamentals may not be extraordinary, the valuation makes it a hold at the current share price of $148.13.
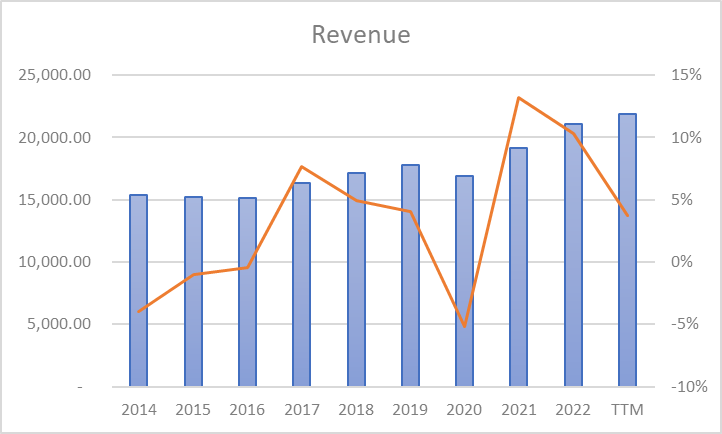
Over the past 10 years, PNC Group has produced slow and steady revenue growth increasing from $15,375.00 million in 2014 to $21,911.00 million in the last twelve months, representing a CAGR of approximately 3.2%. I believe this slow pace of revenue growth will continue into the future where analysts expect that revenue will decrease slightly in 2024 to $21,310.00 million.
Created by Author, Data from Wisesheets
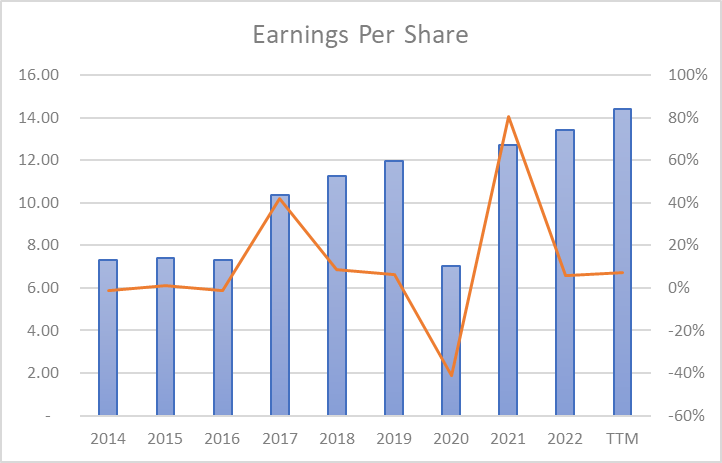
I perceive that earnings per share growth in the past 10 years to have been moderate, where EPS went from $7.30 in 2014 to $14.41 in the TTM, exhibiting a compound annual growth rate in the region of 7%. Analysts estimate that in 2024 EPS is forecasted to arrive at $11.96 suggesting that it is forecasted that earnings per share growth will be -17.0% YOY.
Created by Author, Data from Wisesheets
We will now direct our attention to net interest margin. I believe that when analyzing the net interest margin, it is imperative to examine the quality of loans held by the bank on its balance sheet. PNC Group places an emphasis, on industrial loans which constitute almost 70% of their overall lending portfolio. In addition to this focus, PNC is also involved in asset management, brokerage services, capital markets advisory, card and cash management as residential mortgage services. This diverse range of offerings showcases PNCs involvement in business financing and their commitment to providing financial solutions, for both corporate and individual customers.
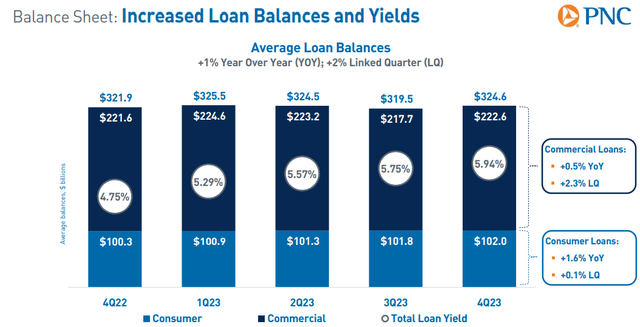
PNC Investor Relations
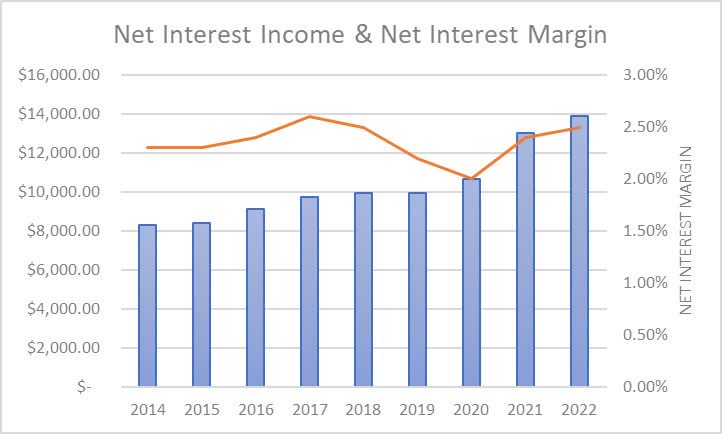
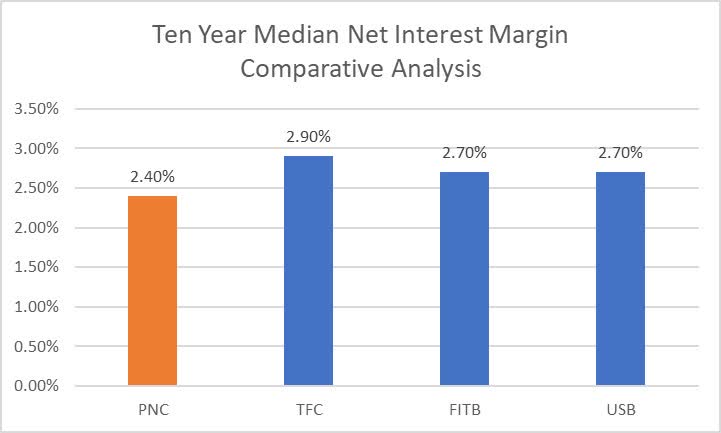
With that being said PNC Group has achieved a median net interest margin over the previous ten years of 2.4%.
Created by Author, Data from Wisesheets
As we compare PNC’s decade-long NIM when juxtaposed with its major competitors of Truist Financial Corp (TFC), Fifth Third Bancorp (FITB), and US Bancorp (USB), each hold a ten-year median net interest margin of 2.9%, 2.7%, and 2.7%, respectively. This puts PNC as containing the fourth highest ten-year median net interest margin.
Created by Author, Data from Wisesheets
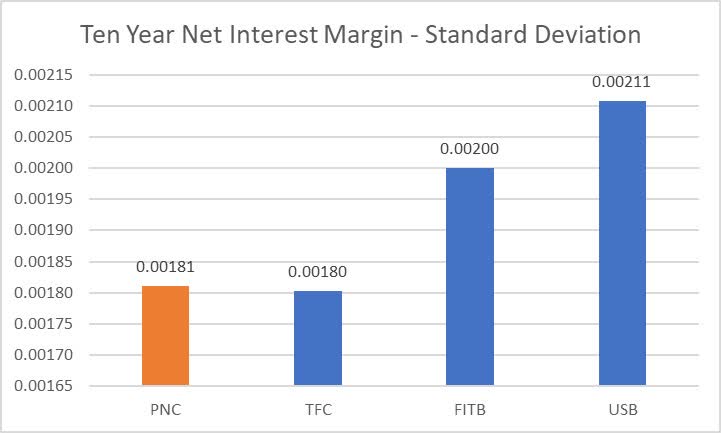
I feel an additional significant factor to observe is the uniformity of the net interest margin. A stable net interest margin tends to indicate superior loan quality, while a fluctuating net interest margin generally signals inferior loan quality, this makes forecasting the bank’s future operations more complex and the outlook less certain. In the case of PNC, the net interest margin’s ten-year standard deviation is 0.00181, which classifies it with the second lowest NIM standard deviation amongst its peers. Hence, I consider this as evidence that PNC in recent times this company has shown efforts, in keeping its net interest margins stable when compared to other similar institutions. This suggests that there might be less risk associated with their loan book despite the underperforming NIM.
Created by Author, Data from Wisesheets
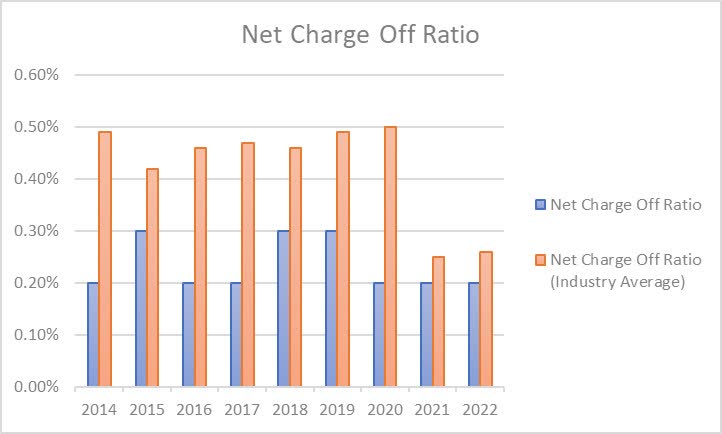
From my perspective, an additional crucial indicator for evaluating the loan book’s quality is the net charge-off ratio. As illustrated in the following data, during the last decade PNC has observed their net charge-off ratio ranging between 0.30% and 0.20%. When we put this alongside the banking industry, PNC Group from 2014, to the last twelve months PNC Bank has consistently kept their Net Charge Off Ratio below the industry average. This indicates that PNC has been successful in handling credit risk and debt collection when compared to other banks. One possible reason for this performance could be PNCs focus on industrial lending, which involves thorough credit assessment procedures. This disciplined approach to managing credit risk showcases a risk management framework positioning PNC in a position for financial stability and resilience, against potential credit losses.
Created by Author, Data from Wisesheets
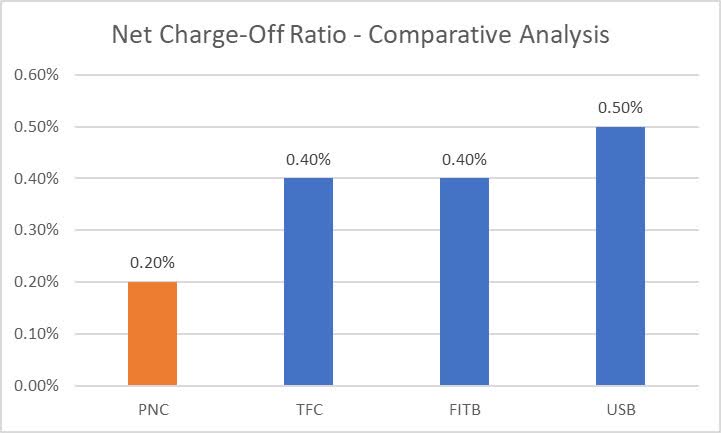
As we compare PNC’s ten-year average net charge-off ratio against its peers, we can see that TFC, FITB, and USB every one of them has a ten-year median net charge-off ratio of 0.40%, 0.40%, and 0.50%, therefore PNC is rated first within this assessment. Because PNC has a ten-year median NCO ratio of 0.20%, I feel that PNC is well positioned to increase the leverage of the loan book to drive better returns on equity.
Created by Author, Data from Wisesheets
Leverage is another tool I like to use when assessing the balance sheet risk of banks. In particular, I believe the assets to equity ratio is a key driver of the future return on equity. Regarding my overall position, I find higher leverage acceptable when net charge-offs are minimal; conversely, I favor lower leverage if the bank engages in riskier loans like personal credit, construction loans, and auto loans. Regarding PNC Group, it has reported a decade-long median asset to equity ratio of 8.2, where it is clear that from 2015, to the twelve months PNC has been experiencing an upward trend in its assets to equity ratio especially in the periods where interest rates were on a downtrend. It reached its peak in 2023 at 12.17 before settling at 11.27 in the trailing twelve months. The long term trend signifies that the bank has been increasing its leverage possibly to support growth or enhance returns on equity. However the recent decrease indicates an approach, towards leveraging, which aligns with the broader industry’s focus on maintaining a strong capital structure to mitigate risks related to market volatility. It should be noted that the bank is still well above its own historic average despite the recent decreases.
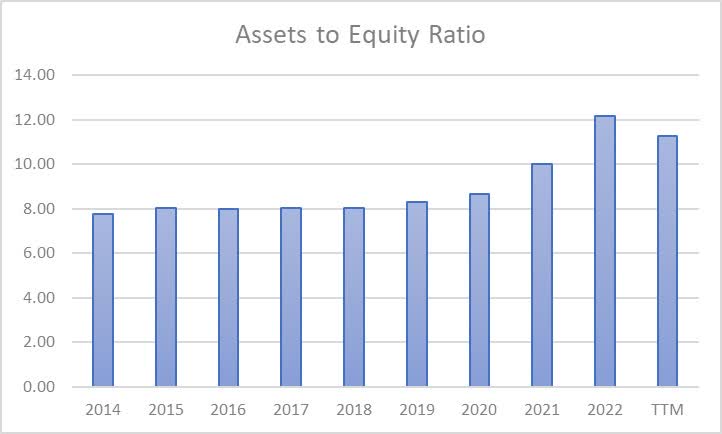
Created by Author, Data from Wisesheets
As we can observe, PNC Group has the second lowest level of leverage relative to its peers, and noting that PNC also has a better than average net charge-off ratio, this indicates that the management team are prudent when it comes to managing balance sheet risk since they have a lower than average net charge-off ratio but also maintain lower amounts of leverage compared to their peers. This makes the bank's balance sheet safer but limits of likelihood of achieving outsized returns on equity when compared directly to its peers.
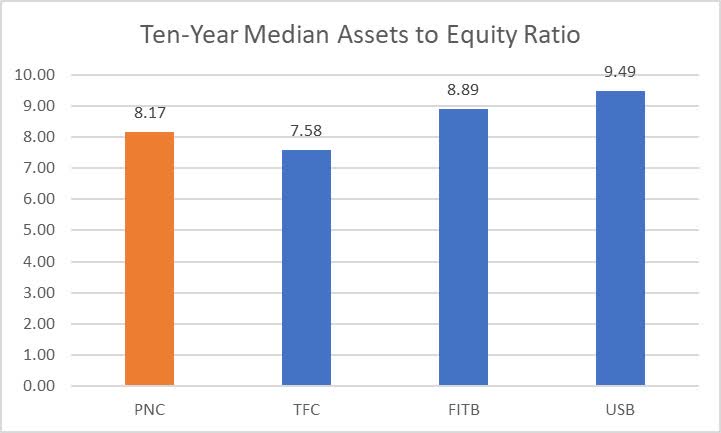
Created by Author, Data from Wisesheets
In my opinion, the efficiency ratio is a key metric for showing the effectiveness of banks in managing their overheads, where a 60% efficiency ratio is seen as the standard in the banking industry. Between 2015 and the recent twelve months PNC Banks efficiency ratio had its ups and downs reaching a peak of 77% and a low point of 58%. This indicates that the banks operational efficiency has shown some variability with periods of increased costs compared to revenue. Currently the efficiency ratio sits at 64% in the TTM period indicating an improving approach, to managing costs but the bank still sits above the ideal ratio of 60%. Since 2015, PNC has only managed to have their efficiency ratio below 60% one time in the last decade. Therefore, in my opinion this shows that the management team likely could have done a better job at reducing overhead expenses and in consequence also increasing the businesses overall profitability.
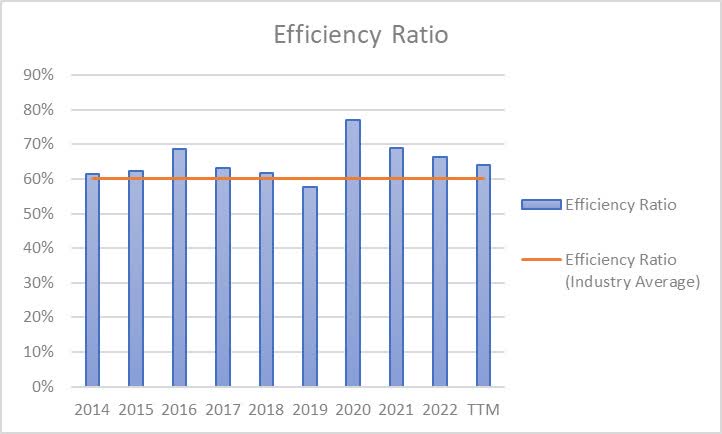
Created by Author, Data from Wisesheets
As we compare PNC’s ten-year median efficiency ratio in comparison to its counterparts, it is clear that TFC, FITB, and USB each possess a ten-year median net charge-off ratio of 61%, 58%, and 56%, consequently PNC is rated highest amongst its competitors. Thus compared to the other banks, there is most likely room for the management team to trim down on overhead costs to improve earnings.
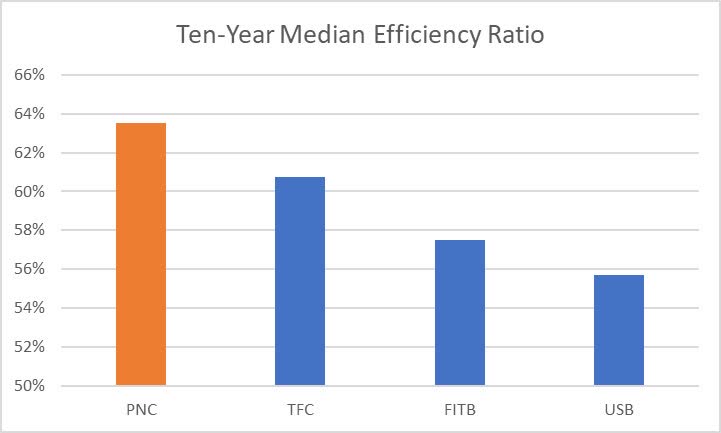
Created by Author, Data from Wisesheets
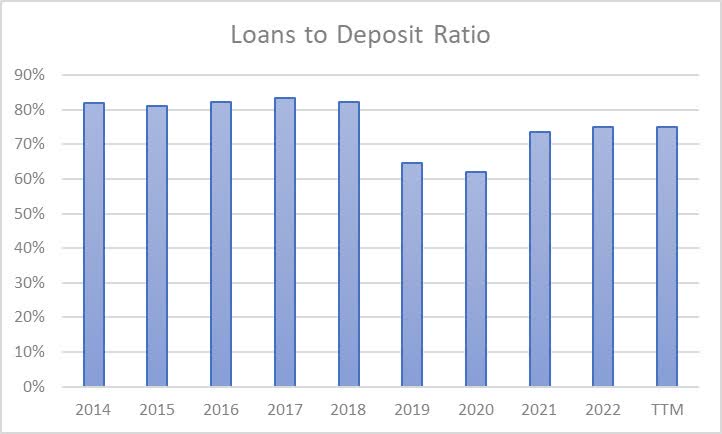
In my opinion it is important to compare a bank's deposits and sources of funding, with those of competing institutions. This analysis allows us to understand how costs impact a banks deposit profile and evaluate the likelihood that these deposits will remain stable which has an impact on the banks NIM. One vital indicator I monitor is the loan to deposit ratio. Ideally, keeping this ratio below 100% suggests that there’s no need for additional, more costly funding sources, including Federal Home Loan Bank Advances. Concerning the matter of PNC Group, over the course of the last ten years, they have achieved a loan to deposit ratio of beneath 100% in all ten years of the last decade. This demonstrates that the deposits side of the bank is strong and that the bank consistently has access to cheaper funding sources such as deposits within bank accounts and certificates of deposits.
Created by Author, Data from Wisesheets
Within the last year, the sum of non-interest bearing deposits comprised a total of 24% of the bank’s total deposits. Undoubtedly, non-interest bearing deposits as a funding source enhance net interest margins. However, I believe these deposits are less reliable, often being short-term and prone to withdrawals by customers when a competing bank offers more favorable interest rates. While interest-bearing deposits are costlier for banks as a funding source, these deposits tend to be more long-term and reliable. Since 2021 PNC has experienced a decrease of 18.6% in non-interest bearing loans which we have seen be the common trend in the banking field because of heightened interest rates and a collective decrease in liquidity. Since this trend is industry wide and given that the bank has a strong loan to deposit ratio, I believe that the deposits and funding sources side of the business is strong.
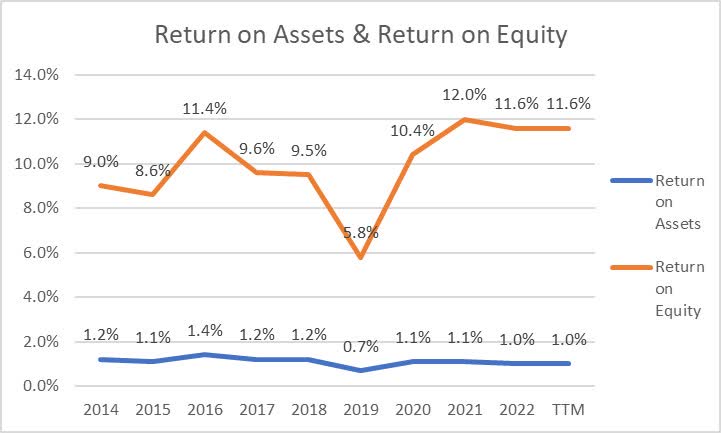
PNC Group in the course of the last ten years, has posted a median return on assets of 1.1%, while they have achieved a ten-year median return on equity of 10.0%. From 2015, until the last twelve months, PNC’s return on assets went up to a peak of 1.4% in 2017. It has then seen lows down to 0.7% in 2020 indicating varying level of returns on the asset base. The return on equity also showed fluctuations reaching a high of 12.0%. Despite some ups and downs the ROA of 1.0% and ROE of 11.6% achieved in the recent twelve months points to solid return ratios considering the interest rate increases which has not affected the PNC.
Created by Author, Data from Wisesheets
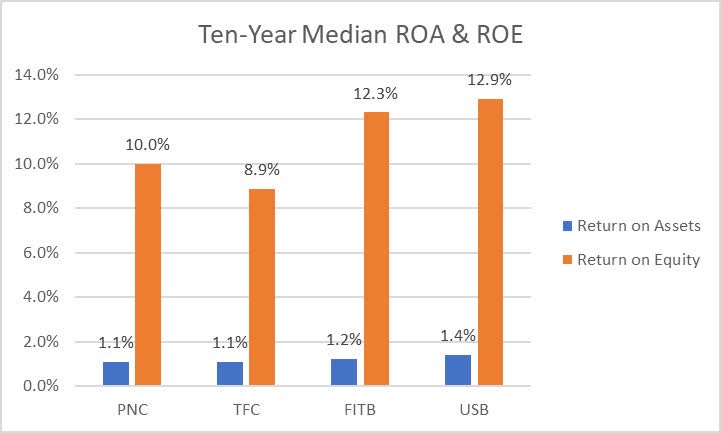
In the process of comparing PNC against its competitors, during the past decade, we can notice that PNC has the third greatest return on assets and the third highest return on equity. It is important to consider that a higher return on equity is not always superior to a lower return on equity (although it usually is) as an astute analyst should consider how much extra risk (higher leverage or risker loans) the bank took, if any to achieve the outsized returns on equity. Bearing this in mind, considering that both return on assets and return on equity have trended lower over recent years compared to earlier years and since the management team have effectively managed net charge-offs and loan book leverage, I consider the return on equity to be acceptable but not spectacular.
Created by Author, Data from Wisesheets
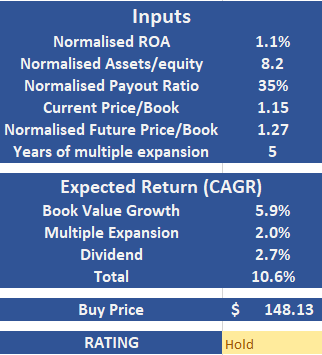
In the process of determining valuation for PNC Group, I have chosen to implement the following conditions:
Created by Author, Data from Wisesheets
As shown previously, I foresee that PNC Group across the next five years will deliver to shareholders a CAGR of 10.6%, of which 5.9% is projected to stem from book value growth, 2.0% is expected from multiple expansion and a further 2.7% returns is expected from the annual dividend. Hence, I think that PNC Group currently represents a hold when accounting for the current share price of $148.13.
Investing in PNC stock comes with a risks that potential investors should carefully think about. One key concern is how well the company has historically managed its efficiency ratio, which's a measure of the banks operational effectiveness. Over the past decade PNC has only managed to bring its efficiency ratio below the industry average of 60% once suggesting that the management team are not overly skilled in reducing expenses to enhance operational efficiency. Additionally another layer of risk lies in PNCs loan portfolio composition. Around 70% of their loans are allocated to clients who have purchased industrial real estate, which are generally considered riskier than lending to client who have purchased residential real estate. In times of recession industrial loans become particularly vulnerable as the likelihood of net charge offs increases. I believe there is potential that this level of concentration in industrial lending could potentially put pressure on PNC especially during economic downturns.
In my opinion, based off the banking fundamentals that we have analyzed PNC Group is definitely a mixed picture. PNC has delivery revenue growth at a CAGR in the low single digits over the past decade, with an average at best net interest margin. PNC however has displayed strong credit risk management in terms of net charge offs. In terms of PNC's efficiency ratio, it has shown to be below industry standard of 60% in 9 out of the last 10 years, indicating room for improvement in cost management. Despite these challenges, the valuation analysis shows that PNC Group is poised to deliver a stock price CAGR of 10.6% to shareholders over the next five years. Though, due to this bank offering nothing spectacular in terms of business fundamentals, I think it is a hold at the current share price of $148.13.